ICP: Balancing Risk and Potential💬 My Take:
The project has been overlooked for a while, but the current price structure suggests the story might not be over yet.
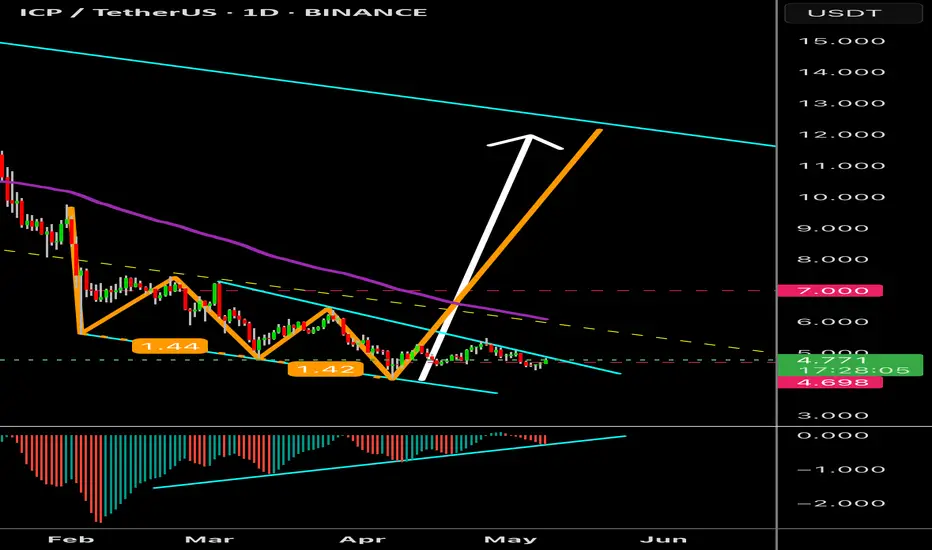
Price action looks like it's setting up for a potential next leg — the only question is when the trigger comes.
🎯 Conclusion:
The market isn't giving a clear signal yet — but this zone is worth watching, offering a solid risk/reward setup for those entering now.
Still, keep in mind: if the bearish scenario plays out, ICP could revisit the autumn 2023 lows. That risk must be factored into your strategy.
ICPUSDT trade ideas

ICPUSDT UPDATE
Pattern: Falling Wedge Breakout
Current Price: \$5.942
Target Price: \$12.70
Target % Gain: 130.45%
Technical Analysis: ICP has broken out of a long-term falling wedge pattern on the 1D chart. Strong breakout candle with rising volume confirms bullish momentum. This breakout has the potential to initiate a major reversal.
Time Frame: 1D
Risk Management Tip: Always use proper risk management.

Internet Computer Protocol $81 Easy Target Yields 1,450% ProfitsIf you saw the Injective chart you know what happens after a correction, a classic ABC correction. What follows a correction is a bullish impulse.
A target of $81 gives us more than 1,450% profits potential for this pair, ICPUSDT (Internet Computer Protocol).
This is a project that was damaged by the SEC's decision to label it a security, remember? The SEC today is no longer the same as back in those days. It is different now. The SEC is crypto-bullish, the SEC is friendly and whatever damage was caused will be reversed, make no mistake.
Right now ICP is moving within it's long-term accumulation zone. As the name implies, a zone that is good to buy for those focused on long-term hold. Even if you are looking at the short-term or mid-term, this right now is a great entry, great timing, the best possible prices preceding the 2025 bull market phase.
It was a while back when I first saw the possibility of the bull market extending beyond late 2025. This scenario/possibility is now becoming stronger with many projects supporting this view. The chart of many stable, long-term projects are pointing to growth leading into the first half of 2026. Q1 and Q2 2026. This would definitely be the best ever.
Will the next bull market peak in late 2025 or early 2026? Make your guess. What cannot be doubted is that we are going up next. Up, up, up. Are you prepared?
Preparation comes in the form of a plan, and lots of money injected into the market. Buy like the world is about to end. Start buying and continued buying, everything you can. You will be very happy with the results, I promise.
Thank you for reading.
Namaste.

ICP ROADMAPTo me the view is pretty clear.
* The purpose of my graphic drawings is purely educational.
* What i write here is not an investment advice. Please do your own research before investing in any asset.
* Never take my personal opinions as investment advice, you may lose your money.

The chart presents a technical analysis of ICP/USDT on the 2-wee
📊 Technical Overview:
Pattern Identified: A Falling Wedge breakout to the upside — a classic bullish reversal pattern after a prolonged downtrend.
Breakout Confirmation: The breakout occurred near a key support level, increasing the reliability of the move.
Current Candle: Bullish candle above the wedge, confirming breakout strength.
🎯 Potential Price Targets:
First Target: $10.866
Second Target: $14.831
(Implying a potential upside of over +180% from current levels)
📉 Stop Loss:
Positioned at $2.709, below the previous low to invalidate the setup if breached.
✅ Conclusion:
ICP has broken out of a long-term falling wedge after months of correction. The breakout suggests a strong potential for a bullish rally towards the marked targets, as long as it holds above the support region.

ICP - Perfect Long OpportunityDescription
---------------------------------------------------------------
+ ICP has started reversal inside the channel and the price is heading towards the resistance zone, this gives a bullish trade opportunity.
---------------------------------------------------------------
VectorAlgo Trade Details
------------------------------
Entry Price: 5.3
Stop Loss: 3.3
------------------------------
Target 1: 6.9
Target 2: 12.7
Target 3: 22.5
------------------------------
Timeframe: 1W
Capital Risk: 1-2% of trading amount
Leverage: 5-10x
---------------------------------------------------------------
Enhance, Trade, Grow
---------------------------------------------------------------
Feel free to share your thoughts and insights. Don't forget to like and follow us for more trading ideas and discussions.
Best Regards,
VectorAlgo

ICPUSDT 1D#ICP has broken above the falling wedge and the MA50 on the daily chart, and the retest has been successfully completed. Expect more bullish movement from here. Targets are:
🎯 $6.854
🎯 $8.506
🎯 $9.841
🎯 $11.176
⚠️ Use a tight stop-loss.

ICPUSDT 1D AnalysisICP ~ 1D Analysis
#ICP Buy gradually from here if you still have confidence in this coin with a short term target of at least 10%+ from here.

Nice push to the top? ICP/USDTHolding nice at the green line. Let’s go for a great push to the top. The monthly green line had a perfect bottom on $12.5
What do you think?

Plan for ICPIm super bullish on this one. BTCD and USDT going down. If the bottom is in then this would be it for me.

Nice Breakout ICP / USDT - Internet ComputerNice breakout at the green line. If we go back to $20,-. Long term prediction $80,-

$ICP: Internet Computercup and handle on the weekly timeframe with a trend line breakout, double retest, oversold rsi, and bullish looking mac d. do whatever you like with this information. not financial advice, gaming advice 🎮
CRYPTOCAP:ICP
BINANCE:ICPUSDT
COINBASE:ICPUSD
BINANCE:ICPUSD

Potential Bullish 3 drive pattern in action We might see the results of a potential bullish 3 drive pattern, confirmation can be when price action breaks resistance of pattern, and support holds! Bullish divergence!
Analysis From Elliott Wave Principle ViewBINANCE:ICPUSDT
1 Week Timeframe Chart, Not a financial advice

$ICP Gearing to Fly! = Adam & Eve + Descending ChannelHey traders!
ICP is showing a textbook Adam & Eve Double Bottom inside a Descending Channel — and it's gearing up for a major breakout! 📈
🔥 Key Highlights:
Pattern: Adam & Eve reversal formation spotted ✅
Structure: Descending Channel breakout imminent ✅
RSI: Bullish momentum confirmed with breakout above 50 level ✅
Volume: Healthy uptick in volume during Eve formation ✅
Major Support Zone: $4.50 - $4.90 (strong historical demand)
🎯 Target Levels (Fibonacci-Based):
TP1: $5.99 📈
TP2: $7.26 🚀
TP3: $8.71 🛸
TP4: $9.79 🌕
🛡️ Risk Management:
Invalidation: If price drops below $4.60 support zone ❌
📈 Trade Idea:
Waiting for daily close above the neckline (~$5.30) with strong volume confirmation before entering. 🚀
🧠 Notes:
Conservative traders can wait for a clear retest of the breakout line.
Aggressive traders may enter on breakout candle with volume confirmation.
🔥 Community:
If you found this helpful, smash the LIKE button ❤️, follow me for more setups, and share your thoughts in the comments! 🚀
Let's grow together, team! 💬
#icp #icpusdt #crypto #cryptotrading #priceaction #chartpattern #breakout #bullish #tradingview


ICP bullish scenario C&HSeeing this C&H possibly forming on ICP.
If cup forms, will look for a significant retrace around the 618 fib level for the handle.
And possibly a pump out of the handle but will look at charts closer to the time.

ICP/USDT Breakout Potential: Descending Trendline Under PressureThis is the 4-hour chart for ICP/USDT, and it’s showing some interesting action. Over the past few months, ICP has been stuck in a downtrend with a clear descending trendline acting as resistance. However, each time it formed a falling wedge pattern, we saw a breakout to the upside, followed by short rallies.
Right now, the price is hovering around $5.10 and seems to be testing that same long-term trendline again. If it breaks above this level with strong volume, it could be the start of another bullish move. Definitely a chart to keep an eye on for a potential breakout in the coming days.

Internet Computer (ICP)ICP project was announced with great fanfare and promised great features. However, ICP's price was in a long downtrend until recently when price broke the downtrend line and made a higher high and a higher low. It's too soon to surmise the major trend reversal has happened since at least another higher high and higher low is needed. Let's see what happens.

TradeCityPro | ICP: Breakout Watch in Web3 Veteran’s Price Range👋 Welcome to TradeCity Pro!
In this analysis, I’m going to review the ICP coin for you. The Internet Computer project is one of the older projects in the crypto space, focused on Web3 and gaming.
⚡️ The coin currently has a market cap of $2.65 billion, placing it at rank 36 on CoinMarketCap.
⏳ 4-Hour Timeframe
As you can see in the 4-hour timeframe, a range box has formed between the levels of 4.648 and 5.239, and the price has currently reached the top of the range.
✔️ During this upward leg from the bottom of the box, market volume has been increasing, which indicates that the probability of breaking through 5.239 is high.
🔍 If 5.239 is broken, we can enter a long position. The next resistance levels are at 5.558 and 6.313.
✨ There’s also a larger range box between 4.648 and 6.313, and as long as the price stays above 4.648, we can say that this broader range is valid and price is fluctuating within it.
📉 To open a short position, wait for the break of 4.648. The momentum in higher timeframes for this coin is bearish, so if this level breaks, the trend may continue downward with another leg to the downside.
📊 For that to happen, selling volume must increase, so that when 4.648 breaks, there is no volume divergence, ensuring a healthy continuation of the trend.
📝 Final Thoughts
This analysis reflects our opinions and is not financial advice.
Share your thoughts in the comments, and don’t forget to share this analysis with your friends! ❤️

ICP/USDT.dLooking at an opportunity here. Price broke monthly resistance and came back to mitigate the demand zone. Price in the entry zone for a long trade... A monthly bullish candle would be great here to confirm bias

ICPUSDT 1D AnalysisICP ~ 1D Analysis
#ICP Buy gradually after successfully breaking through this resistance line, with a short-term target of at least 10% gain.

ICP bullish ideaICP price back at low support level.
Showing bullish price action on low timeframe.
Invalidation is the previous low.
