ICP is going to $50! [By Ivan | Skyrex]Hello, everyone!
BINANCE:ICPUSDT is another one altcoin which can make investors reach in the upcoming months. We have already seen the ending diagonal at the very bottom. Now we can see the breakout.
Fibonacci 0.61 for the last downside impulse is the legit target for this potential move.
Follow us and never miss update!
ICPUSDT trade ideas

My opinion on the price reduction in ICPUSDTAccording to my strategy, the exit and price reduction has been issued.

My opinion on the price increase in ICPUSDTAccording to my strategy, the price increase signal has been issued.

ICP wishful thinkingLets imagine a scenario where developers start to build on ICP en masse.
It's the most superior layer 1 blockchain out there bar none.
We could see it repeat what ETH did in 2017, taking #2 or #3 spot after BTC.

#ICP/USDT 2D (#BinanceFutures) Big falling wedge break & retestInternet Computer seems to have found bottom on historical demand zone, RSI entered oversold territory, recovery towards 100EMA would make sense.
⚡️⚡️ #ICP/USDT ⚡️⚡️
Exchanges: Binance Futures
Signal Type: Regular (Long)
Leverage: Isolated (1x)
Amount: 9.4%
Current Price:
3.804
Entry Targets:
1) 3.390
Take-Profit Targets:
1) 6.098
Stop Targets:
1) 2.305
Published By: @Zblaba
CRYPTOCAP:ICP #ICPUSDT #InternetComputer #Dfinity #Web3
Risk/Reward= 1:2.5
Expected Profit= +79.9%
Possible Loss= -32.0%
internetcomputer.org
dfinity.org

ICP Weekly PredictionA price prediction for LSE:ICP for Alex and Claudiu. Based on pure speculation, nothing else. Alex bets that ICP will go to $300-$400. I'm a bit less hyped, but let's see :)

Weekly 50 EMAIcp has reached weekly 50 ema
Can stiöö go to 55 ofcourse or where ever, that zone co exists w the last HI..... Should the SL be triggered?
Can have pullback soon, or then not, since weekly rsi is at bullish zone

$IcpA descending channel has taken shape within the 3-day timeframe. Upon confirmation of a breakout, anticipate a potential increase of over 200%.

ICPUSDT is going to FVG 1M and +25%ICPUSDT stucked between two levels, after breaking that, it will pump to FVG 1M +25% from now.


#ICPUSDT #LQR #TOBTC #LaqiraProtocol It is in the daily resistance Level . It is expected to be created after liquidity collection after confirmation of the position of the sell. According to your own strategy, look for reasons to enter. This analysis is a personal point of view and is not an offer to buy or sell.

ICPUSDTWith the continuation of the rise of Bitcoin, the price of this ICP currency has also taken an upward trend and will probably continue up to the 7.20 area.

Momentum Icp pamping nicely but time to take profits, price actipn getting more n more intresting, maybe the most intresting ever
Rsi weekly 50 is under observation but it also kinda tested

ICPWeekly plan for #ICP in action. Everything is on the chart
#BTC #Bitcoin #CryptoCommunity #BRISE Bitcoin ETF Coinbase SEED_ALEXDRAYM_SHORTINTEREST1:GFY Lunc

ICP Update
On the daily chart, price is being held by strong resistance around 4.80.
We have broken and retested the green descending trendline.
I am biased for a break to the upside, but I'd prefer if we at least got a pullback to 50%, to have long trades with better probabilities.

ICP looks great on higher timeframes.The price consolidated above an important level, all pullbacks were successfully bought back.
The minimum goal is 30%, and I’m even afraid to imagine the maximum..

ICP breakout..ICP reached the ceiling of the bearish channel on Weekly time frame, breakout incoming..

ICP is resdy for jumpit can start its move from hear to 9$ or it can go back to 4$ and after that start its move
but it is important that the icp has broken its own resistances

Weekly resistanceJust an idea
ICP and crypto market had a nice YEAR
UP UP UP
now need to set the stage for ALT season that should follow BTC halvening
This setup would provide a confirmed Bullrun IMO

Don't shoot the messengerJust an idea
ICP and crypto market had a nice YEAR
UP UP UP
now need to set the stage for ALT season that should follow BTC halvening
This setup would provide a confirmed Bullrun IMO

LiquidityLiquidity is down there behind those stop losses
should market makers go after them what do you think
everyones long now right :D ?

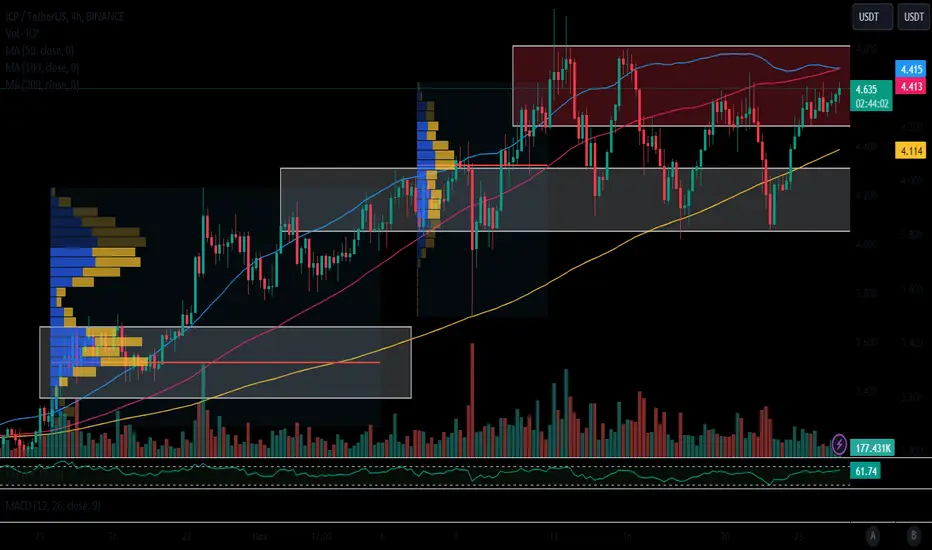
ICP Token Can't Break Resistance!? This Analysis Brings Clarity.ICP is mirroring Bitcoin and Ethereum in their difficulty to break their Weekly resistance zones. This is the 4th attempt since November 12th that the price tried to clear and hold above $4.80, will it hold this time?
How do we trade this?
ICP is in a bull channel, which means our bias should be toward the upside. That does not mean it's the *only* data point to consider, we're also at resistance without a bear signal bar, so don't dive into a short just yet! We also have the 200EMA below us at $4.20, which is likely to act as support given that the overall trend is bullish.
Given these data, it's reasonable to look for a bear signal bar closing on or near its low to get short, then take some or all profits just above the 200EMA. Wait for more price action at that level to see if we get another leg up, or hold the rest of that short position to lower prices.
Key Points
1. Bull Channel, Bias to Long.
2. 4th Attempt to break Resistance Happening Now.
3. If the 4th Rejection Happens, a Short is Reasonable.
4. Watch 200EMA for Support
5. RSI at 63.00, Bias to Fall.
You are solely responsible for your trades, trade at your own risk!
If you found this analysis helpful, click the Boost button and let us know what you think in the comment section below!

Internet Computer (ICP) Next TargetInternet Computer (ICP)
Contrary to other altcoins, ICP has shown a relatively muted response to the BTC rise. Although the asset has appreciated by 70% since October 15, it has not yet reached a new annual high, and the ICP growth rate remains somewhat sluggish.
Currently, the asset is trading between a support zone of $3.94-$4.18 and a resistance level of $4.64-$4.96. If BTC continues its sideways trend above $37,000 or maintains its upward movement, ICP might follow a similar trajectory. The next target for buyers could be the psychological level of $5, with an additional notable level at $5.42 just above.
In the event of a correction, ICP could retest its current buyer's zone, as well as potentially drop to the level of $3.78 and into the range of $3.5-$3.7.