ICX.btc Rocket still going but Caution: Major Resistances aheadUpdate to my Previous Plot that Caught the EXACT Bottom (click) .
Icon has been been the super star rocket of the week.
It has blasted through several resistance zones already.
But we are heading towards "wave ending" fib ratios.
Of course, it may still keep blowing through resistances as if non-existent.
But as we all know, it could come crashing back to earth at any moment.
So this map is designed to spot possible top and then retrace points.
3622-3701 is immediate resistance that we just hit and was noticed.
3897-3943 is the next zone, should be even stronger that last one.
4655-4721 is probably the maximum expectable for this wave.
If we stall out and start a significant retrace, I will post a new plot.
We may have topped at the time of this posting, am watching closely.
I am now Trailing a Stoploss, keeping a fib between me and the price.
Here is the previous map that caught the bottom (and all fibs are still relevant):
ICXBTC trade ideas

ICX/BTC H4What a charge in ICX.
If the price holds above 3000 sato we may have another leg up.
Further importants resistances around 3300-3800.

ICX / BTC looks bullish, can fly to 3333 satHi! I see bullish divergence on 3D and final of the accumulation cycle. Can fly to targets: 2700, 3333, 3900 sat.
By levels: 1500-1750
Stop: 1399
Good luck!

ICX / BTC 1 HOURIcon, Another assending triangle, volume dropping, looks building a next breakout to the upside. We wille see Keep an eye on it

$ICX, Crossing over ~2280 sats resistance level$ICX
Crossing over ~2280 sats resistance level with increasing volume and UCTS Buy signals on the 1-4D timeframes..
12H showing a golden cross on EMA50/200
Looking for a retest of crossed level & Flip as entry, Looking for ~2800+ sats as target (20%+)
#ICX

ICON Continues... Goes Parabolic | Support & Resistance MappedICON (ICXBTC) continues to grow now going parabolic... We shared a chart less than 3 weeks ago and we are now at 65%+ of gains but there is still lots of potential left for additional growth, you can see it here:
Now, after we buy low, all that is left is to be patient and sell while the prices move up.
EMA200 was conquered with yesterday's candle close, if ICXBTC can remain above this level, the next target is sitting at 0.00003158 followed by EMA300 at 0.00003831+.
If EMA200 (0.00002477) breaks down (prices for ICXBTC move and close below this level), then we can see lower prices around EMA10 or 0.00002136.
These are the most important support and resistance levels on the daily timeframe.
Thanks a lot for reading.
Namaste.

ICX-BTCI never stopped following her and now I'm willing to stay with her for 45 days from today, good trip BABY.

ICXBTC Achived our Targets 53% ProfitICX/BTC now Wonderfull Journey.
Now 53% up from our Entry.
Our entry was 1600 Satoshi and Now 2450 Satoshi hit.
congrats Guys.

ICX/BTC Korea getting more into blockchainThis looks good, especially when Korea starts to get more into blockchain twitter.com
Above 1D 99MA and I'm in.

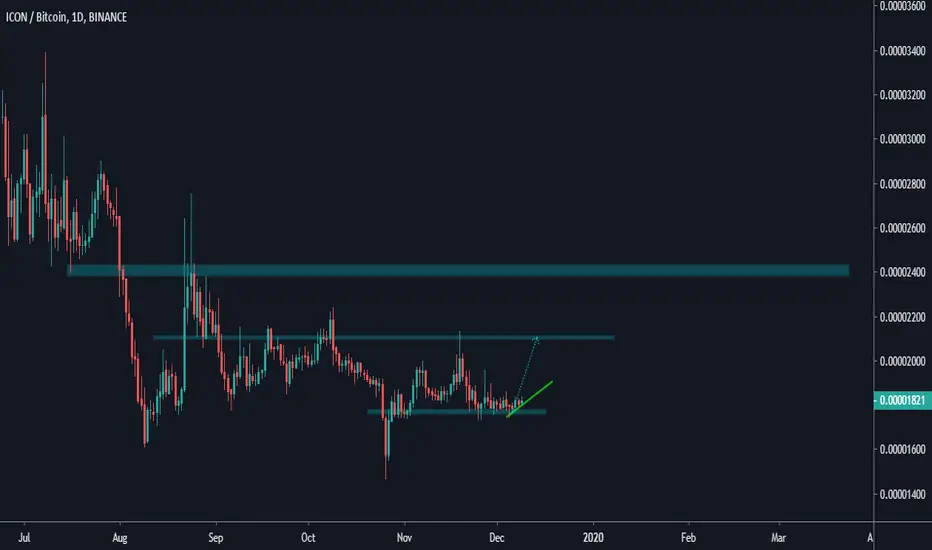
ICX.btc dig out of hole? Bounced EXACTLY as plotted now what ?See my Previous Analysis that caught the bottom EXACTLY (click) .
Icon bounced where expected in the plot above.
Now we have a crucial Support that needs to hold.
And we have nearby Resistance that needs to break.
1898-1906 sats is the Crucial support that most not break.
2020-2025 sats is the immediate Resistance just above us.
1950-1952 sats would be the ideal Bullish bounce to see.
If we get move past resistance, I will plot targets at that time.
Too early to assume "bottom" is in, since many alts just keep diving.
Confirmation of bottom would break of 2k sats and retest with bounce.

ICX doing great Job now 28% profit#ICXBTC update:
#ICX after breakout retest also done.
now around 2000 satoshi.
and went upto 2050 satoshi.
and now 28% profit from our Entry
our entry was around 1600 Satoshi
still more rooms for upper side
Like and follow guys

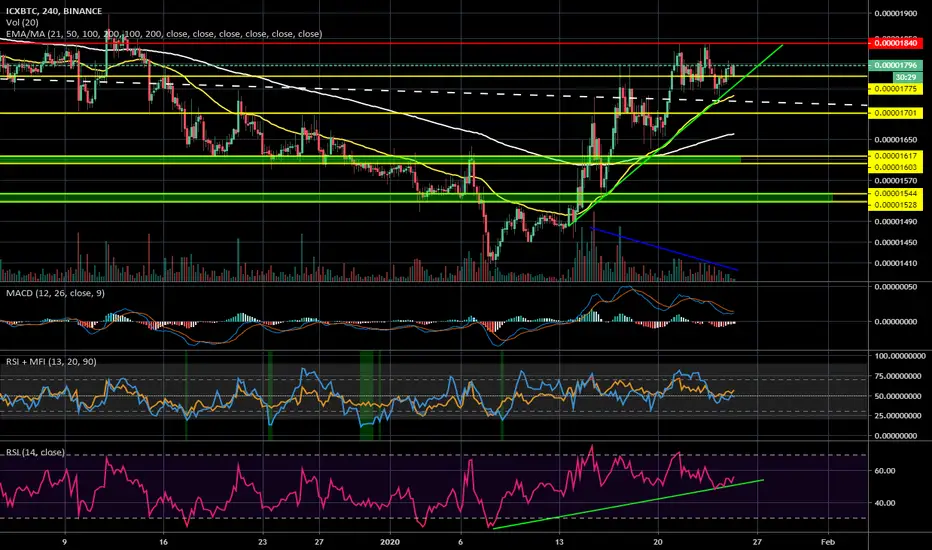
$ICX, UCTS displaying a 2D Buy signal after 8 months..$ICX
UCTS displaying a 2D Buy signal after 8 months..
Zooming in:
Testing ~1750 sats resistance level (Matching EMA50) w/ increasing volume..
Starting to cross Ichi cloud on the 1D
Looking for a potential flip at this level as continuation to ~2300 sats (20%+)
Stay ready
#ICX

ICX / BTC 4 HOURiCON:
* Building a nice assending trinagle
* Volume is dropping down
* Nice building up trendline
* Good RSi trendline
Let's see what happen....
ICX will be one of the biggest gainers in 2020 #AltseasonICX is looking set for some big retrace movements in the coming #Altseason.
Please DYOR.

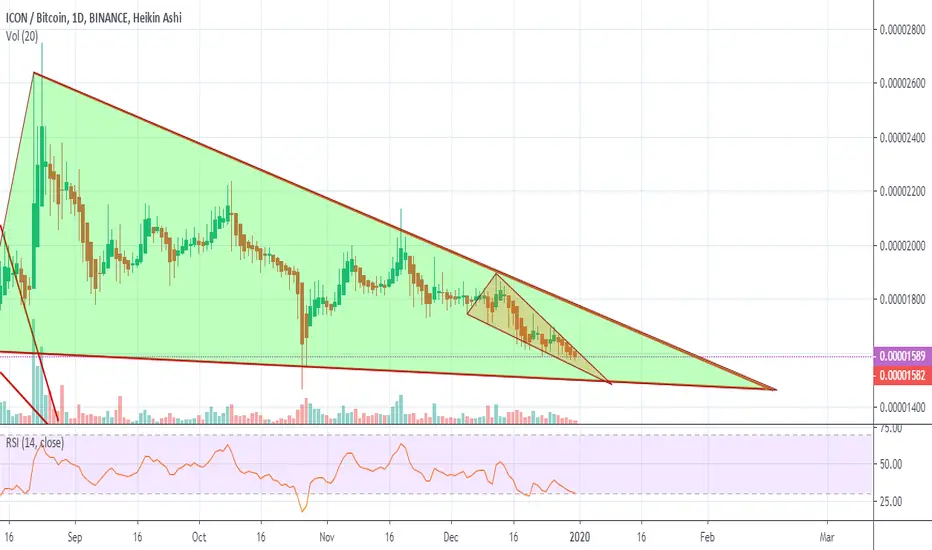
ICX/BTC, Bull div, bullish shark pattern, 200%+It was some strong bull div on daily plus a harmonic playing out and now forming another harmonic. I am watching for breakout of the pennant, could breakout breakout prematurely
THIS IS NOT FINANCIAL ADVICE, THESE ARE JUST MY OWN OPINIONS & IDEAS.

ICXBTC Bullish Brokeout Confirmed#ICXBTC Chart:
#ICX Long Term Resistance Brokeout.
Target will be 2514/3242/ 4200 Satoshi.
Support: 1500 SAtoshi.
like share and follow me
Thank you

ICX / BTX 4 HOURICX is wakening up from it's lows!
* big volume is coming in last days realy good sign becahse of that i think ICX bottom is in.
* MACD MA's healty up
* Breaks out of the falling wedge
* The markt is on fire mates, good times ahead
Let's see what happen next....

ICX ICON ICX Long Time Dead
Risky Trde:Buy In Dip 1530 to 1580 Sat
Stop Loss 1500 Sat
Safe Trade : Wait For Traingle Breakout With Volume
$ICX : Dead Cat Bounce before new low ?Watching the falling wedge and the descending bottom trendline
ICX could make a bounce in this area
Not a Financial Advice

ICX good positionICX / BTC
Exchange : #BINANCE
Buy : 1628
Targets :
Tp 1 : 1755 (8%)
Tp 2 : 1885 (16%)
Tp 3 : 2030 (25%)
Stop loss zone : 1520 ~ 1500

ICX-BTC Trade SetupICX seems to be breaking out of the triangle pattern on daily chart.
Stoch RSI and MACD are turning Bullish and moving up
SBS indicator signaled BUY on daily chart.
SL and Targets are on the chart.
Target 1 is more of a scalping target. There is small resistance near Target 1 (EMA 89).
Breakout with volume will reach target 2 and 3


ICX reversal must buy on bottom...icx start reversal
this is on support zone must buy for 10-15% mid term..