The Trading Rookie, How I Don't Make Money Fast & Waste TimeThe bottom is set and once the bottom is in bullish momentum builds up and grows. Bullish momentum is now present on this chart coupled with really high volume. The high volume is what confirms the current move being real and strong. ICXUSDT daily.
When they are not moving nothing can move them. Bu

ICX/USDTKey Level Zone: 0.1265 - 0.1285
HMT v8.1 detected. The setup looks promising, supported by a previous upward/downward trend with increasing volume and momentum, presenting an excellent reward-to-risk opportunity.
HMT (High Momentum Trending):
HMT is based on trend, momentum, volume, and market str

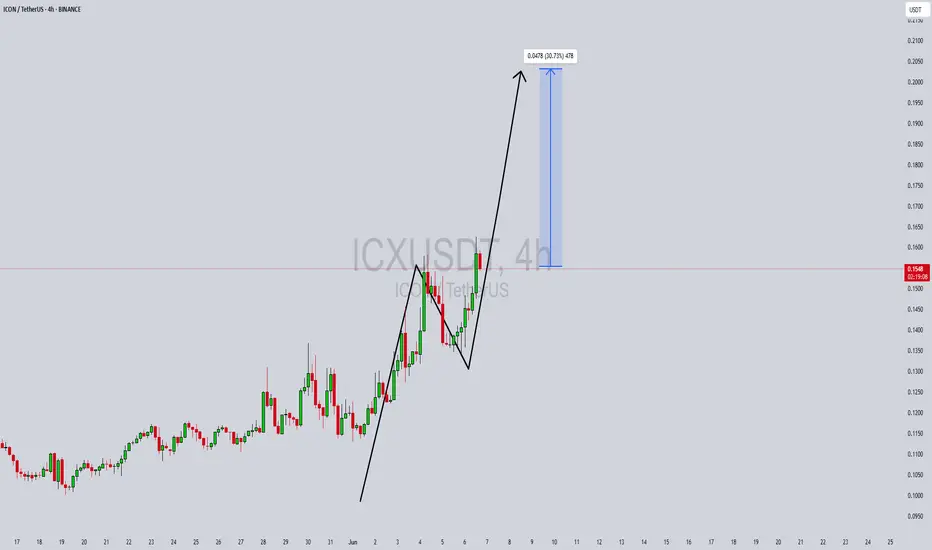
ICXUSDT Forming Bullish impulseICXUSDT has recently shown a strong bullish impulse, followed by a healthy pullback forming a classic bull flag or V-shaped recovery pattern. This setup often signals continuation of the uptrend, especially when supported by solid trading volume, as seen in the recent sessions. The consolidation and
ICX on the massive discounthi traders,
The price broke the support and made a new low.
The same happened for ZECUSDT in July 2024. Soon after ZEC reclaimed the support, the price rose almost 400 %.
I expect something similar for ICXUSDT.
If the price recovers the support, it should go higher so we should retest at least the

Check if it can rise above 0.1135
Hello, traders.
If you "Follow", you can always get new information quickly.
Please also click "Boost".
Have a nice day today.
-------------------------------------
(ICXUSDT 1D chart)
In order for a medium- to long-term uptrend to begin, the price must be maintained above the M-Signal indicat

ICXUSDT 1DICX ~ 1D Analysis
#ICX Buy after successfully penetrating this resistant line with a short -term target of at least 15%+ from here.

ICXUSDT - falling wedgehi traders,
Let's have a look at ICXUSDT on 3D time frame.
Yesterday we published this analysis on the monthly time frame:
Having a closer look on the 3D chart, makes me even more confident that ICX will see higher prices within the next few weeks/months.
The falling wedge is a bullish pattern

ICXUSDT - the bottom is in or very closehi traders,
Unfortunately, the market was brutal for us last night and all altcoins crashed hard.
The good news is that the bottom is already in or it's very close.
Don't be surprised if ICX makes new all-time low before starting the uptrend.
The falling wedge pattern should result in a bullish br

SPOT ICX LONG 13.02.2025Pinning after exhaustion of sales.
💰I enter at the market price.
🔏The trade be closed manually or with a limit order by:
0.1973
I'll let you know when I record it manually.
‼️Risk per trade: 1% of the allocated funds for spot trading.
Thank you!

ICXUSDT is a buy nowhi traders
ICXUSDT hasn't performed well recently, but it may be time to be bullish on ICX again.
Bullish divergences formed and the price is in the low-risk area.
Easy to strategize the trade here.
Risk/Reward ratio: 8,08
entry, target and stop loss are shown on the chart.
Good luck

See all ideas
Summarizing what the indicators are suggesting.
Oscillators
Neutral
SellBuy
Strong sellStrong buy
Strong sellSellNeutralBuyStrong buy
Oscillators
Neutral
SellBuy
Strong sellStrong buy
Strong sellSellNeutralBuyStrong buy
Summary
Neutral
SellBuy
Strong sellStrong buy
Strong sellSellNeutralBuyStrong buy
Summary
Neutral
SellBuy
Strong sellStrong buy
Strong sellSellNeutralBuyStrong buy
Summary
Neutral
SellBuy
Strong sellStrong buy
Strong sellSellNeutralBuyStrong buy
Moving Averages
Neutral
SellBuy
Strong sellStrong buy
Strong sellSellNeutralBuyStrong buy
Moving Averages
Neutral
SellBuy
Strong sellStrong buy
Strong sellSellNeutralBuyStrong buy
Displays a symbol's price movements over previous years to identify recurring trends.
Curated watchlists where ICXUSDT is featured.

Interoperability Crypto: Communication station
14 No. of Symbols

Smart contracts: Make the smart decision
36 No. of Symbols
See all sparks
Related pairs
Frequently Asked Questions
The current price of ICON / Tether US (ICX) is 0.1575 USDT — it has risen 7.88% in the past 24 hours. Try placing this info into the context by checking out what coins are also gaining and losing at the moment and seeing ICX price chart.
ICON / Tether US price has risen by 26.10% over the last week, its month performance shows a 58.61% increase, and as for the last year, ICON / Tether US has decreased by −27.02%. See more dynamics on ICX price chart.
Keep track of coins' changes with our Crypto Coins Heatmap.
Keep track of coins' changes with our Crypto Coins Heatmap.
ICON / Tether US (ICX) reached its highest price on Nov 15, 2021 — it amounted to 2.7130 USDT. Find more insights on the ICX price chart.
See the list of crypto gainers and choose what best fits your strategy.
See the list of crypto gainers and choose what best fits your strategy.
ICON / Tether US (ICX) reached the lowest price of 0.0694 USDT on Apr 7, 2025. View more ICON / Tether US dynamics on the price chart.
See the list of crypto losers to find unexpected opportunities.
See the list of crypto losers to find unexpected opportunities.
The safest choice when buying ICX is to go to a well-known crypto exchange. Some of the popular names are Binance, Coinbase, Kraken. But you'll have to find a reliable broker and create an account first. You can trade ICX right from TradingView charts — just choose a broker and connect to your account.
Crypto markets are famous for their volatility, so one should study all the available stats before adding crypto assets to their portfolio. Very often it's technical analysis that comes in handy. We prepared technical ratings for ICON / Tether US (ICX): today its technical analysis shows the strong buy signal, and according to the 1 week rating ICX shows the buy signal. And you'd better dig deeper and study 1 month rating too — it's neutral. Find inspiration in ICON / Tether US trading ideas and keep track of what's moving crypto markets with our crypto news feed.
ICON / Tether US (ICX) is just as reliable as any other crypto asset — this corner of the world market is highly volatile. Today, for instance, ICON / Tether US is estimated as 10.91% volatile. The only thing it means is that you must prepare and examine all available information before making a decision. And if you're not sure about ICON / Tether US, you can find more inspiration in our curated watchlists.
You can discuss ICON / Tether US (ICX) with other users in our public chats, Minds or in the comments to Ideas.