The Trading Rookie, How I Don't Make Money Fast & Waste TimeThe bottom is set and once the bottom is in bullish momentum builds up and grows. Bullish momentum is now present on this chart coupled with really high volume. The high volume is what confirms the current move being real and strong. ICXUSDT daily.
When they are not moving nothing can move them. But when they move they move.
We have the bottom and this is good so we only need a continuation and the continuation will come. Notice that this is the same chart as other altcoins, most altcoins.
This is very simple. I just wait.
If you jump in without a plan and prices retrace tomorrow, you will desperate and fold, sell at a loss. Then just three days later ICXUSDT continues to grow. You see how that works? Three days is not a long time.
It happens that the wait can take weeks but some people are ready to earn today, today alone and today only. Here is how that mentality works.
Let's say the unexperienced trader (me) do manage to buy before prices start to grow. "Awesome, finally I got one." Chasing after the next breakout everyday. The pair goes up 10%, 20%, 30%. Then stops and retraces for a few days. The rookie manages to hold and then boom, a nice 50% jump. Total growth some 70% from entry point considering the small retrace.
At this point, the rookie finds out everything about the pair he holds and prepares to "hold long-term." The pairs keep on growing and profits now reach 100%. Instead of securing a trade, a very nice double-up, 100% profits, the rookie becomes greedy and continues to hold.
The action peaks at 120% profits. From the bottom total growth reached 320% but he didn't get the bottom of course he bought when the action was already underway. Next comes the correction and selling is still not even a possibility because remember, I will hold long-term.
Long story short, when the correction hits bottom, the rookie is ready to give up. He sells everything beat down and depressed. "Crap, I missed another bullish wave." The next day, as soon as he sells the bottom prices start to grow... And the cycle repeats.
This time, instead of buying crazy or being crazy, just trust my call.
Buy those trading at the bottom. Those that everybody ignores. I share these in my profile. Wait patiently and then the market will grow. You cannot earn 500% on a pair if it is already moving, it is impossible. The only way to earn big is by buying when prices are low. Hold strong, hold long and as the bullish cycle develops, your money grows.
Short-term trading is also do-able but requires more experience and planning. When the pair is up 20-30%, you can collect profits. This can also be done at 80-100%, it depends. It depends on your trading style, your capital, your goals... It all depends on you. How are you going to profit from this 2025 bull market bull-run?
Namaste.
ICXUSDT trade ideas

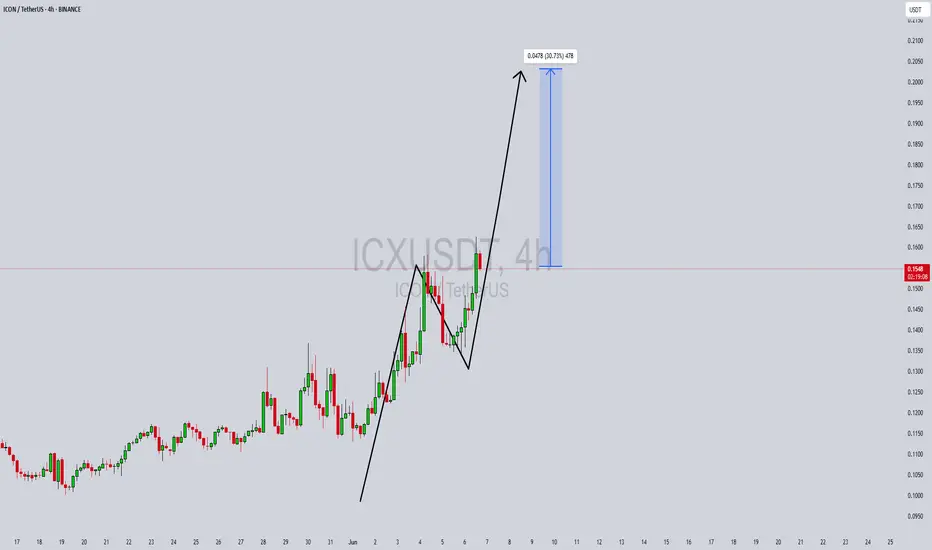
ICXUSDT Forming Bullish impulseICXUSDT has recently shown a strong bullish impulse, followed by a healthy pullback forming a classic bull flag or V-shaped recovery pattern. This setup often signals continuation of the uptrend, especially when supported by solid trading volume, as seen in the recent sessions. The consolidation and subsequent breakout reflect growing investor confidence, making ICX an attractive short-term trading opportunity with an expected gain of 20% to 30%+.
ICON (ICX) is one of the older blockchain projects that has managed to maintain its relevance through consistent updates and ecosystem expansion. As the altcoin market shows signs of revival, mid-cap coins like ICX are starting to attract attention from both retail and institutional traders. The recent price action confirms that ICX is gaining traction, with the breakout targeting a significant resistance zone in the $0.19-$0.21 range.
Traders looking for momentum plays should watch ICXUSDT closely. If the price sustains above the $0.1550 breakout level with increasing volume, it could mark the beginning of a new leg upward. Additionally, the current structure on the 4H chart is providing clean technical entries with tight risk, making this trade setup highly favorable for swing and day traders.
This move is backed by both technical pattern recognition and on-chain interest metrics, which hint at potential accumulation. With sentiment improving and key resistance levels within reach, ICX could deliver a rapid upside move in the coming days.
✅ Show your support by hitting the like button and
✅ Leaving a comment below! (What is You opinion about this Coin)
Your feedback and engagement keep me inspired to share more insightful market analysis with you!
ICX/USDTKey Level Zone: 0.1265 - 0.1285
HMT v8.1 detected. The setup looks promising, supported by a previous upward/downward trend with increasing volume and momentum, presenting an excellent reward-to-risk opportunity.
HMT (High Momentum Trending):
HMT is based on trend, momentum, volume, and market structure across multiple timeframes. It highlights setups with strong potential for upward movement and higher rewards.
Whenever I spot a signal for my own trading, I’ll share it. Please note that conducting a comprehensive analysis on a single timeframe chart can be quite challenging and sometimes confusing. I appreciate your understanding of the effort involved.
Important Note :
Role of Key Levels:
- These zones are critical for analyzing price trends. If the key level zone holds, the price may continue trending in the expected direction. However, momentum may increase or decrease based on subsequent patterns.
- Breakouts: If the key level zone breaks, it signals a stop-out. For reversal traders, this presents an opportunity to consider switching direction, as the price often retests these zones, which may act as strong support-turned-resistance (or vice versa).
My Trading Rules
Risk Management
- Maximum risk per trade: 2.5%.
- Leverage: 5x.
Exit Strategy
Profit-Taking:
- Sell at least 70% on the 3rd wave up (LTF Wave 5).
- Typically, sell 50% during a high-volume spike.
- Adjust stop-loss to breakeven once the trade achieves a 1.5:1 reward-to-risk ratio.
- If the market shows signs of losing momentum or divergence, ill will exit at breakeven.
The market is highly dynamic and constantly changing. HMT signals and target profit (TP) levels are based on the current price and movement, but market conditions can shift instantly, so it is crucial to remain adaptable and follow the market's movement.
If you find this signal/analysis meaningful, kindly like and share it.
Thank you for your support~
Sharing this with love!
HMT v2.0:
- Major update to the Momentum indicator
- Reduced false signals from inaccurate momentum detection
- New screener with improved accuracy and fewer signals
HMT v3.0:
- Added liquidity factor to enhance trend continuation
- Improved potential for momentum-based plays
- Increased winning probability by reducing entries during peaks
HMT v3.1:
- Enhanced entry confirmation for improved reward-to-risk ratios
HMT v4.0:
- Incorporated buying and selling pressure in lower timeframes to enhance the probability of trending moves while optimizing entry timing and scaling
HMT v4.1:
- Enhanced take-profit (TP) target by incorporating market structure analysis
HMT v5 :
Date: 23/01/2025
- Refined wave analysis for trending conditions
- Incorporated lower timeframe (LTF) momentum to strengthen trend reliability
- Re-aligned and re-balanced entry conditions for improved accuracy
HMT v6 :
Date : 15/02/2025
- Integrated strong accumulation activity into in-depth wave analysis
HMT v7 :
Date : 20/03/2025
- Refined wave analysis along with accumulation and market sentiment
HMT v8 :
Date : 16/04/2025
- Fully restructured strategy logic
HMT v8.1 :
Date : 18/04/2025
- Refined Take Profit (TP) logic to be more conservative for improved win consistency

ICX/USDT – Bullish Breakout Confirmed, Eyeing Higher Targets
Date: June 9, 2025
ICX/USDT has officially broken out of a key consolidation range and is now entering a new bullish phase. With momentum rising and volume supporting the move, the path of least resistance remains to the upside.
📊 Technical Overview:
Current Price: $0.1672
Key Support Zone: $0.1393
Resistance Levels:
Short-term: $0.3000
Mid-term: $0.4000
📈 Indicators:
RSI: At 76.50 – entering overbought territory, but confirms strong bullish momentum.
EMA Alignment: Price is well above all major EMAs (4, 50, 100, 200), confirming trend reversal and bullish structure.
📉 Volume:
A spike in volume confirms genuine interest behind the breakout. This is not a low-liquidity move, but a meaningful shift in market structure.
🔍 Chart Structure:
ICX broke through horizontal resistance with strong price action.
RSI has broken above the 70 mark, confirming bullish momentum.
Previous accumulation zone ($0.13–$0.14) now acts as strong support.
🎯 Upside Targets:
First Major Target: $0.3000 – previous significant resistance
Second Major Target: $0.4000 – historical supply zone from December highs
📉 Invalidation Zone:
A breakdown below $0.1393 would invalidate the current bullish setup and suggest a re-entry into consolidation.
Good Trading!!

ICX on the massive discounthi traders,
The price broke the support and made a new low.
The same happened for ZECUSDT in July 2024. Soon after ZEC reclaimed the support, the price rose almost 400 %.
I expect something similar for ICXUSDT.
If the price recovers the support, it should go higher so we should retest at least the last swing high.
I'm very optimistic as I expect a solid bounce in the market soon.

Check if it can rise above 0.1135
Hello, traders.
If you "Follow", you can always get new information quickly.
Please also click "Boost".
Have a nice day today.
-------------------------------------
(ICXUSDT 1D chart)
In order for a medium- to long-term uptrend to begin, the price must be maintained above the M-Signal indicator on the 1M chart.
Therefore, if you want to trade ICX, you should take your time and look at the situation.
-
If it rises to around 0.1135 and maintains the price, there is a possibility that a short-term uptrend will begin.
Therefore, in order to start an aggressive trade, you should check the support around 0.1135.
-
The HA-Low indicator of the 1D chart is formed at 0.0832,
the HA-Low indicator of the 1W chart is formed at 0.1602,
and the HA-Low indicator of the 1M chart is formed at 0.1976.
Ultimately, it is highly likely that the upward trend will start if the price rises above 0.1976 and maintains.
It is difficult to conduct day trading or short-term trading.
-
Thank you for reading to the end.
I hope you have a successful transaction.
--------------------------------------------------
- This is an explanation of the big picture.
I used TradingView's INDEX chart to check the entire range of BTC.
I rewrote the previous chart to update it by touching the Fibonacci ratio range of 1.902(101875.70) ~ 2(106275.10).
(Previous BTCUSD 12M chart)
Looking at the big picture, it seems to have been following a pattern since 2015.
In other words, it is a pattern that maintains a 3-year bull market and faces a 1-year bear market.
Accordingly, the bull market is expected to continue until 2025.
-
(Current BTCUSD 12M chart)
Based on the currently written Fibonacci ratio, it is displayed up to 3.618 (178910.15).
It is expected that it will not fall again below the Fibonacci ratio of 0.618 (44234.54).
(BTCUSDT 12M chart)
I think it is around 42283.58 when looking at the BTCUSDT chart.
-
I will explain it again with the BTCUSD chart.
The Fibonacci ratio ranges marked in the light green boxes, 1.902 (101875.70) ~ 2 (106275.10) and 3 (151166.97) ~ 3.14 (157451.83), are expected to be important support and resistance ranges.
In other words, it seems likely to act as a volume profile range.
Therefore, in order to break through this section upward, I think the point to watch is whether it can rise with support near the Fibonacci ratios of 1.618 (89126.41) and 2.618 (134018.28).
Therefore, the maximum rising section in 2025 is expected to be the 3 (151166.97) ~ 3.14 (157451.83) section.
To do that, we need to look at whether it can rise with support near 2.618 (134018.28).
If it falls after the bull market in 2025, we don't know how far it will fall, but considering the previous decline, we expect it to fall by about -60% to -70%.
So, if the decline starts near the Fibonacci ratio 3.14 (157451.83), it seems likely that it will fall to around Fibonacci 0.618 (44234.54).
I will explain more details when the downtrend starts.
------------------------------------------------------

ICXUSDT 1DICX ~ 1D Analysis
#ICX Buy after successfully penetrating this resistant line with a short -term target of at least 15%+ from here.

ICXUSDT - falling wedgehi traders,
Let's have a look at ICXUSDT on 3D time frame.
Yesterday we published this analysis on the monthly time frame:
Having a closer look on the 3D chart, makes me even more confident that ICX will see higher prices within the next few weeks/months.
The falling wedge is a bullish pattern and I expect it to breakout to the upside.
target 1: 0,2150
target 2: 0,28- 0,30
Enter a long position once we get a successful breakout.
Good luck

ICXUSDT - the bottom is in or very closehi traders,
Unfortunately, the market was brutal for us last night and all altcoins crashed hard.
The good news is that the bottom is already in or it's very close.
Don't be surprised if ICX makes new all-time low before starting the uptrend.
The falling wedge pattern should result in a bullish breakout sooner or later but to be honest, it looks like it may be later than everyone expected.
Expecting the breakout in Q3 or Q4 this year.
3 targets are shown on the chart.
The time to buy ICX is now.

SPOT ICX LONG 13.02.2025Pinning after exhaustion of sales.
💰I enter at the market price.
🔏The trade be closed manually or with a limit order by:
0.1973
I'll let you know when I record it manually.
‼️Risk per trade: 1% of the allocated funds for spot trading.
Thank you!

ICXUSDT is a buy nowhi traders
ICXUSDT hasn't performed well recently, but it may be time to be bullish on ICX again.
Bullish divergences formed and the price is in the low-risk area.
Easy to strategize the trade here.
Risk/Reward ratio: 8,08
entry, target and stop loss are shown on the chart.
Good luck

SPOT ICX LONG 21.01.2025Pinning after containment of sales.
🎯Purpose:
0.2077
I'll let you know when I record it manually.
‼️Risk per trade: 1% of the allocated funds for spot trading.

ICXUSDT 1WICX Update ~ 1W
#ICX So far it still maintains its bullish structure. Buy gradually within this support block,. with a minimum target of 20%+

ICX 4H Chart
▶️ I am biased towards further downside price action.
▶️ Drop from early December has an impulsive look.
▶️ Upside movement is forming a corrective bear flag.
▶️ There is no RSI divergence in the recent low.
▶️ Therefore, the higher probability is for a new leg down retesting 0.1462 low.

ICXUDSTICX most likely going to 3.79usd in a few weeks or before, maybe going to revisit 0.618 fibonacci at 2.27 first?
This is not any trading advise you can loose your money I post it for the fun of it.

#ICX (SPOT) entry( 0.1450- 0.1850) T.(0.9000) SL(0.1384)BINANCE:ICXUSDT
#ICX / USDT
Entry ( 0.1450- 0.1850)
SL 1D close below 0.1384
T1 0.2900
T2 0.5300
T3 0.9000
1 Extra Targets(optional) in chart, if you like to continue in the trade with making stoploss very high.
______________________________________________________________
Golden Advices.
********************
* collect the coin slowly in the entry range.
* Please calculate your losses before the entry.
* Do not enter any trade you find it not suitable for you.
* No FOMO - No Rush , it is a long journey.
Useful Tags.
****************
My total posts
www.tradingview.com
1Million Journey
www.tradingview.com
www.tradingview.com
**********************************************************************************************
#Manta #OMNI #DYM #AI #IO #XAI #ACE #NFP #RAD #WLD #ORDI #BLUR #SUI #VOXEL #AEVO #VITE #APE #RDNT #FLUX #NMR #VANRY #TRB #HBAR #DGB #XEC #ERN #ALT #IO #ACA #HIVE #ASTR #ARDR #PIXEL #LTO #AERGO #SCRT #ATA #HOOK #FLOW #KSM #HFT #MINA #DATA #SC #JOE #RDNT #IQ #CFX #BICO #CTSI #KMD #FXS #DEGO #FORTH #AST #PORTAL #CYBER #RIF #ENJ #ZIL #APT #GALA #STEEM #ONE #LINK #NTRN #COTI #RENDER #ICX #IMX #ALICE #PYR #PORTAL #GRT #GMT #IDEX #NEAR #ICP #ETH #QTUM #VET #QNT #API3 #BURGER #MOVR #SKL #BAND #ETHFI #SAND #IOTX #T #GTC #PDA #GMX #REZ #DUSK #BNX #SPELL #POWR #JOE #TIA #TFUEL

#ICX (SPOT) entry range( 0.1150- 0.1400) T.(0.2960) SL(0.1112)BINANCE:ICXUSDT
entry range ( 0.1150- 0.1400)
Target1 (0.1770) - Target2 (0.2114) - Target3 (0.2960)
1 Extra Targets(optional) in chart, if you like to continue in the trade with making stoploss very high.
SL .1D close below (0.1112)
*** collect the coin slowly in the entry range ***
*** No FOMO - No Rush , it is a long journey ***
**** #Manta ,#OMNI, #DYM, #AI, #IO, #XAI , #ACE #NFP #RAD #WLD #ORDI #BLUR #SUI #Voxel #AEVO #VITE #APE #RDNT #FLUX #NMR #VANRY #TRB #HBAR #DGB #XEC #ERN #ALT #IO #ACA #HIVE #ASTR #ARDR #PIXEL #LTO #AERGO #SCRT #ATA #HOOK #FLOW #KSM #HFT #MINA #DATA #SC #JOE #RDNT #IQ #CFX #BICO #CTSI #KMD #FXS #DEGO #FORTH # AST #PORTAL #CYBER #RIF #ENJ #ZIL #APT #GALA #STEEM #ONE #LINK #NTRN #COTI #RENDER #ICX ****

ICX/USDT: Cup with Handle Pattern FormingICX/USDT: Cup with Handle Pattern Forming
📊 Trade Setup:
Entry: $0.1829
Stop Loss: $0.1762
Target: $0.2083
Risk/Reward Ratio: 4.15
This trade idea is based on a Cup with Handle pattern forming on the chart, a strong bullish signal if confirmed. With a clear setup and a favorable risk/reward ratio, this presents an interesting opportunity.
⚠️ Note: Always manage your risk

ICXUSDT SHORTBINANCE:ICXUSDT
Hello I hope you are well this analysis is based on RTM style
you can see more details in the chart

ICXUSDT:Critical Moment Approaching–Will Bulls Hold the Demand?Yello Paradisers! Have you spotted the massive shift in ICXUSDT? After breaking through a long-term downtrend resistance that had held since April, ICX surged explosively, but the momentum now faces its first real test. Is this the perfect re-accumulation opportunity, or are we gearing up for further downside? Let’s dive into the key areas you need to watch.
💎The descending trendline, acting as a strong resistance for over 8 months, has been decisively breached. Notice the sharp breakout in late November, accompanied by a significant volume spike – a clear sign of bullish interest.
💎 Price is now retracing into the demand zone at $0.2000. Price already respected this demand previously, so if bulls step in here with conviction, expect a strong bounce and continuation of the uptrend.
💎If the demand zone fails to hold, the next area of interest is the broader support zone around $0.1662–$0.1741. A deeper retracement here would still maintain the bullish structure, but failure to hold could trigger a bearish move.
💎Pay close attention to the volume during this pullback. A decline in volume while price drops would signal a healthy correction. Conversely, an increase in bearish volume could indicate growing selling pressure.
💎This is the make-or-break zone for ICXUSDT. Bulls need to hold the demand zone for any chance of continuation. A rejection here could fuel another bullish impulse, rewarding patient traders. On the other hand, failure to hold this level could trigger a deeper retracement, shaking out weak hands.
Stay focused, play it smart, and keep following strategy – because only the strategic traders will capitalize on moves like this. Be a PRO!
MyCryptoParadise
iFeel the success🌴

#ICON/USDT Ready to go higher#ICON
The price is moving in a descending channel on the 1-hour frame and sticking to it well
We have a bounce from the lower limit of the descending channel, this support is at 0.2161
We have a downtrend on the RSI indicator that is about to be broken, which supports the rise
We have a trend to stabilize above the moving average 100
Entry price 0.2208
First target 0.2326
Second target 0.2446
Third target 0.2583

ICXUSDT 1W#ICX has broken the weekly trendline and successfully retested it. The weekly MA100 is also providing strong support.
Targets are:
🎯 $0.3613
🎯 $0.4868
🎯 $0.7152
🎯 $1.0831
🎯 $1.3805
🎯 $1.6778

ICXUSDTKey Level Zone : 0.2494-0.2522
HMT v1.0 detected. The setup looks promising, supported by a previous upward/downward trend with increasing volume and momentum, presenting an excellent reward-to-risk opportunity.
HMT (High Momentum Trending):
HMT is based on trend, momentum, volume, and market structure across multiple timeframes. It highlights setups with strong potential for upward movement and higher rewards.
Whenever I spot a signal for my own trading, I’ll share it. Please note that conducting a comprehensive analysis on a single timeframe chart can be quite challenging and sometimes confusing. I appreciate your understanding of the effort involved.
If you find this signal/analysis meaningful, kindly like and share it.
Thank you for your support~
Sharing this with love!
