ICON TO THE MOON?Heey peeps,
Here's my TA, Give me feedback if you want and rate me 5 starts so i can chat, i reallyyy should appriciate that!
ICXUSDT trade ideas

ICXUSDTPERP - Long - Potential 18.62%ICXUSDTPERP - Long - Potential 18.62%
Entry- 4592
TP1- 4864
TP2- 5447
SL- 4309
- Optional Leverage 3-5X
- BTC Break Volatility Likely - Manage Trades
- RR - 2.95
- Trailing Buy - 0.5%
- Trailing Profit - 1%
- Trailing Stop-Loss - No

$ICXUSDT a bit of pull back then heading for 0.54c $ICX $BTC$ICXUSDT a bit of pull back then heading for 0.54c $ICX $BTC
ICXUSDT breaking out of consolidation? Price has been trading within a range that seems to be contracting these past few weeks/months but there are indications we may be seeing a potential change in theme.
Watching out this potential breakout in progress. I'd say wait for a weekly close but a daily close would be a bullish signal too.


ICX / USDT weekly indicates massive price action. Icon 2021, it will potential a big year for Icon! Heavy accumulation last 2 years on low volume indicates something will happen soon or late with massive momentum! ALso in the center of the channel around the median you can clearly see it's a imported price action zone! Also ICX was on 12 dollar around BTC price 19K I still think BTC will hit 200.000 / 250.000 this cycle so......
I know it looks unrealistic but we have seen crazy things in crypto! Keep that in Mind!

Projection for ICX - Alt Season (?)ICX has been doing good groundwork the past months and is on course for key releases in 2021. Good HODL

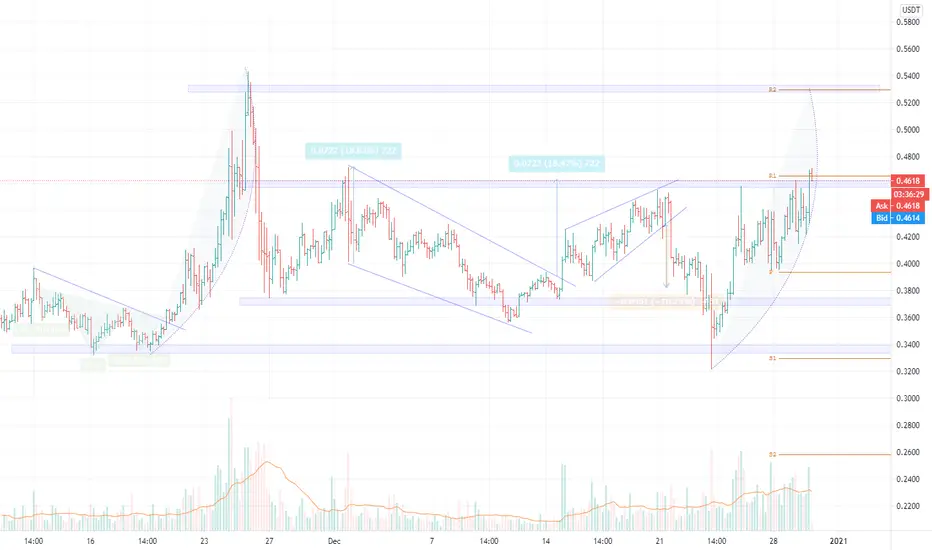
ICX about to do something.expect a Parabolic Move, Above ($0.46).
($0.46) a Resistance level Since April 2019.
$ICX/BTC Pair has bounced from one-Year lows.

ICXUSDTBuy above 0.40-0.45
If breaks downtrend resistance (since December 1st)
TP1: 0.50
TP2: 0.55
TP3: 0.60
tp4: 0.65-0.75
Not an investment advice.

That's how your perfect entry looks likeWhat I love about trading trend lines is the fact you have the maximum Profit/Risk ratio. I don't know if the price will go up from this point or down but at least I know where to exit my position: either with profit or with loss. I wouldn't be surpised to see the price going down considering the fact Bitcoin is still due to a major correction but it is a risk worth taking. When if not now? ICON isn't the only one you can trade now in this manner - check out also ONT, ZEC, XTZ.

ICON - Next Moon Soon!Hi,
Everything is on the chart. ICON is one of my favorite asset because of its fantastic potential and I would like to share my little point of view about it.
Wave 2 should be over (in orange color). We draw a huge beautiful ascending triangle and we compress more and more.
The shareholders' capital still keep on to strengthen.
We should easily hit the TARGET 1 and 2 during the next months (maybe weeks).
It's a long for me!
Trade safe and not with your emotions...!
Cheers,
PS: it's not a Financial Advice.

ICX SELL!!!! WHO EVER IS BUYING RIGHT NOW LET THEM SCREAM HODL!!... Breaking down market with selling pressure increasing..

ICX Breakout Setup | Head and ShouldersHead and shoulders breakout may happen any Buy the retest of the breakout at 0.44 - 0.445 USDT


ICX/USDTPERP - LONG - Potential 14.37%***NEW TRADE SET UP"**
ICX/USDTPERP - LONG - Potential 14.37%
Optional Leverage: 3x
Entry- 4363
TP1(75%) - 4661
TP2- (25%) - 4990
SL - 4003
- BTC regained strength from initial drop, 25k is target but also danger zone
- RR - 1.74
- Trailing Buy - 0.5%
- Trailing Profit - 1%
- Trailing Stop-Loss - No

ICX USDT FIB SHORT1. Target 0,45
2. Target 0,48
3. Target 0,52
Entry points:
1. Target 0.415
1. Target 0.405

ICX Growing Soon!ICON is a decentralized blockchain network focused on interoperability. With ICON’s “blockchain transmission protocol”, independent blockchains like Bitcoin and Ethereum can connect and transact with each other. This opens up cross-chain use cases that are impossible without an interoperability layer like ICON.


ICXUSDT formed bullish Gartley | Upto 44.2% expectedOn daily chart, the price action of ICON (ICX) has completed the final leg of Gartley pattern and entered in potential reversal zone.
Buying And Sell Targets:
The buying and sell targets according to harmonic BAT pattern should be:
Potential reversal or buying zone: $0.3893 to $0.3475
Fibonacci projection or sell zone: $ 0.4222 to $ 0.5014
Stop Loss:
The potential reversal zone area that is up to $0.3475 can be used as stop loss in case of complete candlestick closes below this level.
Possible profit and loss ratio:
As per above targets this trade has a profit possibility of 44.2% and as per the above-mentioned stop loss, the loss possibility is 11%.
Note: Above idea is for educational purpose only.
