ICX ICON H&S pattern formationHello everyone, I just wanted to share with you in case you are trading icx usdt.
ICXUSDT trade ideas

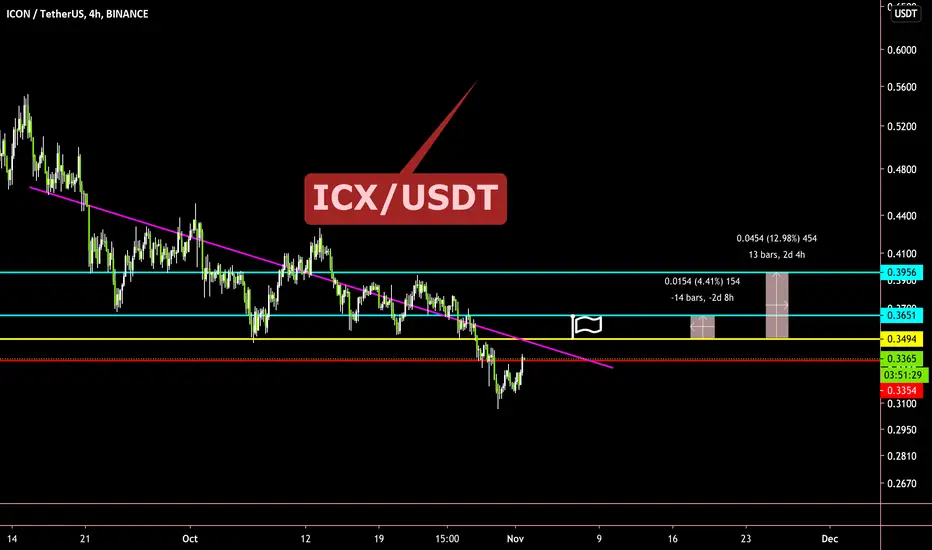
Bearish Divergence on ICXUSDTspotted bearish divergence on the 4hr chart, retrace incoming?? noob at ta here so not trading advice whatsoever

ICX/USDT
Break through the yellow line
Login.....
Crossing the yellow line becomes the stop loss for the deal for those who want to continue with it
Good luck ,,,

ICX/USDT
Break through the yellow line
Login.....
Crossing the yellow line becomes the stop loss for the deal for those who want to continue with it
Good luck ,,,


ICX / USDT look mega bullish to me. #ICX / USDT did make a nice move yesterday. And did break out from a long term downtrend. I't looks like a strong and healthy move imo. Going back testing the support touching the trendine 3 times before bouncing off again. The 4h chart forming a double top thats all.
Not a financial advice just my personal opinion.

ICXUSDT Trading IdeaDespite the unstable current situation on the cryptocurrency market, the Automatic Engulfing Strategy found the possible price movement reverse from the downtrend to uptrend.
This prediction is strongly supported by techical analysis patterns and indicators. There was the price downward descending trend channel for the last day. Now we can notice the channel breakpoint, which with the other indicators confirmed the trend reverse.
The Accumulation/Distribution Indicalor value have been almost constant during this price falling period. This means that there were no bearish activity and coin is underestimated now.
The Aroon-down line went down, that is the downtrend end evidence. And the last one proof of the future price growth is the crossing of the MACD Line and the Signal Line by the bullish type.
We expect the 3.2% price growth from 0.3163 to 0.3264. The alert was automatically executed by SkyRock Signals trading bot.

ICX/USDT
Login.....
Crossing the yellow line becomes the stop loss for the deal for those who want to continue with it
Good luck ,,,

ICX long Buy @ 0.3107 to 0.3140
Sell @ 0.4111 to 0.4222
Stop loss 0.3065
Bullish divergence
A lot of great things coming kindly leave a like and follow for quick update.

ICON (ICX) Big Pump Ahead After This DumpHey friends, hope you are well and welcome to the new update on ICON coin.
Previously I shared idea on ICX coin where I told you that the priceline is at the support of a down channel and up to 367% move is expected. And finally, by the grace of Allah the most high, the price action of ICX started a bullish rally and produced more than 300% rally as predicted.
The previous idea:
If we take a look at the live chart then it can be observed that since start of the 2020 the price action turned bullish two times. 1st in the month of January when it produced more than 424% bullish rally and second when it turned again bullish from March to Aug 2020 and produced more than 550% rally. Now the price action is again moving down. So far it has retraced more than 61.8 Fib level and moving towards 0.786 Fibonacci.
After the ICX team updated their road map on 1st Oct and announced the Gangnam Testnet at the end of Oct, it was expected that the Month of October will be bullish for ICON coin. But the priceline continue to move down and despite this great event, the price action was not affected.
However, I have observed that the priceline of ICON coin may move more down but soon there is a 600% pump expected. So let’s try to understand how much it can be moved more down and when it can start the rally to the upside and what should be the targets.
If we take a look on the daily chart then candlesticks of ICX with USD pair has formed a falling wedge pattern and further more ups and down movements can change this pattern from wedge to pennant soon. The 50 simple moving average is moving down to form a death cross with 200 SMA. And this cross can increase the sell off soon.
Now if we take a look at ICX with USD pair on the long term monthly chart, then it has completed a bullish Cypher pattern and entered in potential reversal zone.
Even though the priceline has completed a Cypher move in US Dollar market but I would not suggest you to place your buying order at the moment. Because the price action of ICX coin is completing the final leg of bullish Shark pattern in Bitcoin market on long term monthly chart. Therefore I would suggest to wait for the completion of this Shark’s leg and let the price line enter in the potential reversal zone of this harmonic move.
The second thing I would suggest before buying the ICON coin we should keep an eye on the movement of exponential moving averages with the time period of 10 and 21 on daily chart. At this time it can be seen that these EMAs are in bear cross. Once the price action will be in potential reversal zones of Cypher and Shark as mentioned above and the EMA 10 crosses up the EMA 21 then we can place our buying orders and set the stop loss the maximum extent of potential reversal zones.
The buying and sell targets as per Fibonacci sequences of Cypher and Shark harmonic patterns can be as below:
Buying and sell targets of ICX with US Dollar pair:
Potential reversal or buying zone: $0.3720 to $0.2557
Fibonacci projection or sell zone: $0.4636 to $0.6829
Buying and sell targets of ICX with US Dollar pair:
Potential reversal or buying zone: 0.00001981 to 0.00000742 btc
Fibonacci projection or sell zone: 0.00003102 to 0.00005609 btc
Conclusion:
Even though the priceline of ICX is forming perfect harmonic moves, but we should strictly take care of stop-loss because if the priceline will break down the PRZ levels then it can turn more strong bearish.
Note: The idea above is for educational purpose only, do not take it as investment advice.

ICXUSDT formed bullish Cypher | Upto 167% move expectedHey friends, hope you are well and welcome to the new update on ICON (ICX) coin.
On a long term monthly chart, the price action of ICX has completed the final leg of bullish harmonic Cypher pattern and entered in a potential reversal zone.
Buying And Sell Targets:
The buying and sell targets according to the Fibonacci sequence of harmonic Cypher pattern should be:
Potential reversal or buying zone: $0.3720 to $0.2557
Fibonacci projection or sell zone: $0.4636 to $0.6829
Stop Loss:
The potential reversal zone area that is up to $0.2557 can be used as stop loss in case of complete candlestick closes below this level.
Possible profit and loss ratio:
As per above targets this trade has the profit possibility of 167% and as per above-mentioned stop loss, the loss possibility is 31%.
Note: The idea above is for educational purpose only, do not take it as investment advice.


ICX Back to support zoneICX back to support zone. This has been tested few times already.
Expecting to go up soon.
All details in chart.


Strong ICX StartICX chart have a very string W pattern and jump soon.
its have a 3 target and first target for that is very easy to reach that.


ICXUSDT Pump Coming?ICX break the downtrend line and retested it. The coin tested the major support zone and bounced back. This is a good buy for the next few days and will give handsome profits.
Buy Zone: $0.36-$0.38
Target: $0.42- $0.45 - $0.50 - $0.55 - $0.65 - $0.80
Stop Loss: $0.33


ICX / USDT. Trying to breakout!Looks good, now trying to break falling wedge. Targets: 0.45, 0.54, 0.68.

ICXUSDT ------->>> Andrews PitchForkHey guys
As shown in the chart, the price is moving towards the midline of the Andrews PitchFork. If the price crosses the middle line, it can increase to the upper line of the fork, where the resistance area of 38.2% Fibonacci is located.
