ICXUSDT trade ideas


Breakout on the 4h ICX and XTZI took two trades at the green line on ICX and XTZ.
XTZ confirmed breakout of the bull flag, as wel at the trend line and the dashed trend line. At the weekly XTZ is forming a hammer, although the weekly candle is still forming itself, it tells me ther is e price rejection from the lower prices.
ICX on the daily resistance turned support. On the 4h a bullish engulfing and at the weekly two long tales driving the price up.


ICX / USDT WEEKLY, SHORT PRICE VIEW!Icon, Bullish on weekly time frame!
Trading above all EMA's & MA's, Round bottom reversal pattern. Also we see clearly an inverted head N shoulders reversal pattern! Nice! So, if we close an weekly candle above the red OB & and retest it successful I Think Icon could go beast mode! Big updates, backed by the Government of Korea, MYID release ETC.
Icon will shine these year and the next years mates! Keep an eye on this beauty!


Is icx going for $ 1? (icon Usdt)it is not investment advice. is my personal amateur work. good luck to everyone.

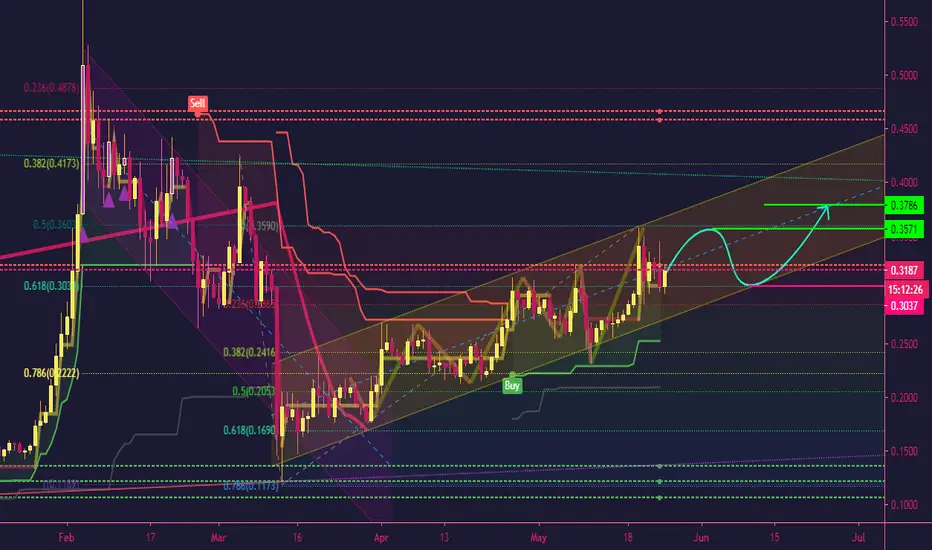
ICXUSDTHello Guys, I think ICX still on going up trend, I think wave 3(SkyBlue) of bigger wave 3(Green) has ended, and now we are heading to wave 4(Skyblue) of wave 3 (Green) which should end around (0.3765 to 0.3650) then we head to 0.48 area (Inshaá Allah).
So what do you think guys?

ICXUSDT - Weekly perspective 300% Target Hello Crypto traders !
You can support me by hitting the like & follow button.
ICX will try to break resistance for the 3th time! 3 is a special number and hopefully we will get follow through.
On the weekly chart we created some sort of a inverse head and shoulders pattern. If we measure the distance from head to the neckline than we have a price range around 300%. If we project that distance from the neckline break we have a target around 1.800.

ICX/BTC - long term tradeone of the best korean projects out there, has been hit real hard during the bear season but still a huge solid project. I can see another $12 dollar per ICX!
I have been accumilating this coin since 2018 but has recently sold it all to trade for quicker scalps which honestly generates quicker income for me. ** I dont recommend you doing that unless you know what you are doing**
Holding is better for you if you are an investor or a noob trader.
Nevertheless, the opportunity is right here at your finger tips. I will still always look out for ICX because its run ups are usually juicy! and will always be ready to sell any other existing trade to get into ICX trade when an opportunity presents itself.
I put down both charts just incase, I think ICX/USDT will outperform ICX/BTC but that is all relative to BTC performance


#ICX/USDT (June 21)ICX seems to be well supported and will not be able to fall this June. The main trend is still up and the target should be $ 0.4 this June and $ 0.5 at the beginning of July.
ICX will be very dangerous if you go into the Ichimoku cloud because it can reach $ 0.25 and it will take a long time to reach that price range.

Going Back NorthPredict a continuation within channel. Clear break from large pull-back.... Making new HH & Hl.


ICXUSD Elliot wave countSo going over the ICXUSD chart here. We have on the lower time frames from the lows a very corrective pattern playing out indicating to me that we will see new lows. I have marked out a bullish count in a white WXY where Y have has already played out. My bearish count has us in a corrective B wave, which will result in an impulsive move to new lows and the bottom hopefully.

ICX/USDTHello friends
According to the analysis I have done, this currency is in an upward tunnel and I expect this trend to increase again and reach the goals I have set for it.
Be happy and successful...

ICON/USDT - upward channelA level squeeze.
Getting to the level. In the ascending channel.
Puncture and fixation will buy.
Make sure you stop loss on the level.
Push ❤️ if you think this is a useful idea!
Before to trade my ideas make your own analysis.
Thanks for your support!

ICX Multiple scenariosICX has to make a move very soon
Now, what do we see?
Big picture shows we are at the end of the triangle, so a big move is just a matter of time.
Bearish signs:
* Ascending wedge (66 days)
Low volume
Overhead MA resistance (MA 20-100)
MACD trend is down
Neutral signs:
RSI straight at the 50 level
Bullish signs:
* Bullish pennant (114 days)
Above and supported by MA50 and MA200 support
MACD and momentum possible trendchange
Advice: no trading zone at the moment.
- Set your SL tight at the bottom of the triangle or under the MA50
- Set your alarm at the top of the triangle and get in poistion when it breaks above

ICXUSDTEntry requirements: The candle closes four hours above yellow
STOPLOSS The candle closes four hours under red
target in chart

ICX/USDTHello friends
According to the analysis I have done, this currency is in an upward tunnel, and according to the order given by the Kurdistan indicator Flaming candles for purchase, I expect it to reach the targets I have set for it in the long run.
Be happy and successful
ICX (Y20.P3.E1).Macro.Nice trendHi All,
Observations:
==========================================================
> ICON \ ICX shows a nice price action within a channel in a uptrend with higher highs and higher lows
> 1st rejection with the lead in trend line (resistance)
> The 10\20 and 50 ema have shown levels of support
> Bearish divergence has played out on the 12H as per this chart
> MR and MS are monthly resistance and support lines
Thoughts:
==========================================================
> BTC dominance is dropping
> 12 Hourly chart indicator shows downward pressure still their based on the RSI, also there on the daily chart
> Looking for confluence of price reversal at these moving average levels or fib levels in the channel
> So with this context, we can use the 10, 21, or 50 ema and or the levels in the channel, to look for setups for entry (in the 6 H, 12 H time frame, as per chart)
> Triangle area is my area of interest to enter (0.28 to 0.31)
Close up view > Area of interest 0.28 to 0.31
6 HRLY chart > downward pressure still there with bearish divergence in play
12 HRLY chart > downward pressure still there with bearish divergence in play
1 Day and above chart > MACD has bullish tone
Holistic overview > observe how the trend line is playing resistance and the 1st rejection.

