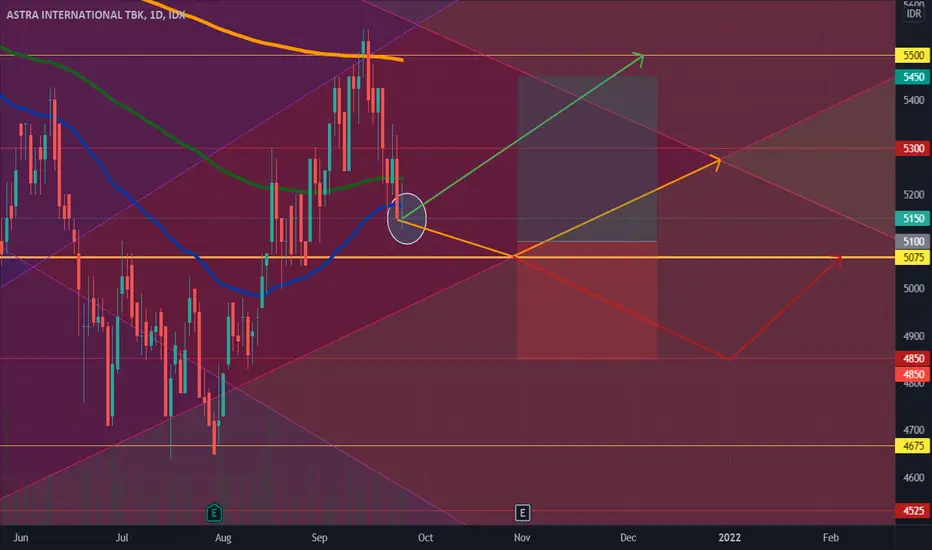
IDX: ASII , FOR NEXT WEEKSTRONG SUPPORT AT 5075
STRONG RESISTANCE AT 5500
I prefer yellow trading plan
Disclaimer:
This information is for educational purposes and is not an investment recommendation or representative of professional expertise. This analysis used herein is for illustration purposes only. This personal opinion should not be considered specific investment advice. I am not responsible for any trades, and individuals are solely responsible for any live trades placed in their own personal accounts.
ASII trade ideas
ASII still in the resistance, if break, will gain 27% potentialASII still in the resistance, if break, will gain 27% potential.

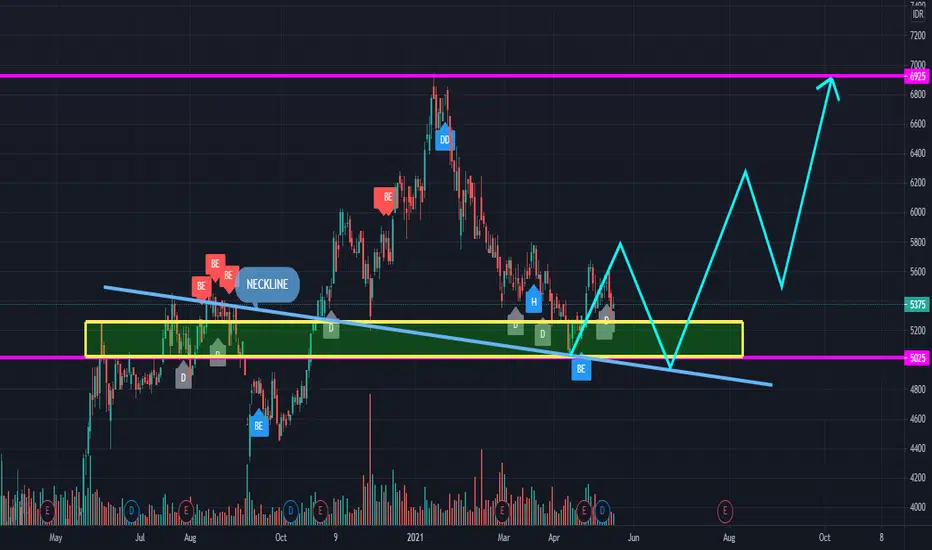
ASIISudah confirm breakout dari pola reversal Head n Shoulder dan sedikit lagi akan crossing ke MA99

S&R ASIISupport = yellow horizon line
Resistance = green horizon line
Rectangle = Big Supply & Demand
TrendLine = Purple
Buy on support 4500-4750
Target 5600
*WARNING*
NOT FOR RECOMMENDATION
THIS IS ONLY MY PRCE ESTIMATION
DISCUSSION ALLOWED


ASII Bullish PatternI know ASII is on downtrend …. But I found a bullish movement, thats it a decending broadening wedge and abcd harmonic pattern …. So because ASII is on downtrend the target price is better on 5300-5350… Hopefully this pattern would be work #disclaimeon


ASII DAILY OUTLOOKMany confirmation in there, like channel, Fib, Support zone , etc. you can buy when you see a reversal candle

ASII Hidden Bullish DivergenceHidden bullish divergence on ASII 1D. Price higher low from 30 Nov 2020 and lower low on RSI 14.
DISCLAIMER: Not financial advice or a solicitation to buy!

ASII Rebound PotentialUsing trendline as possible support for ASII at 5475. Watch for rebound, might be invalidated if price breaks down beyond 5475.
DISCLAIMER: Not financial advice or a solicitation to buy!


ASII RSI 14 Divergence Bearish Potential ENThis is personal opinion not a recommendation nor a signal, disclaimer on.
There is negative divergence between the price and RSI indicator. However this divergence doesn't confirmed yet, the confirmation came from violation of the current bull trendline. There is 2 Scenario that would likely to happen if the analysis correct. Its either a trendline breakout into previous swing low level in 5200, or it can make head n shoulder pattern since there is positive sentiment for this automotive industry.

Why Cut Loss in ASII?ASII is a retail favorite LQ45 stocks, including me. But a few days ago, I decided to sell ASII with loss.
Here is the reasons:
1) After bouncing back from support at EMA100 and breaking EMA50, it turned out that ASII was unable to break through to EMA20 and turned back to EMA100.
2) When it fails to break EMA20 at 6275 and then goes down, the chart formation is potential to form a Head and Shoulder pattern.
3) Because ASII is a share held most by foreigners with a proportion of 72% as of 31 January 2021, it is important to look at foreign flows. And it turns out that foreigners have made significant distribution actions.
There is also some speculations spread out in connection with the slump in ASII. There are those who associate it with the collapse of the Cipali toll road, there is also because of foreign broker portfolio rebalancing by exchanging ASII's ownership to BBRI and ANTM (because of MSCI).
Whatever it is, the chart shows a potential for a significant decline, if the HnS scenario occurs.
The decision to sell is a rational decision, as it seems. What you see is what you get.
So Simple!
I will wait for the correction in the area that I have marked on the chart.
@MonsterTurtle


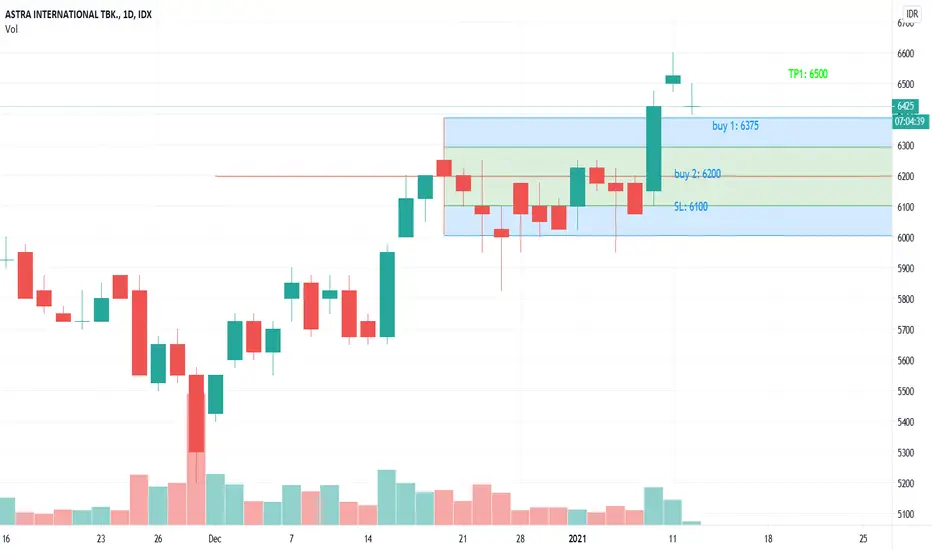
ASII (Swing Trading, January 2021)Trade at your own risk. price 6450-6425. Situationally, you can enter on 6425. Any feedback is appreciated, we are live!
ASII - Target 7,750Hola.
ASII , salah satu bisnis dengan manajemen terbaik di BEI pada akhirnya mulai memperlihatkan taring.
Yup, ada potensi saham ini bisa melanjutkan kenaikannya ke 7,750 tentu disertai dengan gelombang naia turun seperti biasanya.
So, good luck...

ASII - 06 Dec 2020 - Cup&Handle Breakout Pullback (Daily Chart)ASII - 06 Dec 2020 - Cup&Handle Breakout Pullback (Daily Chart)
Target 1 Rp.6700
Target 2 Rp.7500
Complete trade plan on charts
1. Blue box = Preferred Buy Area (PBA)
2. Red box/line = Stoploss
3. Green box/line = Target
