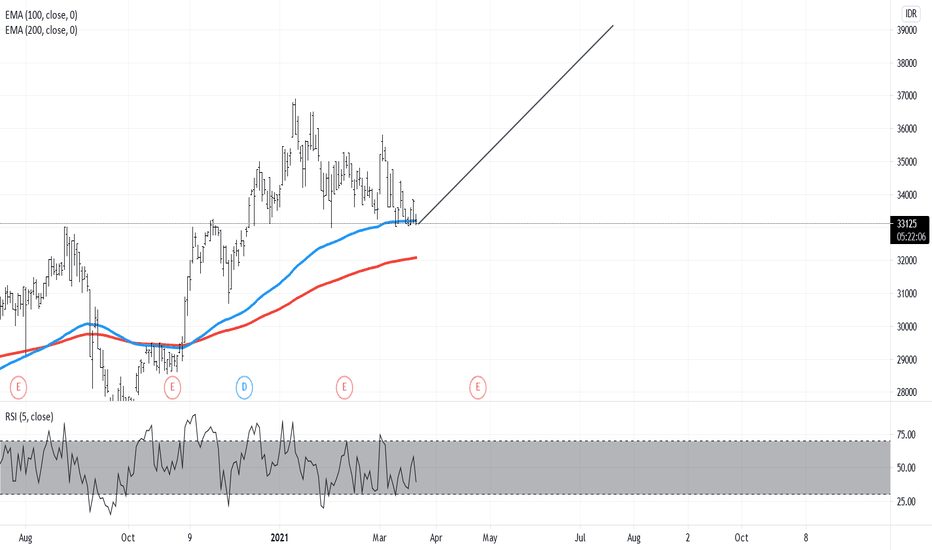
BBCA trade ideas
IDX: BBCA PREPARE YOURSELFweak resistance at 33150
medium Support at 31475
market close at 32825, it's surpass 33150. it'll be continue to 31475. but if market could make it rebound to up to his weak resistance at 33150. it potentially fly to 34.xxx
we dont know , if you want to set but. buy it at 33.300 and out at 33.700 that will be good, for you who wanna try.
for me i will wait for tomorrow
have a nice trading.
Disclaimer:
This information is for educational purposes and is not an investment recommendation or representative of professional expertise. This analysis used herein is for illustration purposes only. This personal opinion should not be considered specific investment advice. I am not responsible for any trades, and individuals are solely responsible for any live trades placed in their own personal accounts.
IDX: BBCA PREPARE YOURSELFWeak support at 33150
Medium Resistance 34075
we need to be patient, be neutral for tomorrow but when it reach at 33150 prepare for bouncing, after that go for it.
I prefer for orange trading plan.
have a nice trading.
Disclaimer:
This information is for educational purposes and is not an investment recommendation or representative of professional expertise. This analysis used herein is for illustration purposes only. This personal opinion should not be considered specific investment advice. I am not responsible for any trades, and individuals are solely responsible for any live trades placed in their own personal accounts.
BBCA Buy on BreakoutWeekly Chart > Indicator: MA100 & 200, MACD & Stochastic Default Setting
- MA > The last price in weekly chart moving above MA100 and the MA100 moving above MA200, which mean the price still moving in the good uptrend side
- Stochastic > Down to over sold area
- MACD > MACD line cross down the signal line in positive area and the histogram seen negative
Daily Chart > Indicator: MA100 & 200, MACD & Stochastic Default Setting
- MA > Price moving in the uptrend area but is experiencing sideways in several weeks due to ATH resistance
- Stochastic > Over sold
- MACD > Sideways signal and small histogram
Fundamentals :
Income Statement > BBCA income summary shows a relatively stable increase even though in 2020 there was a decrease in net income from the previous year
www.investing.com
Strategy :
Buy BBCA when Weekly Chart breakout from the resistance area which will be retested the price in the 35600-36975
Purchases can be made for 1-2 ticks above the resistance area in anticipation of a false breakout and place a stop loss if necessary
The Fibonacci cluster line shows the resistance area after the breakout will occur in the 45800-47775 area and can be used as a profit target
DISCLAIMER :
- All material contained in this content is for educational purposes
- We are not responsible in your loss or gain
- Always do your own research
- Always understand the markets are very risks and please use financial management for your investments
BBCA (weekly timeframe, stochastic prediction, swing trading)Downtrend.
Buy 33k
Sell 34k/35k as always (every week it's always like that). almost 35,800. But i don't think we are allowed on 36k
By Window Dressing month, you may get 40k. Whatever it is, it will be higher than before.
If B117 doesn't cause crash tomorrow, if it does, prepare to buy all in on 24k-27k.
Plz share and review, if you have something in mind
BBCA (Feb 2021, Trading)High volatility of IDX towards March 2021. Don't think any good news ever come from March. It could be a saturated month like last year
Here are the multiple trading plans with hope for too much of high return. 36k? cmon. Seriously
One thing for sure, it ain't coming down to 31k. Even if it is, then you would want to go all in at 26k or 28k (deepest dips)
It's always been my style to avoid risk and greed. Get in slow, get out quick.
It's blue chip, it always go up eventually in long term. This is a good one to hold until WD month
BBCA.JK Full Year 2020 Result : slightly above expectationNews just come in from the authority that BBCA.JK posted FY20 Net Profit of IDR 27.1 Trillion (-5.0% YoY), down 5% from last year.
Since BBCA is in Banking Sector, It is on asset Quality parameter, NPL (Non Performing Loan) ratio increased from 1.3% last year to 1.8% in FY20. It is worth to note that coverage ratio increased from 189.2% at 2019 to 260.9% in FY20.
key note :
Loan growth
-2.5% YoY
+1.2% QoQ
Deposit growth
+19.3% YoY
+7.7% QoQ
LDR
Dec-20: 65.8%
Sep-20: 69.6%
Dec-19: 80.5%
Gross NPL
Dec-20: 1.8%
Sep-20: 1.9%
Dec-19: 1.3%
NIM
Dec-20: 5.7%
Sep-20: 5.8%
Dec-19: 6.2%
My position still Bullish for BBCA.JK. With target 37000 or above.
BUY : 34925
Target : 37000 or above
SL : 33625
Disclaimer : I am not a finansial advisor and I do not give any financial advise. This is purely my analysis and due diligence. All profits and losses caused by following my post are at your own risk. I do not take any responsible for your trade.
BANK BCA TBKSunday, 31 January 2021
23:09 PM (WIB)
Very happy to see my Bank has a very good price chart movement with a good and healthy ascending channel, and always moving higher.
Music background by The Doors "Light My Fire"
www.youtube.com
Best regards,
RyodaBrainless
"Live to Ride and Ride to Live"


