BBRI trade ideas
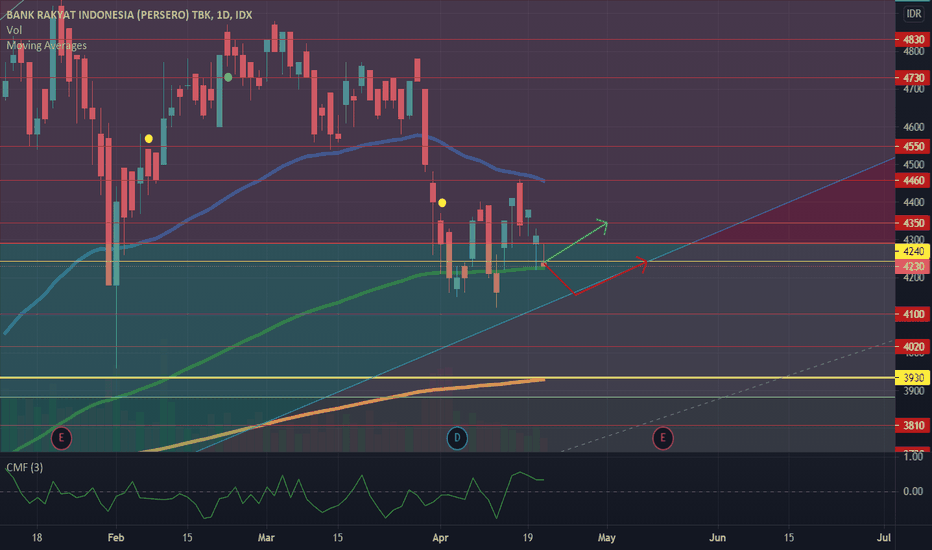
IDX: BBRI , PREDICTION FOR NEXT WEEKweak resistance at 4300 4350 4450
mediumsupport at 4240
Market close at 4280, it'll testing his medium support, possibly rebound to his medium support and go to 4350. set at 4250
Orange trading plan is my recommend,
have a nice trading.
Disclaimer:
This information is for educational purposes and is not an investment recommendation or representative of professional expertise. This analysis used herein is for illustration purposes only. This personal opinion should not be considered specific investment advice. I am not responsible for any trades, and individuals are solely responsible for any live trades placed in their own personal accounts.
IDX: BBRI REBOUND AT EMA 144weak resistance at 4300 4350 4450
medium resistance at 2440
Market close at 2430, it'll testing his EMA 144, and it so strong , possibly rebound to his weak resistance.
Green trading plan is my recommend,
have a nice trading.
Disclaimer:
This information is for educational purposes and is not an investment recommendation or representative of professional expertise. This analysis used herein is for illustration purposes only. This personal opinion should not be considered specific investment advice. I am not responsible for any trades, and individuals are solely responsible for any live trades placed in their own personal accounts.
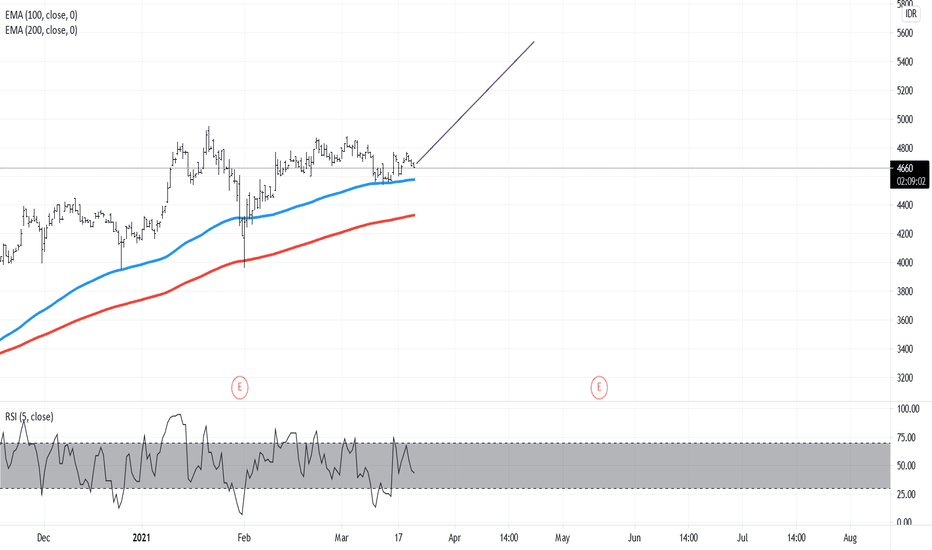
BBRIRESIS AT 4570
SUPP AT 4380
.
Disclaimer:
This information is for educational purposes and is not an investment recommendation nor to be representative of professional expertise. This analysis used herein is for illustration purposes only. This personal opinion should not be considered specific investment advice. I am not responsible for any trades, and individuals are solely responsible for any live trades placed in their own personal accounts.
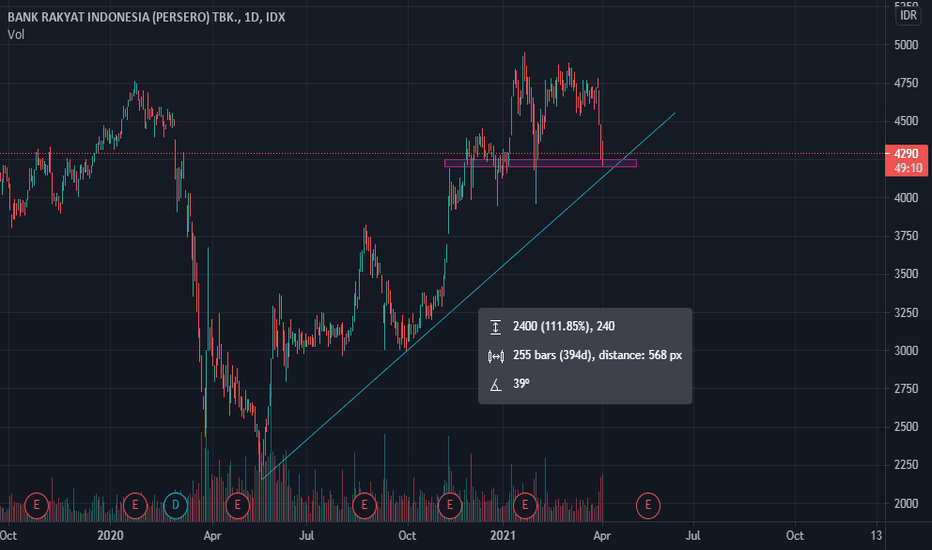
BBRI- Dividend RallyBBRI stochastic showing golden cross, with accumulation by the big broker in the past 7 days. With an annual general shareholder meeting scheduled on March 29th with agenda of profit usage, dividend rally might push the price point to 4850-4970 at its max. But, today there is a bearish maruboze candlestick appears, meaning the price might go down to 4600 or even worst to 4460 before bounceback. Resist is at 4890, with maximum price point (IF) dividend rally happens at 4970.
Rejected by all-time high or new high BBRI? IDX:BBRI
It will be interesting to see whether or not $BBRI will create its new high or be rejected by its all-time high. Well, the upside potential is still a good opportunity to take profit.
Happy trading, and be safe.
Disclaimer:
This information is for educational purposes and is not an investment recommendation or representative of professional expertise. This analysis used herein is for illustration purposes only. This personal opinion should not be considered specific investment advice. I am not responsible for any trades, and individuals are solely responsible for any live trades placed in their own personal accounts.
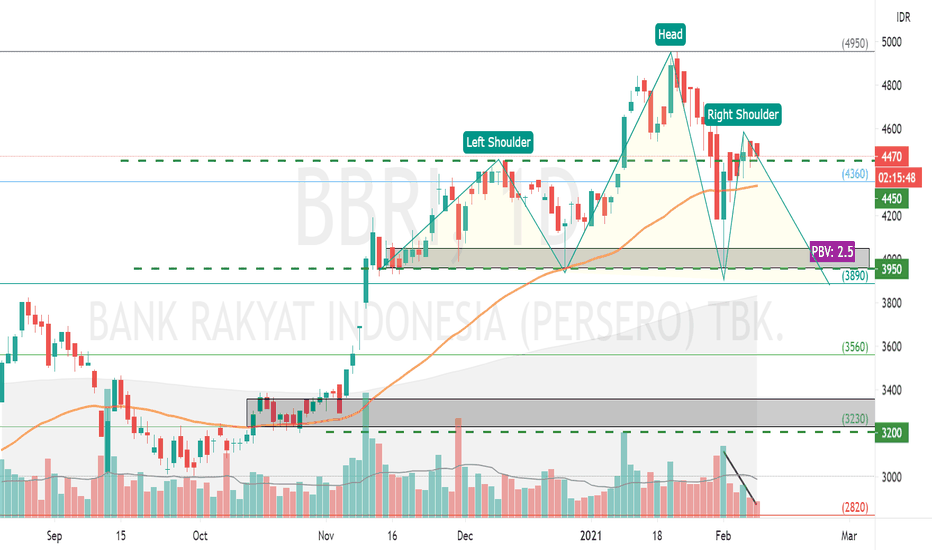
Potential HnS Chart PatternBBRI has the potential to form a Head and Should chart pattern. By looking at last week's movement pattern where the volume at the break of 4470 resistance was not big enough and the trend decreased afterwards, it would be better to wait for confirmation before entry. Possible short-term movement is still sideways.
From the market maker movement side, BBRI is one of the issuers that foreign hold almost 80%, with an average price of around 4400. Currently, Foreign Flow is increasing by a proportion of more than 20%, meaning that the potential will increase and have been accumulated for a long time.
If you want to entry, it's better to wait until technically confirmed.


