−1 IDR
58.59 B IDR
457.59 B IDR
3.54 B
About BEKASI FAJAR INDUSTRIAL ESTATE TBK
Sector
Industry
CEO
Yoshihiro Kobi
Website
Headquarters
Bekasi
Founded
1989
ISIN
ID1000122609
FIGI
BBG002QQ63Q8
PT Bekasi Fajar Industrial Estate Tbk engages in the development and management of industrial towns, including facilities and supporting infrastructure. It operates through the Industrial Estate, Leasing of Production Facilities, Commercial Industrial Estate, and Management of Industrial Estate segments. The company was founded on August 24, 1989 and is headquartered in Bekasi, Indonesia.
Related stocks


BEST My Bullish ViewBEST My Bullish View. Harmonic Pattern Anti Cypher and Butterfly. VCP. Cup and Handle.


BEST IS A Beautifuly Momenti look BEST potential break near resistance , i think BEST good for buy on weeknes & neutral trend.
if break reisitrance , BEST can up resistance 1 : 168 , maybe after until resistance 1 BEST will correction for weekly , and next resistance BEST will up to 210.
disclaimer On

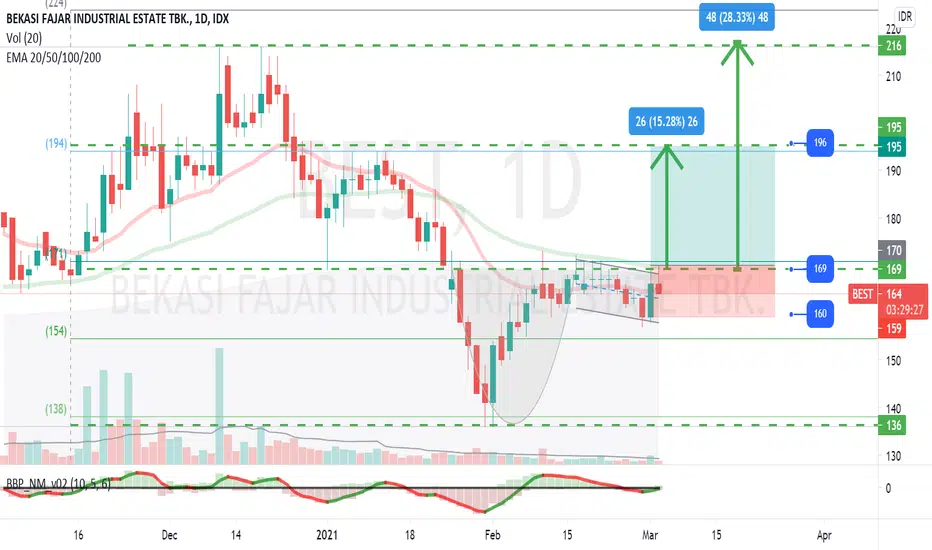
Potential CnH PatternBEST has potential to form Cup and Handle pattern
Buy if price breaks 169
SL: 160
Target: 196
THE BEST IN ITS SECTOR, AND IT IS "BEST"Supporing Data:
- Midterm, the structure is still uptrend identified by price still making Higher Low
- 3 Days TF, SR flip has been highlighted in the greenbox
- Several Bull Engulf if zoom in in the daily timeframe (in the zoom between 138-140) concurrent with a setup of retracement
The level of

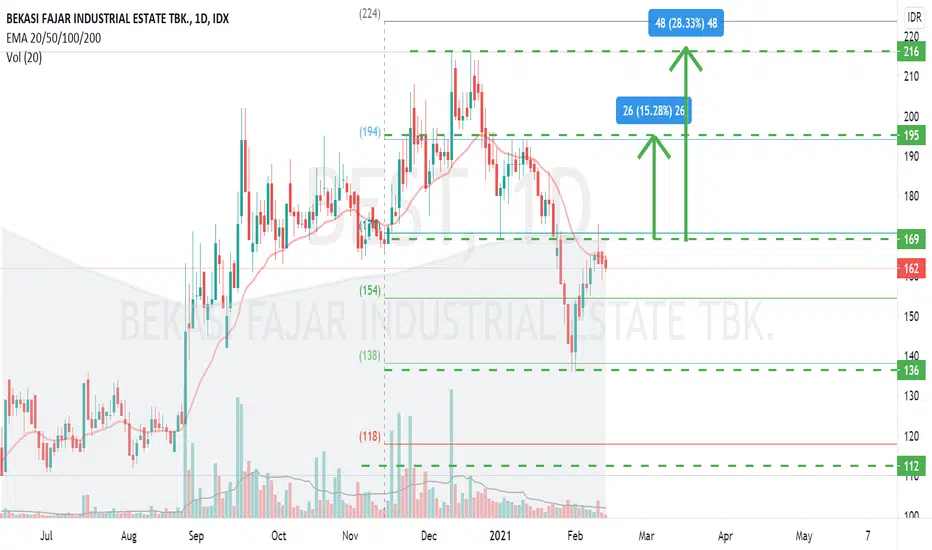
Potential Area to BuyShort Term Trading
Consider to BUY if price > 169
Target1: 195
Target2: 210
Domestic : Foreign Composition = 50:50
LONG TERM
PBV BEST is still under its 5 yrs average (0.64), current = 0.36

BEST buy on breakoutUptrend (Full Green)
Consolidation after Volume breakout with good candlestick
-> Buy on breakout

See all ideas
Summarizing what the indicators are suggesting.
Neutral
SellBuy
Strong sellStrong buy
Strong sellSellNeutralBuyStrong buy
Neutral
SellBuy
Strong sellStrong buy
Strong sellSellNeutralBuyStrong buy
Neutral
SellBuy
Strong sellStrong buy
Strong sellSellNeutralBuyStrong buy
An aggregate view of professional's ratings.
Neutral
SellBuy
Strong sellStrong buy
Strong sellSellNeutralBuyStrong buy
Neutral
SellBuy
Strong sellStrong buy
Strong sellSellNeutralBuyStrong buy
Neutral
SellBuy
Strong sellStrong buy
Strong sellSellNeutralBuyStrong buy
Displays a symbol's price movements over previous years to identify recurring trends.
Frequently Asked Questions
The current price of BEST is 101 IDR — it hasn't changed in the past 24 hours. Watch BEKASI FAJAR INDUSTRIAL ESTATE TBK stock price performance more closely on the chart.
Depending on the exchange, the stock ticker may vary. For instance, on IDX exchange BEKASI FAJAR INDUSTRIAL ESTATE TBK stocks are traded under the ticker BEST.
BEST stock has fallen by −3.81% compared to the previous week, the month change is a 4.12% rise, over the last year BEKASI FAJAR INDUSTRIAL ESTATE TBK has showed a −3.81% decrease.
We've gathered analysts' opinions on BEKASI FAJAR INDUSTRIAL ESTATE TBK future price: according to them, BEST price has a max estimate of 120.00 IDR and a min estimate of 120.00 IDR. Watch BEST chart and read a more detailed BEKASI FAJAR INDUSTRIAL ESTATE TBK stock forecast: see what analysts think of BEKASI FAJAR INDUSTRIAL ESTATE TBK and suggest that you do with its stocks.
BEST reached its all-time high on May 1, 2013 with the price of 1,050 IDR, and its all-time low was 74 IDR and was reached on Apr 8, 2025. View more price dynamics on BEST chart.
See other stocks reaching their highest and lowest prices.
See other stocks reaching their highest and lowest prices.
BEST stock is 3.00% volatile and has beta coefficient of 1.27. Track BEKASI FAJAR INDUSTRIAL ESTATE TBK stock price on the chart and check out the list of the most volatile stocks — is BEKASI FAJAR INDUSTRIAL ESTATE TBK there?
Today BEKASI FAJAR INDUSTRIAL ESTATE TBK has the market capitalization of 974.38 B, it has decreased by −4.76% over the last week.
Yes, you can track BEKASI FAJAR INDUSTRIAL ESTATE TBK financials in yearly and quarterly reports right on TradingView.
BEST net income for the last quarter is −25.36 B IDR, while the quarter before that showed −33.16 B IDR of net income which accounts for 23.52% change. Track more BEKASI FAJAR INDUSTRIAL ESTATE TBK financial stats to get the full picture.
BEKASI FAJAR INDUSTRIAL ESTATE TBK dividend yield was 0.00% in 2024, and payout ratio reached 0.00%. The year before the numbers were 0.00% and 0.00% correspondingly. See high-dividend stocks and find more opportunities for your portfolio.
As of Aug 12, 2025, the company has 217 employees. See our rating of the largest employees — is BEKASI FAJAR INDUSTRIAL ESTATE TBK on this list?
EBITDA measures a company's operating performance, its growth signifies an improvement in the efficiency of a company. BEKASI FAJAR INDUSTRIAL ESTATE TBK EBITDA is 114.22 B IDR, and current EBITDA margin is 40.40%. See more stats in BEKASI FAJAR INDUSTRIAL ESTATE TBK financial statements.
Like other stocks, BEST shares are traded on stock exchanges, e.g. Nasdaq, Nyse, Euronext, and the easiest way to buy them is through an online stock broker. To do this, you need to open an account and follow a broker's procedures, then start trading. You can trade BEKASI FAJAR INDUSTRIAL ESTATE TBK stock right from TradingView charts — choose your broker and connect to your account.
Investing in stocks requires a comprehensive research: you should carefully study all the available data, e.g. company's financials, related news, and its technical analysis. So BEKASI FAJAR INDUSTRIAL ESTATE TBK technincal analysis shows the buy rating today, and its 1 week rating is neutral. Since market conditions are prone to changes, it's worth looking a bit further into the future — according to the 1 month rating BEKASI FAJAR INDUSTRIAL ESTATE TBK stock shows the sell signal. See more of BEKASI FAJAR INDUSTRIAL ESTATE TBK technicals for a more comprehensive analysis.
If you're still not sure, try looking for inspiration in our curated watchlists.
If you're still not sure, try looking for inspiration in our curated watchlists.