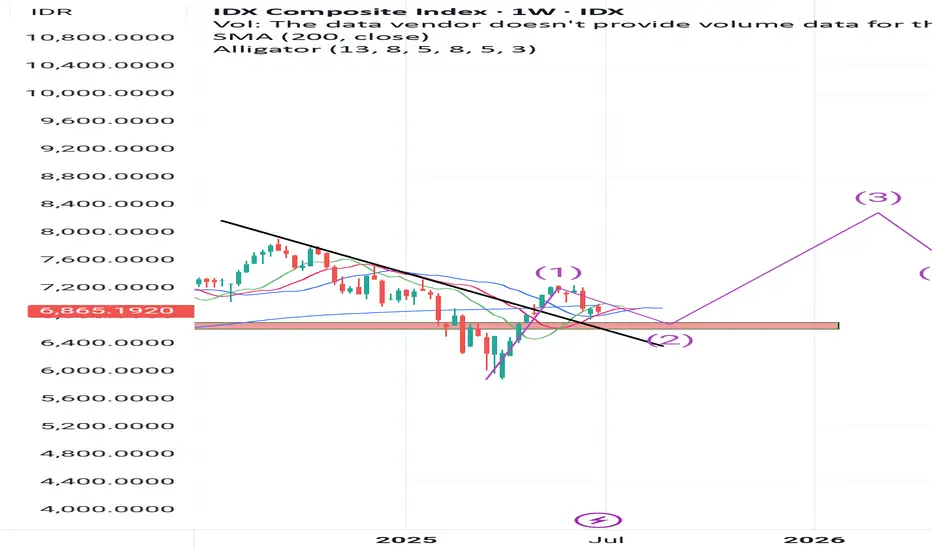
IDX Composite: Bullish in medium term- long termIDX is currently entering wave 2 (correction wave) with a target decline in the range of 6600-6800 (supply zone).
In my opinion, this decline is part of the move towards wave 3 (bullish wave) in the medium term.
Investment strategy:
Gradual collection of bluechip stocks in the banking sector, commodities when the JCI is corrected approaching the supply zone and Collect for a period of 1-1.5 years.
For me, the JCI has just started entering a long-term Bullish wave.
COMPOSITE trade ideas
IHSG / COMPOSITE (IDX) DAILY CHART DOUBLE TOP DETECTEDIHSG going to close the gap at 65xx.. (first gap).
the worst case IHSG will close the 2nd gap (61xx) << Mostly happened.
after that we hope IHSG will start to Bullish once more.
so just wait n see for now. After IHSG closing all the gap, we can start buying all the bluchip stock like banking sector (BBRI, BBCA, BMRI, BBNI).

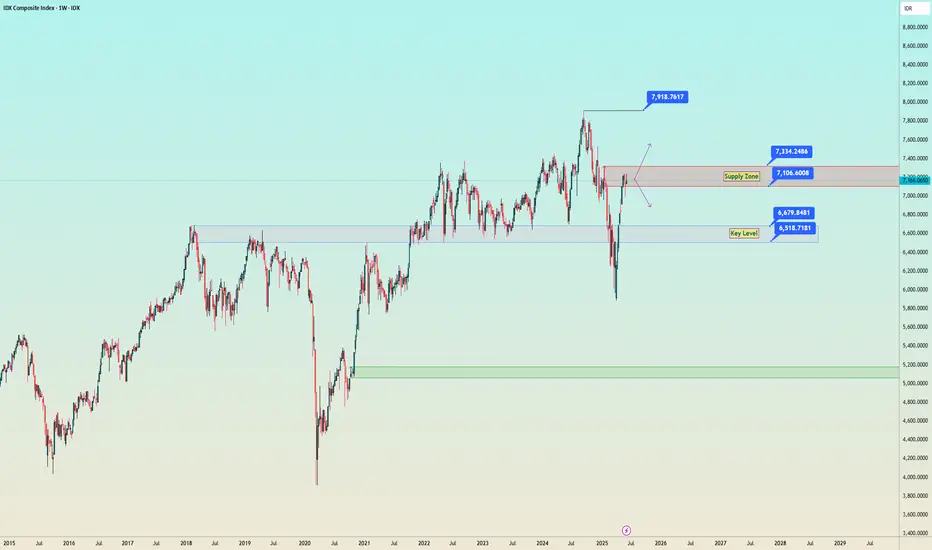
IHSG / IDX - Wait and See...Continue or pullback ?
Currently our IDX Composite in Supply Zone and Candle stick shown push back from Seller since last week.
Need to get confirmation whether this week IDX will pass the supply zone or it will pull back to "key level" area.
Enjoy !
IHSG AFTER BREAKMarket globally is crashed because of the new tariff that US applied. IHSG might as well crashed after this break, approaching 58xx. But i believe after this correction IHSG Will back in action and reach 67xx.

IHSG 36000IHSG will go to 36000
Currently, the prediction for the Jakarta Composite Index (JCI) is still far from 36,000. Based on the latest analysis, the JCI is estimated to move in the range of 6,800 to 7,150 in the short term. Positive sentiment from the trade deal between the United States and China has indeed provided encouragement, but this strengthening is still considered limited and prone to technical corrections. If there are major factors that can push the JCI to a much higher level, such as extraordinary economic growth or a surge in foreign investment, then there may be an opportunity to achieve a more ambitious figure. However, for now, the realistic target is still in the range mentioned.

COMPOSITE Is About To End The DowntrendIDX:COMPOSITE
As the picture says, currently COMPOSITE aka IHSG is forming broadening wedge pattern. This pattern indicates bullish potential, but hasn't been confirmed since the current level is still below 6500.
Most stocks will start going up after the confirmation of this pattern, so use this moment to buy on weakness on your favorite stocks.
Our picks: BBNI BBCA ITMG GOTO


$IDX:COMPOSITE
This scenario was created due to the effects of the trade war and when the tariff was announced, the IDX Indonesia stock market was on a long holiday.
I predict that IHSG could GAP DOWN when it open on 8th April here some of my view :
Black line scenario 1 Correction 6265 5% Close Gap & Trading Halt tomorrow rebound and continue to decline to the support limit of 5700.
Red line scenario 2 Correction 6265 (5%) Close Gap & Trading Halt tomorrow continue the next decline 6000 rejection at 5700.
Green line scenario 3 Healthy correction 6350 and tomorrow break resistance to 6700.
IDX:COMPOSITE

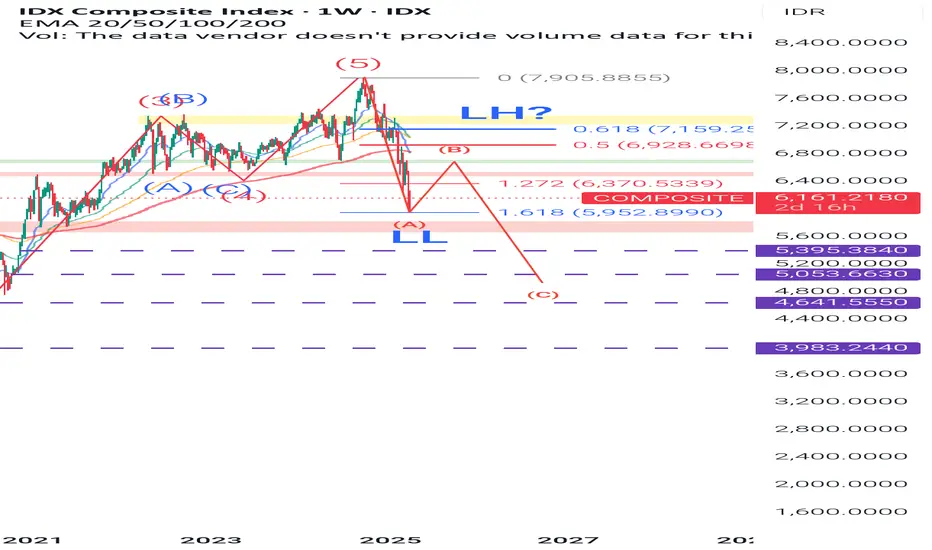
Big Bearish IHSGMy POV to IHSG
Big Elliot Wave 5 is finished & almost finished making a big Correction to point A.
Will continue to make LH to point B & if confirmed point B is continued there is a rejection at resistance, meaning it is mandatory to sell all stocks in any position (profit / loss).
Focus on saving, collecting money & wait again when Correction C is finished.
When? Maybe point B will be finished in 4-6 months.
We will see, this is not spreading fear, but more the best investment strategy.
Later it will be updated again based on news, fundamentals & macro news in Indonesia and globally.
IHSG toward 2nd Monthly FVGIHSG is continuing its strong bearish movement. Yet, indication for reversal is far beyond. Considering this condition, "do nothing" is the best strategy until the Whale Investor accumulate.

“IDX Composite Index: Assessing the Depth of the Downtrend”The IDX Composite Index is expected to remain under pressure, forming wave of wave A. The nearest corrective target for the index is projected in the 5,879–5,975.
This outlook aligns with prevailing market sentiments, as Indonesia’s economic and political landscape has yet to support a trend reversal. Additionally, global sentiment remains negative, further weighing on the index.

IHSG where are u going guys?Disc On. There will be at least 2 scenario that will occur to IHSG next "big flow" which might be breakout the existing resistance and keep skyrocket to new ATH (everybody hope so) but i have one view also that IHSG will do one more trading halt till the support area. Hence, this is not a very practical analysis only a rough view and I personally take this opportunity to view and see first before getting fully at the market. Like every good inverstor said, cash is also a position.

IHSGNot a positive sentiment and also technically not looking good
Bearish bias remains dominant :
Potential retracement to 6310 - 6400 before further decline
Downside targets: 6000 - 5900 (key support level)
If 5900 is broken, a further drop to 5600 - 5500 is possible
I hope im wrong :(
lately there have been a lot of buyback news in conglomerate and bluechip stocks (bbca,Adaro group and Barito group). But in reality it still hasnt been able to counter foreign movements
So, its best to wait and see for now

IHSG (JCI ) MAPPING 20 MARCH 2025IHSG (JCI ) analysis on March 20, 2025 theoretically shows that it has completed the triple zigzag wave correction (WXYZ) with 11 swings of the Elliott wave correction series and touched the theoretical level of 0.618 (area 6,018.22) Fibonacci extension measurements. In addition, it has also touched its Fresh Demand Weekly area and reacted upwards. So the hope for the future is that IHSG (JCI ) will continue it's big bullish trend journey again after being corrected.
May we be blessed.

MAPPING JCI 20 MARCH 2025JCI analysis on March 20, 2025 theoretically shows that it has completed the triple zigzag wave correction (WXYZ) with 11 swings of the Elliott wave correction series and touched the theoretical level of 0.618 Fibonacci extension measurements. In addition, it has also touched its Fresh Demand Weekly area and reacted upwards. So the hope for the future is that JCI will continue it's big bullish trend journey again after being corrected.
May we be blessed.


WILL IHSG SURVIVE IT 6,500 LEVELS? 1. Trend & Market Structure
IHSG is still in a downtrend, indicated by lower highs and lower lows.
The price recently attempted to break the downtrend line, but there are signs of a false breakout as it dropped again near resistance.
2. Support & Resistance Levels
Nearest Support: 6,500 - 6,530 (currently being tested).
Strong Support: 6,260 - 6,170 (if further breakdown occurs).
Nearest Resistance: 6,583 - 6,683 (a level that needs to be broken for short-term bullish confirmation).
Major Resistance: 6,907 (a strong resistance that could signal a trend reversal if broken).
3. Indicators & Further Signals
Short-term EMA/MA: The price is moving around a small moving average (possibly MA5 or MA10), indicating uncertainty about whether it will continue rising or get rejected downward.
Candle Pattern: A doji or rejection candle is forming near minor resistance, which could signal potential weakness.
Breakout Trendline?: The price has briefly moved above the downtrend line, but confirmation is needed to determine if this is a valid breakout or just a retest before dropping again.
4. IHSG Projection
Bullish Scenario: If IHSG can hold above 6,530 and break through 6,583-6,683, it could continue rising towards 6,900.
Bearish Scenario: If it fails to stay above 6,530, it may drop further to the strong support zone of 6,260-6,170.
Conclusion:
Right now, IHSG is at a crucial level. It’s important to see whether it can hold above 6,530 or break down further. If you're trading in the short term, wait for confirmation to see if IHSG will break out or face rejection from this level.

Bad situation in IHSG IDXA lower low has formed, and the price has broken through all key moving averages. This might suggests a confirmed downtrend from here.

Possible Downtrend for IDX Composite Back to 6000A deep analysis found that we may experience a possible downward movement for IDX Composite Back to 6000 that peaked around March 5, 2025


Indeks Harga Saham Gabungan (IHSG) Indonesia Stock ExchangeLet me know ur thought! I think there's bearish pattern on this IHSG chart, feel free to discuss!!

IHSG (Composite) Strong Support At 6500 (WEEKLY CHART)IHSG strong support at 6500. Mostly will get rebound first, but IF IHSG breakdown the strong support (6500) then maybe we can forget to trade on indonesian stock for a while. Because if IHSG break the strong support and continue the bearish trend, then the next target area strong support is at 5700-5600 area. Lets pray it wont happen
DISCLAIMER ON

IDX COMPOSITE is not going well.IDX:COMPOSITE
There is Ascending Broadening Wedge (ABW) pattern in weekly time frame. Be careful. Once it break the lower line pattern (yellow dash line), it can be measured, by the theory it will go down to 5620.
I don't know what will happend in the future that will lead the bearish. I hope it's not another "covid19". 🤞🤞🤞
