DOW JONES INDEX (US30): Consolidation is Over
Dow Jones Index completed a bullish accumulation on a daily.
The price violated a key horizontal resistance cluster and closed above that.
Next goal for bulls is 43790.
❤️Please, support my work with like, thank you!❤️
I am part of Trade Nation's Influencer program and receive a monthly fee for using their TradingView charts in my analysis.
DOW trade ideas

Market Heist in Progress! US30/DJI Long Trade – Ride or Escape?🔥 "The US30/DJI Heist: Bullish Loot & Escape Before the Trap!" 🔥
🌟 Hi! Hola! Ola! Bonjour! Hallo! Marhaba! 🌟
Dear Money Makers & Market Robbers, 🤑💰💸✈️
Based on the 🔥Thief Trading Style🔥 (technical + fundamental analysis), here’s our master plan to heist the US30/DJI (Dow Jones Industrial Average). Follow the strategy on the chart—long entry is the play! Aim to escape near the high-risk RED Zone (overbought, consolidation, potential reversal). The bears are lurking, so take profits and treat yourself—you’ve earned it! 💪🏆🎉
🚀Entry (The Vault is Open!)
"Swipe the bullish loot at any price!"
For precision, place buy limit orders within 15-30min timeframe (recent swing lows/highs).
Set alerts! Don’t miss the heist.
🛑 Stop Loss (Safety Net)
Thief-style SL at nearest swing low (3H timeframe) → 41,400 (adjust based on risk/lot size).
🏴☠️ Target 🎯: 44,200.00
Bullish momentum is fueling this heist—ride the wave but exit before the trap!
📰 Fundamental Backing (Why This Heist Works)
Macroeconomic trends, COT data, geopolitics, and sentiment align for bullish moves.
Full analysis? Check our bio0 linkk! 👉🔗🌎
⚠️ Trading Alerts (News & Risk Mgmt)
Avoid new trades during high-impact news (volatility = danger).
Use trailing stops to lock profits and dodge sudden reversals.
💥 Boost This Heist!
Hit 👍 (Boost Button) to strengthen our robbery squad!
More heists = More profits—stay tuned for the next steal! 🚀🤑
See you soon, fellow thieves! 🤝🎉

US30 Is on the move up as sellers get low buyers are winning the move pushing the price all the way up as there is a lot of pressure for the price to go all thr way higher to create a w shape as seen in the chart watch out for more buys than sells on this pair goodday

US30 - ShortLooking for the Short on US30 final pull back before we see extension to the upside 45,000.

US30 - Long 43,150Still looking for that 43,150 lets get a test of FVG then on bullish PA above we can plan trade. Stops would go below the order block.

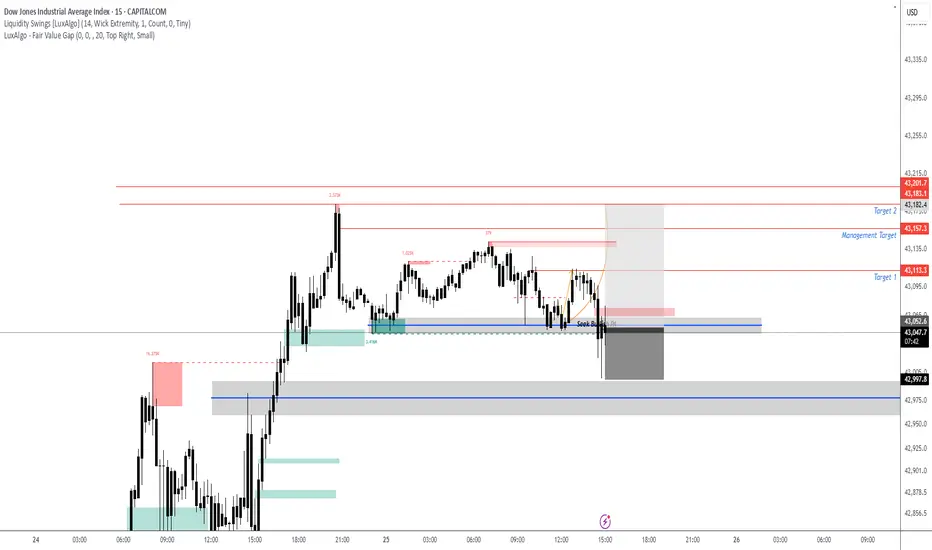
US 30 Potential longUS30 – Wyckoff Spring Setup for NY Session | Intraday Execution Play
Price rallied in the London session with rising volume and structure breaks —
Now we’re anticipating a classic Wyckoff spring scenario just ahead of NY open.
📍 Key Expectations:
Sweep of intraday support around 43,482
Strong buyer reaction (spring confirmation)
Expansion into the 43,600+ zone — possible 1.5R+ continuation
⚠️ Volume buildup + stop placement below prior structure make this zone ripe for a fakeout → reversal.
I’m watching for a quick flush below the line → wick rejection → engulfing confirmation to trigger longs.
This is a trap trade — smart money baits shorts, I’m betting they get squeezed.
🔫 Entry: On confirmation after spring
📉 Invalidation: Below the spring low
🎯 Target: 43,610 zone and trailing after break of 43,570
Let them walk into the trap. Then pull the trigger.

There is a possibility of a decline and a return to the channelIn compressed channels
The price can hardly pass it
Therefore, the downward trend is expected to continue
In this time form.
The details of the deal have been specified.
good luck. BLACKBULL:US30 BLACKBULL:US30

US30 Testing Key Resistance ZonesUS30 has shown renewed bullish momentum with a strong breakout candle above the 42,800.00 resistance. After consolidating for several sessions, price surged upward, now hovering near the 43,800.00 zone—an important resistance level from prior highs.
Support at: 42,800.00 🔽 | 41,900.00 🔽
Resistance at: 43,800.00 🔼 | 44,362.79 🔼 | 45,011.92 🔼
🔎 Bias:
🔼 Bullish: A daily close above 43,800.00 opens the path to test 44,362.79 and potentially 45,011.92.
🔽 Bearish: Rejection from current level and a break below 42,800.00 may trigger a pullback toward 41,900.00.
📛 Disclaimer: This is not financial advice. Trade at your own risk.

DOW JONES: Technical pullback possible but 43,700 target remainsDow Jones is bullish on its 1D technical outlook (RSI = 62.550, MACD = 276.720, ADX = 11.070), extending the bullish wave of the 1 month Channel Up. This is only the second such wave of this pattern and its first pulled back to the 0.5 Fiboancci retracement level after making a +3.75% rise. It is possible to see such a retrace start either now or tomorrow but on the medium term the bullish target on the 1.236 Fibonacci extension is intact (TP = 43,700).
## If you like our free content follow our profile to get more daily ideas. ##
## Comments and likes are greatly appreciated. ##

us30 analysis 25-06-2025There was engulfing in the 4 hour candle and the next candle was a shooting star. So there is a lot of liquidity in the previous engulfing. So the market can come to 22092 to grab this liquidity. However, to take an entry, you should take confirmation of lower time frames like 1 minute, 5 minutes.

US30 - Entries ActiveAs anticipated got the sweep below then break above our area with a U shape formation. Looking to the upside.
US30Given the current COT data, technical indicators, and economic factors, the bias for the US30 is bearish. Traders should monitor upcoming economic reports and Federal Reserve announcements for potential shifts in market sentiment.

Why I’m Sitting Out: US30 Reaches Critical Range HighI’m currently keeping a close eye on the US30, along with the other major indices 🧐. What stands out the most right now is how overextended this rally has become across the board 📈.
The key concern here is that price has now pushed into a previous external range high, sweeping liquidity resting just above that level 💧. This area is a textbook zone where big money often steps in to offload positions — it’s the perfect place for institutions to find willing counterparties after prior accumulation 📍💼.
Given the aggressive nature of this move and how far price has stretched, I’m extremely hesitant to get involved at this stage 🚫. I have zero interest in buying into a market that’s trading at a premium and sitting at a potential reversal zone ⚠️.
The prudent move here is to wait for a retrace, followed by a bullish break in structure before considering re-entry 🔁📈. Sometimes, the most powerful edge in trading is knowing when not to trade — and for me, today is one of those days.
⚠️ This is not financial advice — just sharing my current perspective on the market.

US30: Short setup brewingSitting in a rising wedge with bearish divergence after running into resistance at 43100, the US30 contract finds itself at an interesting juncture on the charts. If it can’t stage a definitive break above these levels, a short setup could be on the cards.
If the contract cannot break and hold above 43100, traders could look to initiate short positions targeting the 200-day moving average initially. If that were to give way, the target could be lengthened to 42000, where wedge support is currently found. A stop above 43100 would protect against reversal.
While MACD has staged a bullish crossover, the momentum signal is countered by what’s still bearish divergence between RSI (14) and price despite the latest bounce.
Given the proximity to month end—a period notorious for window dressing and false signals—the preference would be to wait for another retest and failure at 43100 before initiating the trade.
A de-escalation in trade tensions, lower crude prices and the prospect of a Fed rate cut as soon as July have been tailwinds for the contract over recent days. If it can’t continue to rally in this environment, it questions just what would be required to deliver further upside, just as negative tariff headlines potentially loom.
Good luck!
DS

US30 - Final Push before PullbackPotentially another push to upper levels of supply potentially 43,150-43,200. Can see this retest before seeing a potential pull back based off larger time frame.

Dow Jones breakout targets 44K and beyondThe Dow Jones is finally breaking out, and the chart suggests a 3 to 4 percent move higher is in play. We analyse the key patterns, trade setups, and risks ahead including market seasonality, war headlines, and economic data. Bitcoin, EURUSD, and Nasdaq also showing strength. Is this the start of a bigger rally?
This content is not directed to residents of the EU or UK. Any opinions, news, research, analyses, prices or other information contained on this website is provided as general market commentary and does not constitute investment advice. ThinkMarkets will not accept liability for any loss or damage including, without limitation, to any loss of profit which may arise directly or indirectly from use of or reliance on such information.

US30 on Track for 43KHappy Monday, traders.
Here’s my latest analysis and trade idea for US30. Since April 6th, US30 has been in a strong bull run, breaking above the descending weekly trend line while continuing to print higher highs and higher lows.
Although price action has shown some uncertainty since May 22nd, the bigger picture remains bullish it’s just noise. The trend is intact, and we’re now pushing back above the 50 EMA.
Currently, US30 is forming a wedge between two descending trendlines I’ve marked on the chart. I expect some consolidation within this structure, with a potential pullback into my entry zone.
From there, I’m anticipating another short-term push higher, with a target in the Golden Zone between 43,100 and 43,400 . My entry range is between 42,179 and 42,481 , with a stop-loss just below the current swing low at 41,980.
I expect this move to develop sometime within the next couple weeks.
What do you think will it play out? Let me know in the comments.
PEPPERSTONE:US30

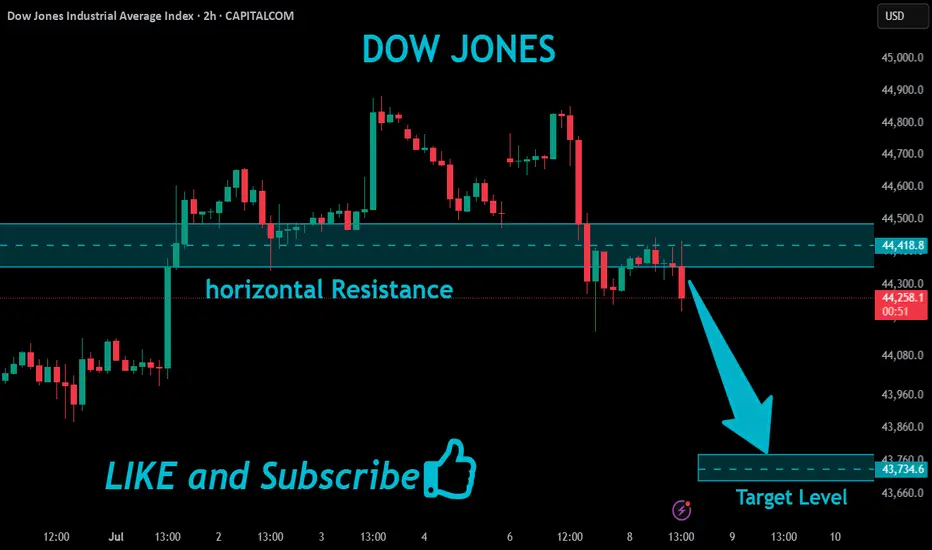
US30 Will Fall!
HI,Traders !
US30 made a retest
Of the key horizontal
Resistance level of 44418.8
From where we are
Already seeing a bearish
Reaction and we will
Be expecting a
Further bearish move down !
Comment and subscribe to help us grow !
DowJones Bullish trend support at 44000Key Support and Resistance Levels
Resistance Level 1: 45000
Resistance Level 2: 45440
Resistance Level 3: 46000
Support Level 1: 44000
Support Level 2: 43700
Support Level 3: 43430
This communication is for informational purposes only and should not be viewed as any form of recommendation as to a particular course of action or as investment advice. It is not intended as an offer or solicitation for the purchase or sale of any financial instrument or as an official confirmation of any transaction. Opinions, estimates and assumptions expressed herein are made as of the date of this communication and are subject to change without notice. This communication has been prepared based upon information, including market prices, data and other information, believed to be reliable; however, Trade Nation does not warrant its completeness or accuracy. All market prices and market data contained in or attached to this communication are indicative and subject to change without notice.

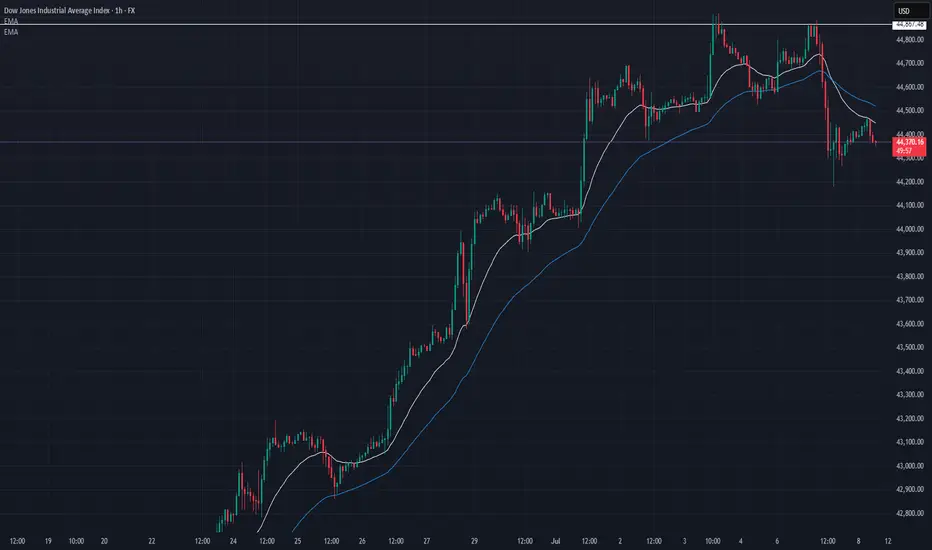
US30 Market Recap – 07/08/2025📍 US30 Market Recap – 07/08/2025
The bulls lost steam, and momentum shifted 📉
After tapping a local high near 44,867, price got rejected hard and broke below both EMAs for the first time in over a week 🚨
🧠 What’s Changed:
Clean lower high formed around 44,800s
EMA structure broken → 20 EMA crossed below the 50 EMA
Price now consolidating under 44,450 zone
📊 Key Levels:
🔼 Resistance: 44,521 → previous EMA zone
🔽 Support: 44,250 → then 44,000
📈 Trade Setup Ideas:
🔻 Short Setup (Primary Bias):
Look for rejection around 44,450–44,500 zone
Entry: Bearish engulfing or break/retest from 15min or 1H
Targets: 44,250 → 44,000
SL: Above 44,600
🔹 Long Setup (Only if Reclaimed):
Bulls must reclaim 44,600 and flip it to support
Watch for strong breakout candle + volume
Target: 44,800 → 44,867
SL: Below 44,450
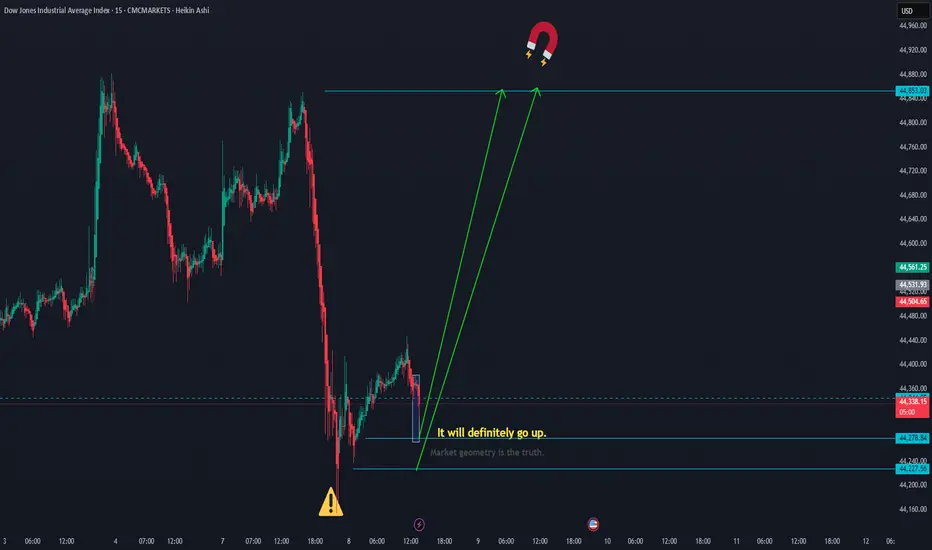
The dowjones should move upThe Dow Jones should move up to 44,853.
The levels 44,278.84 and 44,227.56 are good potential points for a bullish reversal. CMCMARKETS:US30
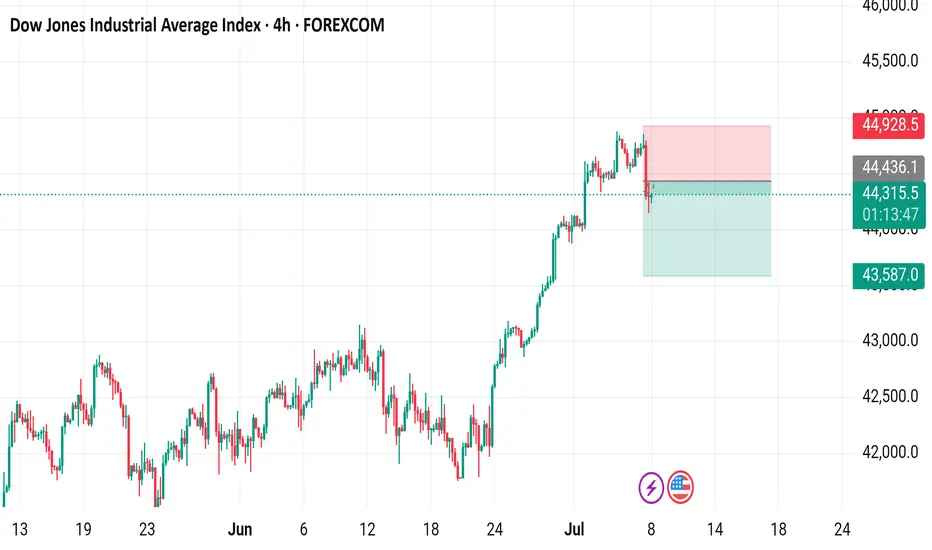
US30 Is Bearish! Sell!
Please, check our technical outlook for US30.
Time Frame: 12h
Current Trend: Bearish
Sentiment: Overbought (based on 7-period RSI)
Forecast: Bearish
The price is testing a key resistance 44,371.8.
Taking into consideration the current market trend & overbought RSI, chances will be high to see a bearish movement to the downside at least to 43,586.3 level.
P.S
Please, note that an oversold/overbought condition can last for a long time, and therefore being oversold/overbought doesn't mean a price rally will come soon, or at all.
Disclosure: I am part of Trade Nation's Influencer program and receive a monthly fee for using their TradingView charts in my analysis.
Like and subscribe and comment my ideas if you enjoy them!

Dow Jones Industrial Average Index - 4h Chart (FOREXCOM)4-hour candlestick chart of the Dow Jones Industrial Average Index (US30) showing the price movement from late June to early July 2025. The current price is 44,314.0, with a slight increase of +23.0 (+0.05%). The chart includes buy and sell signals at 44,316.5 and 44,310.5 respectively, with highlighted resistance and support zones. The index has shown a general upward trend with some volatility over the period.