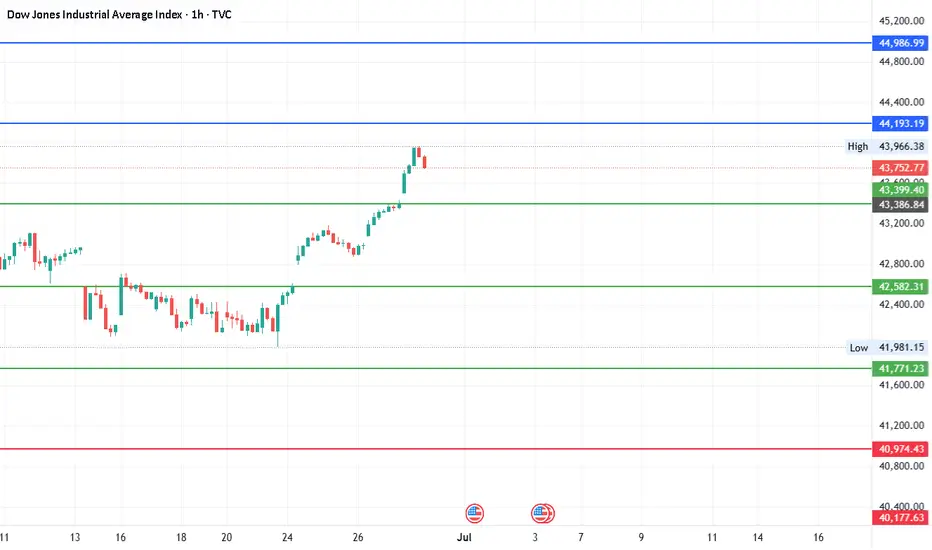
#DJI - Pivot is 42582.31 | Target 38374.12 or 46790.50?Date: 27-06-2025
This is in continuation with the previous post of 8000 points target. We have a new pivot point for the next move.
#Dow Jones Current Price: 43880.
Pivot Point: 42582.31 Support: 41771.23 Resistance: 43399.40
#Dow Jones Upside Targets:
Target 1: 44193.19
Target 2: 44986.99
Target 3: 45888.75
Target 4: 46790.50
#Dow Jones Downside Targets:
Target 1: 40974.43
Target 2: 40177.63
Target 3: 39275.875
Target 4: 38374.12
DOW trade ideas
US30: Bears Are Winning! Short!
My dear friends,
Today we will analyse US30 together☺️
The market is at an inflection zone and price has now reached an area around 44,041.6 where previous reversals or breakouts have occurred.And a price reaction that we are seeing on multiple timeframes here could signal the next move down so we can enter on confirmation, and target the next key level of 44,013.0..Stop-loss is recommended beyond the inflection zone.
❤️Sending you lots of Love and Hugs❤️

US30 Technical Outlook – 07/01/2025📍 US30 Technical Outlook – 07/01/2025
Monster rally continues! 🚀 Price exploded off the 42,100–42,200 demand zone and has now pushed deep into the 44,150–44,250 major resistance area.
🧠 Key Observations:
Trend remains extremely bullish ✅
Price is consolidating just under 44,250 resistance 📍
EMAs (43,894 and 44,052) still showing strong upward momentum ✅
📊 Key Price Zones:
🔼 Major Resistance: 44,150 → 44,250 → 44,400
🔽 Key Support: 43,800 → 43,600 → 43,400
📈 Trade Setup Ideas:
🔹 Long Bias:
Pullbacks into 43,800 → 43,600 support
Look for bullish continuation setups if price stays above EMAs
Target: Breakout toward 44,250 → 44,400
🔻 Short Bias (Countertrend / Caution):
Only look for short scalps if price gives clear rejection (wicks, bearish engulfing, etc) from 44,250–44,400 zone
Possible downside target: 43,800–43,600

Look into it{
"alerts": [
{
"name": "US30 Bull Break",
"condition": {
"symbol": "US30",
"operator": "crossing",
"value": 43950
},
"message": "📈 US30 Breakout Alert: Price crossed above 43,950. Watch for BUY setup targeting 44,100.",
"actions":
},
{
"name": "US30 Bear Rejection",
"condition": {
"symbol": "US30",
"operator": "crossing_down",
"value": 43800
},
"message": "📉 US30 Bearish Rejection: Price fell below 43,800. Watch for SELL setup toward 43,400 OB.",
"actions":
}
]
}
Weekly Forex Outlook Sun.June.29.2025 - Fri.July.4.2025Like and Comments would be appreciated :D Not Financial Advice, Just my outlook/opinion

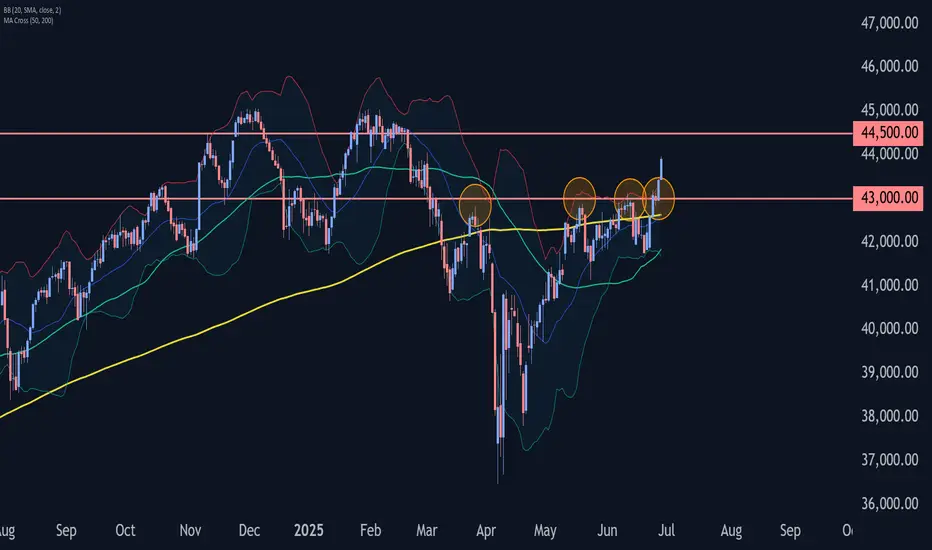
Dow Jones Wave Analysis – 27 June 2025
- Dow Jones broke pivotal resistance level 43000.00
- Likely to rise to resistance level 44500.00
Dow Jones index recently broke above the pivotal resistance level 43000.00 (which has been reversing the price from the end of March, as can be seen from the daily Dow Jones chart below).
The breakout of the resistance level 43000.00 accelerated the active impulse wave 3 of the intermediate impulse wave (C) from the end of May.
Dow Jones index can be expected to rise to the next resistance level 44500.00, which is the target price for the completion of the active impulse wave (C).
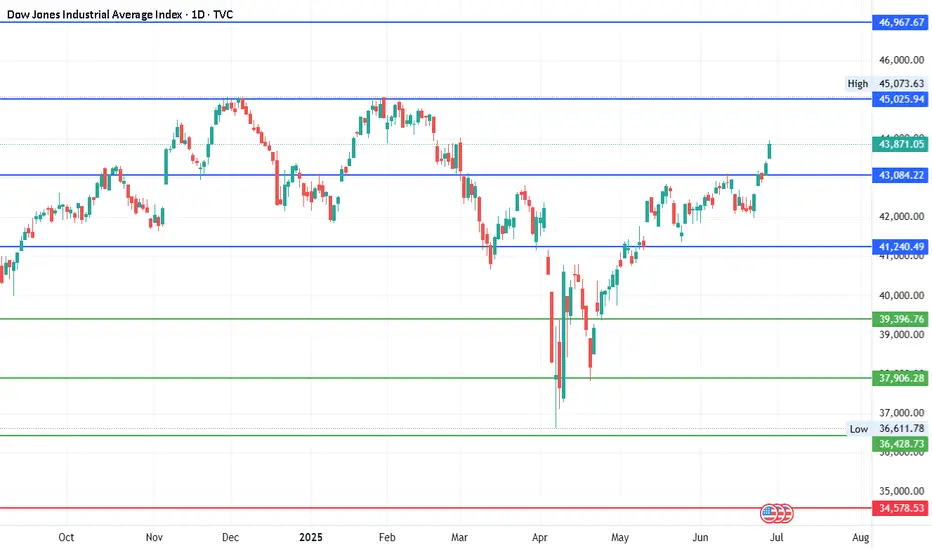
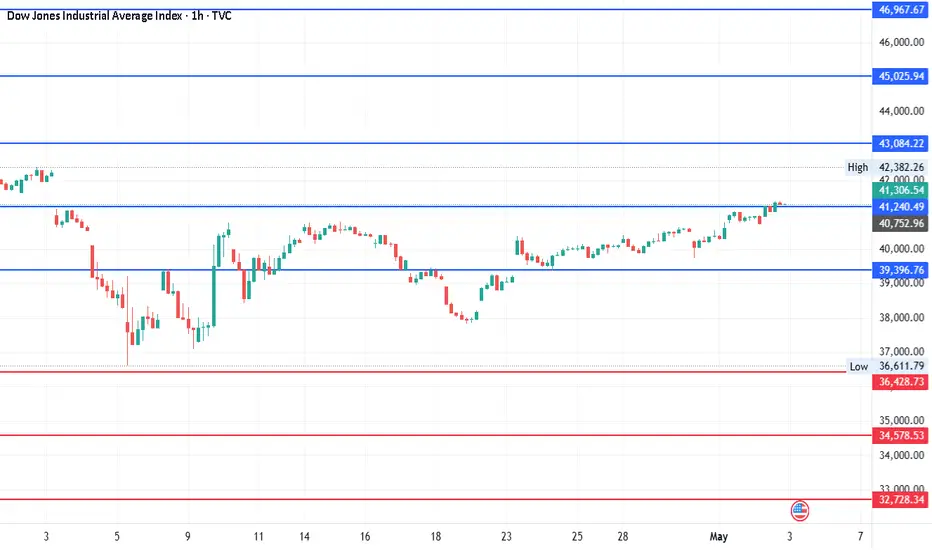
#DJI - 5000 Pts already moved out of 8000 points..Date: 27-06-2025
#DJI - 5000 Pts already moved out of 8000 points as posted on 22nd April. Another 3000 points to cover. we have different pivot for the next level up and it will be shared soon.
Old levels are as follows.
#DJI Upside Targets: 41240.49, 43084.22, 45025.94 and 46967.67
#DJI Downside Targets: 34578.53, 32728.34, 30786.61 and 28844.88
Current price is around 43,870 at the time of this post.
DJI - 2000 pts already moved out of 8000 pts since last posted?It has already moved around 2000 points since last posted on 22nd April. Expecting around 8000 points moved as per mentioned earlier and the levels are still the same. Introduced additional levels for the better understanding. So, another 6000 points move pending before any reasonable correction? let's see.
Upside: 41240.49, 43084.22, 45025.94 and 46967.67
Downside: 34578.53, 32728.34, 30786.61 and 28844.88
US30 POTENTIAL SETUPUS30 Analysis
Fundamental Analysis:
The US30 (Dow Jones Industrial Average) continues to face turbulence as global and domestic factors interplay. Recently, several key macroeconomic and geopolitical developments have influenced sentiment:
FOMC Outlook: The Federal Reserve’s decision to pause interest rate hikes amidst easing inflation suggests a more dovish stance. However, labor market resilience and retail sales indicate lingering strength in consumer demand.
Geopolitical Risk – Iran-Israel Conflict: The renewed tensions in the Middle East—especially between Iran and Israel—have heightened risk sentiment. Oil prices are sensitive to the conflict, indirectly pressuring inflation and causing volatility in equity markets.
US Economic Indicators:
CPI (Consumer Price Index): Showed moderate deceleration, aligning with the Fed’s inflation target.
Unemployment Rate: Remains low, strengthening confidence in the soft-landing narrative.
Manufacturing and PMI Data: Indicate a slowdown, showing a mild contraction phase in industrial activity.
These mixed signals are feeding into a cautious yet opportunity-laden market environment for indices like US30.
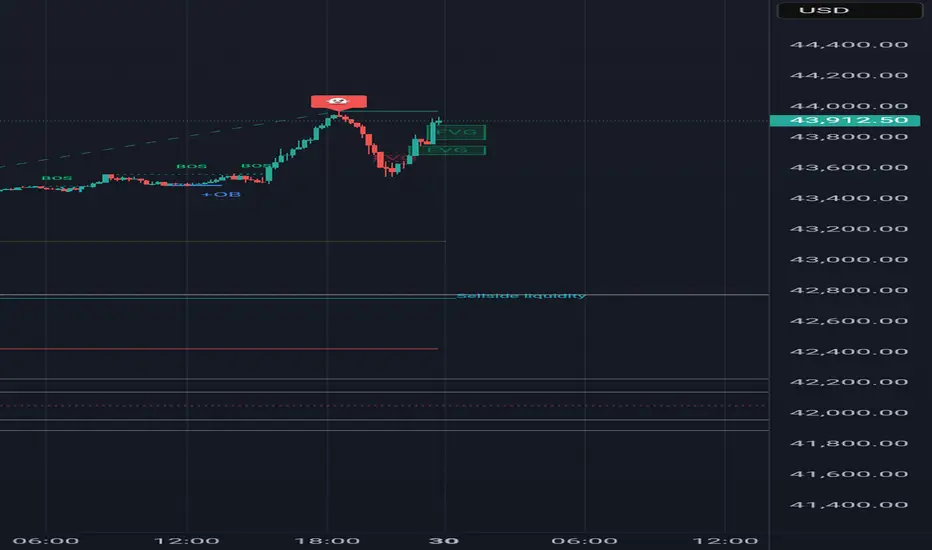
Technical Analysis (SMC - Smart Money Concepts):
Current Market Structure:
The price recently broke structure (BOS) to the upside after a series of higher lows and equal highs.
It’s now in a pullback phase, showing a classic inducement pattern where early liquidity is grabbed below recent equal lows.
Key Zones:
Buy Zone: Marked between 41,460 to 41,357 (H1 FVG) , which lies just above the protected low at 41,150.
A sweep of equal lows followed by confirmation (e.g., BOS on lower timeframe like H4) would validate a long entry.
Risk Management:
Stop-loss: Below 41,150, signaling bearish intent if broken (CHOCH – Change of Character).
Take-profit Target: Upwards toward 42,911, aligning with previous highs and order block inefficiencies.
Bearish Scenario: A daily closure below 41,150 would invalidate the bullish setup and suggest a deeper retracement toward the next key support near 40,636.
NOTE: Not a financial advice only for educational purpose

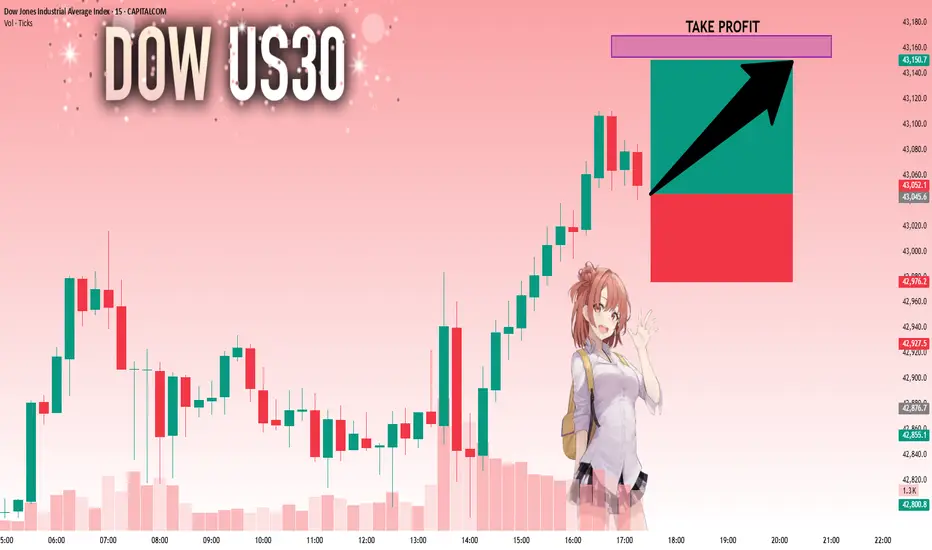
#US30 Buy 43575.4#US30 Buy 43575.4
SL 43515.4
TP 43595.4
TP 43675.4
TP 43815.4
Trade at your own risk
Protect your capital
The Wizard 🧙♂️ SWFX

DOW JONES Will Keep Growing! Buy!
Hello,Traders!
US30 is trading in an
Uptrend and the index broke
The key horizontal level
Around 43,200 and the
Breakout is confirmed so
We are bullish biased
And we will be expecting a
Further bullish move up
Buy!
Comment and subscribe to help us grow!
Check out other forecasts below too!
Disclosure: I am part of Trade Nation's Influencer program and receive a monthly fee for using their TradingView charts in my analysis.

Dow Jones (US30) — Bullish Momentum, But a Retest AheadUS30 — Preparing for a Retest Before Higher Push
Subtitle: Technical Outlook — 27 June 2025
📈 Current Market Condition
The US30 index has shown strong bullish momentum, breaking above prior resistance around 43,000 and extending towards 43,500. Price is currently above both the 50 EMA (blue) and 200 EMA (red), reflecting a bullish structure. However, the Stochastic indicator signals overbought conditions, suggesting the index may be due for a pullback or consolidation before attempting to break higher into the 44,500–44,750 resistance zone.
🔑 Key Technical Highlights
Structure: Price broke above consolidation zone 42,750–43,000, retesting higher levels.
50 EMA (blue): Positioned near 42,750, acting as dynamic support.
200 EMA (red): Below at 42,200, major trend support.
Stochastic: Overbought — risk of a short-term correction or sideways move before continuation.
Resistance: Major resistance at 44,500–44,750.
Support: Immediate support at 43,000–43,250, deeper at 42,500.
📝 Trade Plan
Bullish Breakout (Long)
Trigger: Retest and hold of 43,000–43,250 zone with bullish confirmation (e.g. bullish engulfing, hammer).
Target: 44,500 / 44,75
Stop-loss: Below 42,900
Bearish Rejection (Short)
Trigger: Strong rejection from 44,500 with bearish reversal pattern.
Target: 43,250 / 42,750
Stop-loss: Above 44,700
Dip Buy
Trigger: Price tests 42,750 (50 EMA) and shows bullish reversal.
Target: 43,500 / 44,500
Stop-loss: Below 42,500
⚠️ Risk Management Note
US30 is trading in extended conditions, so chasing price here carries risk of getting caught in a pullback. Use staggered entries and adjust position size relative to volatility. Watch out for upcoming macroeconomic releases that could trigger sharp moves.
If you found this analysis valuable, kindly consider boosting and following for more updates.
Disclaimer: This content is intended for educational purposes only and does not constitute financial advice.

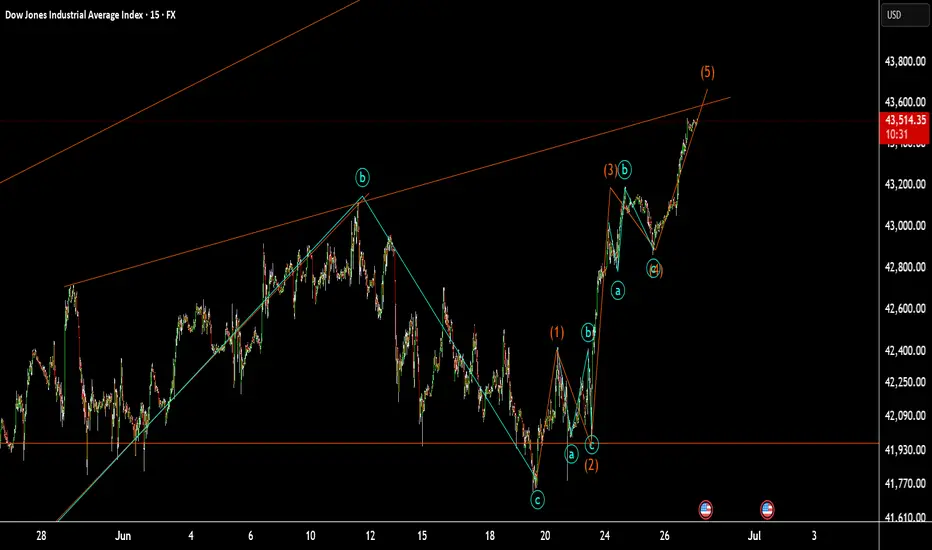
US30 at small resistanceUS30 at small resistance:
as I counter these wave we are in wave 5. it might be goes up to the maim trend Line in previous analysis.
The Dow Jones index is at the channel’s ceiling.The Dow Jones index, upon reaching the channel’s ceiling, shows weakness and lacks the ability to break out from a price action and candlestick perspective. I expect the price to reach near the channel’s floor in a downward trend.
17:30
BLACKBULL:US30

DowJones bullish breakout supported at 42240Key Support and Resistance Levels
Resistance Level 1: 43200
Resistance Level 2: 43544
Resistance Level 3: 43900
Support Level 1: 42240
Support Level 2: 41740
Support Level 3: 41280
This communication is for informational purposes only and should not be viewed as any form of recommendation as to a particular course of action or as investment advice. It is not intended as an offer or solicitation for the purchase or sale of any financial instrument or as an official confirmation of any transaction. Opinions, estimates and assumptions expressed herein are made as of the date of this communication and are subject to change without notice. This communication has been prepared based upon information, including market prices, data and other information, believed to be reliable; however, Trade Nation does not warrant its completeness or accuracy. All market prices and market data contained in or attached to this communication are indicative and subject to change without notice.

Dow Jones Industrial Average Index - 4h Chart (FOREXCOM)4-hour chart of the Dow Jones Industrial Average Index (US30) shows the price movement from late June to early July 2025. The current value is 43,057.7, reflecting a slight increase of +78.0 (+0.18%). The chart highlights key price levels, including a resistance zone around 43,324.1 and a support zone near 42,875.8, with recent price action showing a breakout above the resistance level.


Dow Jones Entry - Riskier this one trade keep the SL way tighter than the other, guarantees a much better RRR but it is more risky

Dow Jones Entryprice already was reacting off of a Order Block formed on the one hour, so i got down to the m5 and started searching for an entry, unluckily i lost the good one but there is still the possibility to do something good and safe like this.

US30 Technical Outlook – 06/25/2025📍 US30 Technical Outlook – 06/25/2025
Big move! 🚀 Price broke out of the 42,054–42,100 consolidation and rallied aggressively into the key 43,100–43,150 resistance zone.
🧠 Key Observations:
Clean bullish breakout above 42,100 ✅
Price now sitting at 43,120–43,150 supply 🛑
EMAs sharply turned bullish (42,808 and 43,038 levels)
📊 Key Price Zones:
🔼 Major Resistance: 43,150 → 43,300
🔽 Support: 42,800 → 42,600 → 42,100
📈 Trade Setup Ideas:
🔹 Long Bias:
Pullback into 42,800–42,600 support
→ Look for bullish structure & continuation signals
→ Target: 43,150 → 43,300
🔻 Short Bias:
Look for strong rejection candles at 43,150–43,300
→ Intraday scalp short back toward 42,800
→ Break below 42,800 could target 42,600 or even 42,100
‼️ Momentum is clearly bullish for now, but this is a major supply zone so caution on chasing late longs.

US30: The Market Is Looking Up! Long!
My dear friends,
Today we will analyse US30 together☺️
The price is near a wide key level
and the pair is approaching a significant decision level of 43,045.6 Therefore, a strong bullish reaction here could determine the next move up.We will watch for a confirmation candle, and then target the next key level of 43,152.9.Recommend Stop-loss is beyond the current level.
❤️Sending you lots of Love and Hugs❤️
short within and without rangesbasicly i dont know what will happen
do i predict?
yes
do i react?
maybe

DowJones INTRADAY key trading levelsKey Support and Resistance Levels
Resistance Level 1: 43200
Resistance Level 2: 43550
Resistance Level 3: 43900
Support Level 1: 42240
Support Level 2: 41740
Support Level 3: 41280
This communication is for informational purposes only and should not be viewed as any form of recommendation as to a particular course of action or as investment advice. It is not intended as an offer or solicitation for the purchase or sale of any financial instrument or as an official confirmation of any transaction. Opinions, estimates and assumptions expressed herein are made as of the date of this communication and are subject to change without notice. This communication has been prepared based upon information, including market prices, data and other information, believed to be reliable; however, Trade Nation does not warrant its completeness or accuracy. All market prices and market data contained in or attached to this communication are indicative and subject to change without notice.
