Hong Kong Stock Index (The rebound is in the making)Hong Kong Stock Index (14 Nov 2022)
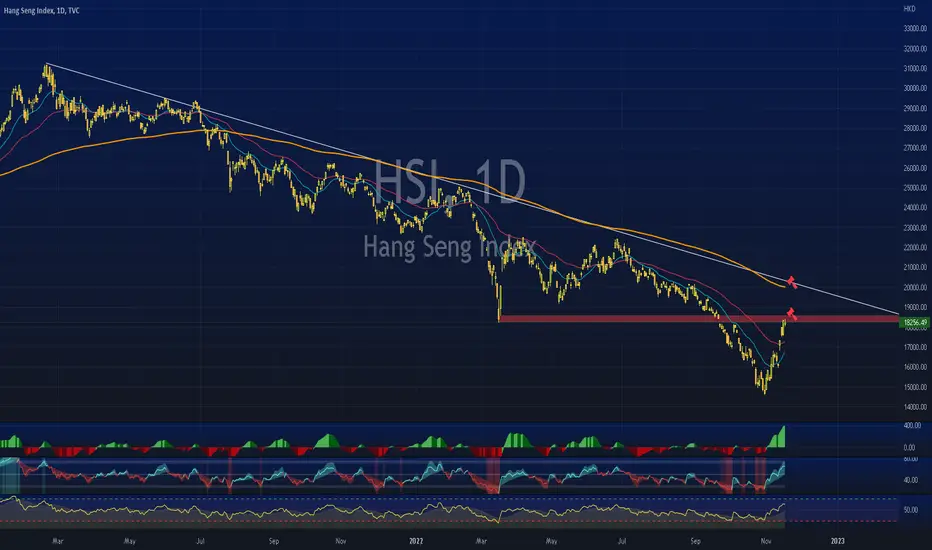
HK index is in the pull back phase and I reckon it shall continue for quite some time.
18,000 is a good strong resistant but the pull back down shall be mild.
The nearest strong support is 16,000 and it shall go higher and higher again.
19,000~20,000 will be the strong resistant region. Then, we will talk about what's next.
Legal Risk Disclosure:
Trading foreign exchange or CFD on margin carries a high level of risk, and may not be suitable for all investors.
The high degree of leverage can work against you as well as for you. Before deciding to trade foreign exchange you should carefully consider your investment objectives, level of experience and risk appetite.
The possibility exists that you could sustain a loss of some or all of your initial investment and therefore you should not invest money that you cannot afford to lose.
You should be aware of all the risks associated with foreign exchange trading, and seek advice from an independent financial advisor.
DISCLAIMER:
Any opinions, news, research, analyses, prices or other information discussed in this presentation or linked to from this presentation are provided as general market commentary and do not constitute investment advice.
Sonicr Mastery Team does not accept liability for any loss or damage, including without limitation to, any loss of profit, which may arise directly or indirectly from use of or reliance on such information.
HANGSENG trade ideas

HSI heading SouthHang Seng Index rebound should have finished around 19500. Stochastic is overbought and the rebound is still below 60 week moving average
which means the downtrend have not been changed. Property market, and the lack of factory order in China, should still hit Hong Kong economy
Next year, most of the Economy will fall into recession, even Taiwan Central Bank is expected major economies will fall into recession in 2023https://www.cbc.gov.tw/tw/cp-302-156071-41d1b-1.html

HSI - Bull signal is hereComment :
1) TrendX+ indicator - wandering below red trend line, still mid-term downtrend
2) DDX+ indicator - Bull signal shows up, looking forward a short-term long position
3) MCDX+ indicator - weak banker bar (red) cross-up MA10 line, while retailer bar (turquoise) has occupy more than 50%
Support & Resistance :
R : Resistance line A
S : Support line B
DISCLAIMER:
Analysis above SOLELY for case study purpose, not a PROFESSIONAL ADVISE. This analysis does not provide any trading advise and buy or sell. Trade at your own risk. Trade only after you have acknowledged and accepted the risks involved.

HSI is looking for reboundIn the pass, I have been bearish for HSI for sometimes, at this moment, HSI might have some rebound before break below the supportive line
aim at rebound targeting 18500-19500

Buying HS50 at current support.HS50 - 22h expiry - We look to Buy at 17450 (stop at 17115)
Buying pressure from 17289 resulted in prices rejecting the dip.
This is positive for sentiment and the uptrend has potential to return.
We therefore, prefer to fade into the dip with a tight stop in anticipation of a move back higher.
Further upside is expected although we prefer to buy into dips close to the 17450 level.
Our profit targets will be 18395 and 18485
Resistance: 18540 / 19480 / 20635
Support: 17605 / 16450 / 14580
Disclaimer – Saxo Bank Group.
Please be reminded – you alone are responsible for your trading – both gains and losses. There is a very high degree of risk involved in trading. The technical analysis , like any and all indicators, strategies, columns, articles and other features accessible on/though this site (including those from Signal Centre) are for informational purposes only and should not be construed as investment advice by you. Such technical analysis are believed to be obtained from sources believed to be reliable, but not warrant their respective completeness or accuracy, or warrant any results from the use of the information. Your use of the technical analysis , as would also your use of any and all mentioned indicators, strategies, columns, articles and all other features, is entirely at your own risk and it is your sole responsibility to evaluate the accuracy, completeness and usefulness (including suitability) of the information. You should assess the risk of any trade with your financial adviser and make your own independent decision(s) regarding any tradable products which may be the subject matter of the technical analysis or any of the said indicators, strategies, columns, articles and all other features.
Please also be reminded that if despite the above, any of the said technical analysis (or any of the said indicators, strategies, columns, articles and other features accessible on/through this site) is found to be advisory or a recommendation; and not merely informational in nature, the same is in any event provided with the intention of being for general circulation and availability only. As such it is not intended to and does not form part of any offer or recommendation directed at you specifically, or have any regard to the investment objectives, financial situation or needs of yourself or any other specific person. Before committing to a trade or investment therefore, please seek advice from a financial or other professional adviser regarding the suitability of the product for you and (where available) read the relevant product offer/description documents, including the risk disclosures. If you do not wish to seek such financial advice, please still exercise your mind and consider carefully whether the product is suitable for you because you alone remain responsible for your trading – both gains and losses.

HSI/SPY - time to be aware of ChinaKeep in mind this is a monthly chart, so we're looking at years and decades here.
This ratio chart of the HANG SENG INDEX divided by SPY is warning of a coming rush by investors into the Chinese markets. The China C wave I posted about may be done (see post attached below). If this falling wedge breaks out we could see a monumental shift towards the Chinese markets in the coming years, possibly spurred by their willingness to relax Covid controls and/or get better vaccines. This is a market mostly ignored by retail investors and that may change soon.
The monthly RSI has sharp bullish divergence. The monthly 18ma is sitting at 51.3 as I type today, getting over and holding that on a monthly close would be very bullish for HSI.
Good luck!

HSI reboundHSI on the weekly chart showed the TD 9 and force 9, the downtrend was in the short term exhausted range, refer to daily chart the energy indicator showed the bottom divergence. HIS index started to rebound from this point.
After the rebound showed the Force 9 at top, the momentum of rebound was used out, so the current market showed the retracement.
Yesterday HSI index show a bottom fractal with gap up, and it is on above green line now, potential the rebound will be continue, to reach the red band resistance level.

HSI: is about 40% upHangseng looks bullish.
There are 2 bull patterns just ended, so it looks about 40% up at least.

HSI bull trap by Cosmic GravityBoth indicators gave mixed signals on the Hang Seng Index 3-day chart so we looked at a higher 1W timeframe for more context. The points outlined in the charts suggest a bearish move and the 3-day chart target is approximated by extrapolating the support channel's bottom. The stop is placed slightly above the support channel (currently the next resistance).

Prepare for 22% RALLY in HSI4th wave pullback(upside) is started in Hongkong index from 1st Nov'22
wait for correction until 14th of Nov, provided 15880 should be protected (SL)
After B wave correction ,if limited to 15880 then buy a ticket after 15th Nov for your upward journey till Jan23

Hang Seng Index under fire!!Watching the Hand Seng underlying index in coming sessions...could be a good selloff on the cards...price action looking weak and there is a lot of buyers that could be put under pressure to unwind long positions!!

Joe Gun2Head Trade - Top pattern on HK50Trade Idea: Selling HK50
Reasoning: Top pattern on HK50
Entry Level: 17641
Take Profit Level: 16980
Stop Loss: 17796
Risk/Reward: 4.25:1
Disclaimer – Signal Centre. Please be reminded – you alone are responsible for your trading – both gains and losses. There is a very high degree of risk involved in trading. The technical analysis , like all indicators, strategies, columns, articles and other features accessible on/though this site is for informational purposes only and should not be construed as investment advice by you. Your use of the technical analysis , as would also your use of all mentioned indicators, strategies, columns, articles and all other features, is entirely at your own risk and it is your sole responsibility to evaluate the accuracy, completeness and usefulness (including suitability) of the information. You should assess the risk of any trade with your financial adviser and make your own independent decision(s) regarding any tradable products which may be the subject matter of the technical analysis or any of the said indicators, strategies, columns, articles and all other features.

HK33 to extend gains?HS50 - 22h expiry - We look to Buy a break of 18465 (stop at 17985)
Buying pressure from 17703 resulted in prices rejecting the dip.
The current move higher is expected to continue.
Previous resistance located at 18470.
Further upside is expected, however, due to the strong resistance above we prefer to buy a break of 18465, which will confirm the bullish sentiment.
Our profit targets will be 19835 and 20635
Resistance: 18540 / 19480 / 20635
Support: 17605 / 16450 / 14580
Risk Disclaimer
The trade ideas beyond this page are for informational purposes only and do not constitute investment advice or a solicitation to trade. This information is provided by Signal Centre, a third-party unaffiliated with OANDA, and is intended for general circulation only. OANDA does not guarantee the accuracy of this information and assumes no responsibilities for the information provided by the third party. The information does not take into account the specific investment objectives, financial situation, or particular needs of any particular person. You should take into account your specific investment objectives, financial situation, and particular needs before making a commitment to trade, including seeking advice from an independent financial adviser regarding the suitability of the investment, under a separate engagement, as you deem fit.
You accept that you assume all risks in independently viewing the contents and selecting a chosen strategy.
Where the research is distributed in Singapore to a person who is not an Accredited Investor, Expert Investor or an Institutional Investor, Oanda Asia Pacific Pte Ltd (“OAP“) accepts legal responsibility for the contents of the report to such persons only to the extent required by law. Singapore customers should contact OAP at 6579 8289 for matters arising from, or in connection with, the information/research distributed.


$HSI -Poised for Correction ? Hang Seng Index has almost come due for a correction after closing the other day up +4%
It performed great over CCP's taking down their Covid's restrictions
Restrictions not lifted off upon people of China ever since lockdowns started taking place on 2020 Pandemic's outbreak.
Xi's dictatorship leadership and his third term election won ,may be catastrophic and detrimental for China's future, or, it can be great for his nation's expansion over Geo Political spectrum.
On the day of his third term election, Xi's strategic moves sent a clear message to the other world's superpowers, as he removed China's former-president Hu Jintao from CCP's political congress.
Symbolizing a lot how much power and influence Xi alone has upon his nation.
Wether China prospers or fails as a Nation as a result of the decisions made by a single madmen in power is yet to be seen.
Depends a lot on US's stance regarding China-Taiwan geo-political situation, which Biden on his last meeting with Xi just recently, aimed to avoid it's conflicts
Will Xi overtake Taiwan over his third term election time-span ?
Speculating it may be the correct timing, on a weakening US as a global superpower from the Pandemic up to date.
It's correct timing over other geo-political risks included with the likes of Russia-Ukraine.
Seems like past 2020, everything has been going badly for the world, turning from bad to worse.
The question is, will things get worse before they get better ?
TRADE SAFE
Note that this is not Financial Advice !
Please do your own research before partaking on any trading activities based upon this idea.
JICPT|HSI rebounded from bottom, yet to terminate the trendHello everyone. It's been a while since I published trade idea last time. Recently, Hong Kong market and mainland got my attention, not because I have exposure to those market, but the turning point is forming or was formed.
There is no doubt that HSI is cheap. It didn't benefit too much from the QE policies implemented by central banks around the world. It surprisingly recorded losses for two consecutive years in 2020 and 2021 whilst peers soared into the sky.
On the monthly chart, I drew an uptrend line which the index clearly penetrated. However, the zone with a range of 11355 to 13755 looked pretty solid. The possibility of closing below the zone is very very low.
On the weekly chart, I added Hong Kong foreign reserve line. It is also clear that the correlation between the index and the reserve is positive. Fed hiked the rates aggressively this year. It cost HK government a lot of reserve to maintain its currency HKD against USD in the narrow range of 7.75 to 7.85. No wonder, the index dropped dramatically this year.
However, things started to changed with news of no quarantine period required for cross-border travel to HK. In addition, the recent relaxed Covid-19 restrictions in mainland China also gave the market a boost.
On the daily chart, we can see that the downtrend line is yet to be broken at the level around 20000. I'm expecting a battle between seller and buyers once it reaches the key level.
In my view, the potential room to the downside is limited. HSI is really attractive for me to allocation some money to capture the upside move.
What do you think? Give me a like if you're with me.

Buying HK50 at key support.HS50 - 21h expiry - We look to Buy at 16461 (stop at 16249)
Although the bulls are in control, the stalling positive momentum indicates a turnaround is possible.
We therefore, prefer to fade into the dip with a tight stop in anticipation of a move back higher.
Further upside is expected although we prefer to buy into dips close to the 16400 level.
Our profit targets will be 16969 and 17169
Resistance: 18540 / 20635 / 22510
Support: 16450 / 14580 / 14000
Disclaimer – Saxo Bank Group.
Please be reminded – you alone are responsible for your trading – both gains and losses. There is a very high degree of risk involved in trading. The technical analysis , like any and all indicators, strategies, columns, articles and other features accessible on/though this site (including those from Signal Centre) are for informational purposes only and should not be construed as investment advice by you. Such technical analysis are believed to be obtained from sources believed to be reliable, but not warrant their respective completeness or accuracy, or warrant any results from the use of the information. Your use of the technical analysis , as would also your use of any and all mentioned indicators, strategies, columns, articles and all other features, is entirely at your own risk and it is your sole responsibility to evaluate the accuracy, completeness and usefulness (including suitability) of the information. You should assess the risk of any trade with your financial adviser and make your own independent decision(s) regarding any tradable products which may be the subject matter of the technical analysis or any of the said indicators, strategies, columns, articles and all other features.
Please also be reminded that if despite the above, any of the said technical analysis (or any of the said indicators, strategies, columns, articles and other features accessible on/through this site) is found to be advisory or a recommendation; and not merely informational in nature, the same is in any event provided with the intention of being for general circulation and availability only. As such it is not intended to and does not form part of any offer or recommendation directed at you specifically, or have any regard to the investment objectives, financial situation or needs of yourself or any other specific person. Before committing to a trade or investment therefore, please seek advice from a financial or other professional adviser regarding the suitability of the product for you and (where available) read the relevant product offer/description documents, including the risk disclosures. If you do not wish to seek such financial advice, please still exercise your mind and consider carefully whether the product is suitable for you because you alone remain responsible for your trading – both gains and losses.

HSI General Chart AnalysisHSI has been flying on news of lowered COVID precautions and a lesser economic slowdown as previously expected. Where I see it going:

Hong Kong 50 Looking Exhausted on the 4 HourWe have Bearish 3 Drives with an Exhausted RSI on the 50 Hour HK-50 Chart I think it willatleast return to Last Week's Low.

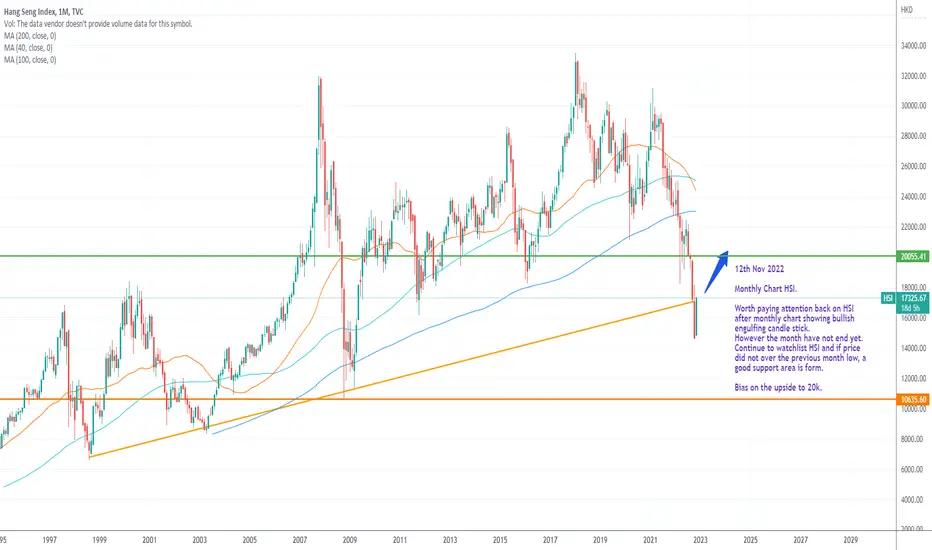
HSI bias upside with 20k resistance12th Nov 2022
Monthly Chart HSI.
Worth paying attention back on HSI after monthly chart showing bullish engulfing candle stick.
However the month have not end yet. Continue to watchlist HSI and if price did not over the previous month low, a good support area is form.
Bias on the upside to 20k.
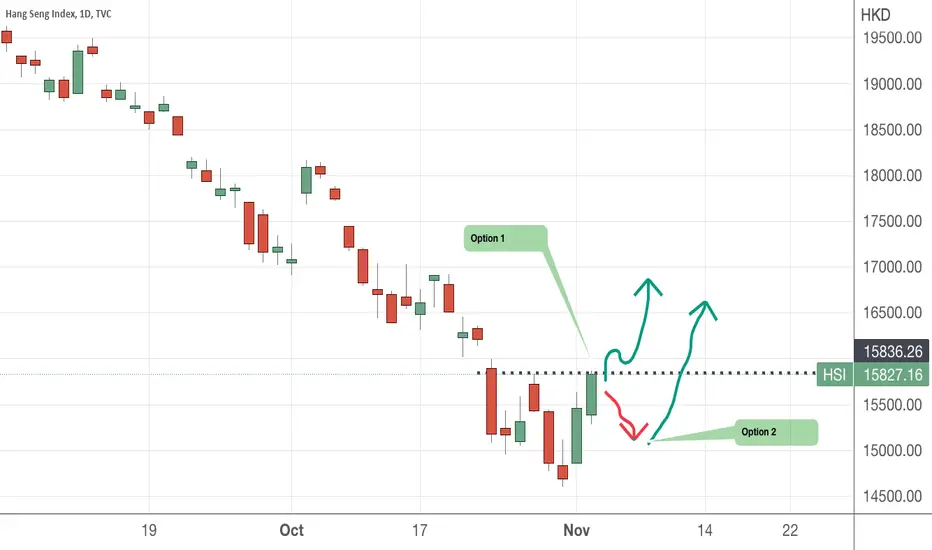
I see two possible options for HSI moving forwardRead latest news article here
From drawing talent pool to local executives getting on overseas trip to market Hong Kong, are these strategies sufficient to boost the market up ?
The chart shows a nice rebound after a very long period of downtrend. It is difficult to say if this is the bottom , simply judging from 2 green candles. It could be a reversal pattern only on hindsight as we look back on this chart months later......
Until more information is released on how to help support the HK market (direction from Central Government in China), I speculate two possible options for the price direction to go. Option 1, invariably is what we want to see, a continuation in the rally , breaking above the resistance level at 15,836 and goes up further.
The second option which is also possible is a retracement back to 15087 and then rally up.
HK50 is the synonym of godzilla a.k.a disasterInsight:
----------
- China reiterate covid lockdown
- Very red export/import data (low economic activity)
- Possible incoming bad datas from China, including retail sales and inflation
- PBoC keep fixes yuan vs USD higher

HK50 ShortIt's rising above 20 MA after long time dropping.
#Short Term
- Resistance : 16915, 17000
- Support : 16529.7, 16106(20 MA, D)
#Long Term
- Resistance : 50 MA/EMA, D(BB UP)
