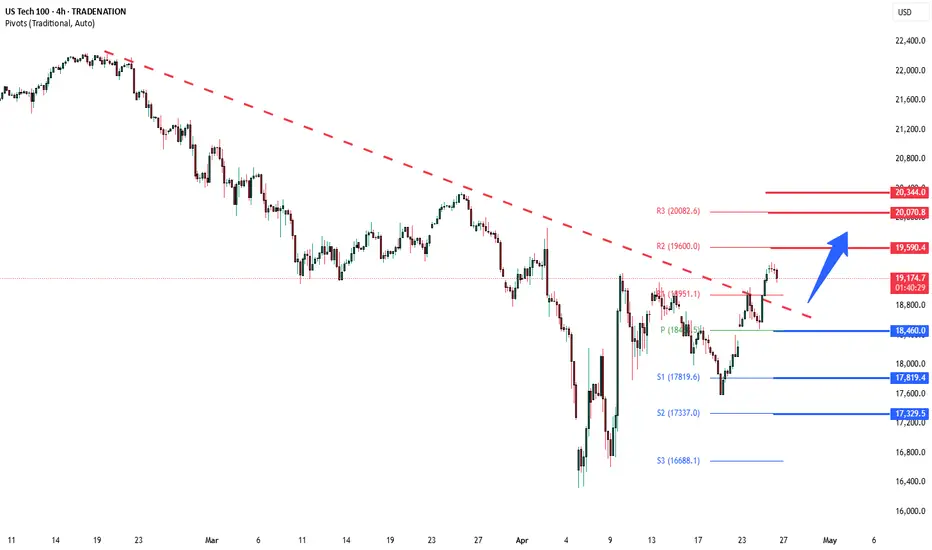
NSDQ100 INTRADAY trend change supported at 18950 Key Support and Resistance Levels
Resistance Level 1: 19590
Resistance Level 2: 20070
Resistance Level 3: 20344
Support Level 1: 18460
Support Level 2: 17820
Support Level 3: 17330
This communication is for informational purposes only and should not be viewed as any form of recommendation as to a particular course of action or as investment advice. It is not intended as an offer or solicitation for the purchase or sale of any financial instrument or as an official confirmation of any transaction. Opinions, estimates and assumptions expressed herein are made as of the date of this communication and are subject to change without notice. This communication has been prepared based upon information, including market prices, data and other information, believed to be reliable; however, Trade Nation does not warrant its completeness or accuracy. All market prices and market data contained in or attached to this communication are indicative and subject to change without notice.
NASDAQ.USD.1.IEN trade ideas
Will Nasdaq Test Liquidity at 17,800 Before an Upside Move?NASDAQ is experiencing bearish slow down at the support level for the past 3 weeks. A re-test of the recent low looks imminent. and if price could be rejected after clearing H4 liquidity at 17,800, then we could see a sharp upside move.
Key risks: Fed commentary, major tech earnings, and geopolitical headlines.
N.B!
- NASDAQ price might not follow the drawn lines . Actual price movements may likely differ from the forecast.
- Let emotions and sentiments work for you
- ALWAYS Use Proper Risk Management In Your Trades
#nq!
#nasdaq

Trade Update Based on NASDAQ PredictionsThis is an update on my trade idea that I posted a few hours ago for NASDAQ. Made over $6,912 on all positions!

X2: NQ/US100/NAS100 Short - Day Trades 1:2 RRX2:
Risking 1% to make 2%
NAS100, US100, NQ, NASDAQ Short for day trade, with my back testing of this strategy, it hits multiple possible take profits, manage your position accordingly.
Risking 1% to make 2%
Use proper risk management
Looks like good trade.
Lets monitor.
Use proper risk management.
Disclaimer: only idea, not advice

NAS100 Trendline Break: Short-Term Rally or Another Trump Shock?NASDAQ breaks above its trendline, hinting at a possible short-term rally toward previous consolidation levels — but political volatility could still slam the brakes without warning.

Demand Zone US100 (Potential Long Play) Next week there is a nice opportunity on an identified demand zone on the US100. Due to bullish market Structure, We aim for long positions on demand zones as these are higher probabilities plays than shorts. The demand zone area is the last bearish candle (without upper wick), marked on the 1HR time frame and will be the key area of interest.

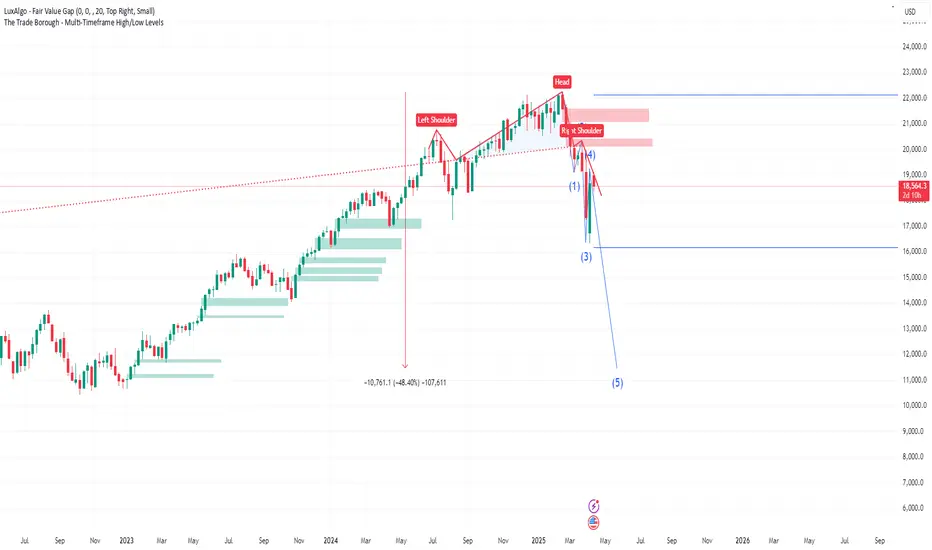
No shampoo in sight.....and an $11k Nasdaq?This posts presents an idea that has no precedence (that I can recall at least), so this is by definition a crazy idea BUT the chart is showing signs of extreme exhaustion and is possibly and quite frankly on the verge of a potentially destructive collapse.
If the recent severe volatility hasn't peaked your attention... this chart should.
It's quite simple...we have a MONSTER Head and Shoulders pattern on the Weekly TF...and we're finishing off the Right Shoulder! From a chart pattern perspective, this is ultra-ultra bearish.
The confluence we have is the Elliot Wave showing the we could be about to enter Wave 5. Elliot Waves are of course subjective BUT in this case its syncs with the Head and Shoulders.
If this was a 15min chart, most would probably agree hands down, but this is a Weekly Chart and represents Trillions on Trillions so its hard to believe that this could even be a possibility.....but I believe it could happen!
The horizontal blue lines provide 2024's High and Low Price. For this disaster scenario to be avoided, the Bulls and anyone who cares must defend 2024's low around 16100. This must not be breached, to keep the 12M bullish structure in place.
The green shaded areas highlight all of the Buy Side fair value gaps on the WEEKLY TF going back to early January 2023!
Could the market dive for these in devastating fashion? Only time will tell.
In the interim, we should trade safe and manage risk as best as we can.
X2: NQ/US100/NAS100 Long - Day Trades 1:2X2:
Risking 1% to make 2%
NAS100, US100, NQ, NASDAQ Long for day trade, with my back testing of this strategy, it hits multiple possible take profits, manage your position accordingly.
Risking 1% to make 2%
Use proper risk management
Looks like good trade.
Lets monitor.
Use proper risk management.
Disclaimer: only idea, not advice

NSDQ100 INTRADAY trend change supported at 18950 Key Support and Resistance Levels
Resistance Level 1: 19590
Resistance Level 2: 20070
Resistance Level 3: 20344
Support Level 1: 18460
Support Level 2: 17820
Support Level 3: 17330
This communication is for informational purposes only and should not be viewed as any form of recommendation as to a particular course of action or as investment advice. It is not intended as an offer or solicitation for the purchase or sale of any financial instrument or as an official confirmation of any transaction. Opinions, estimates and assumptions expressed herein are made as of the date of this communication and are subject to change without notice. This communication has been prepared based upon information, including market prices, data and other information, believed to be reliable; however, Trade Nation does not warrant its completeness or accuracy. All market prices and market data contained in or attached to this communication are indicative and subject to change without notice.

Nasdaq 100 Prepares for Launch — Reclaiming Critical GroundNAS100 8H TECHNICAL ANALYSIS 💻🧠
OVERALL TREND
📈 UPTREND — Structure is shifting bullish. Recent higher lows and strong rebounds from April lows confirm the current upward momentum. This is supported by 12/13 Moving Averages flashing BUY , including critical 50- and 200-period EMAs/SMA clusters. MACD and Momentum indicators also favor continued upside.
🔴 RESISTANCE ZONES
22,248.00 — 🔴 SELL STOPLOSS | Final Pivot High
21,955.77 — 🔴 SELL ORDER 2
21,364.19 — 🔴 SELL ORDER 1
🎯 TARGETS & BUY ORDERS
21,065.42 — 🎯 TP4 | EXIT THE RALLY
19,989.54 — 🎯 TP3 | Momentum confirmation
19,291.55 — 🎯 TP2 | Mid Pivot Zone
18,286.55 — 🎯 TP1 | Initial Profit Target
17,258.99 — ✅ BUY ORDER 1
16,630.74 — ✅ BUY ORDER 2
16,335.10 — ✅ BUY STOPLOSS | Pivot Low
🟢 SUPPORT STRUCTURE
PIVOT LOW @ 18,286 — Support holding for now
PIVOT LOW @ 17,258 — Strong confluence with previous structure
BUY ORDER zones between 16,330 – 17,258 — Demand cluster for reversals
🤓 STRUCTURAL NOTES
MACD shows bullish divergence with a rising histogram and crossover confirmation Momentum (+694) and RSI (66.69) suggest strength, though nearing overbought territory Price has reclaimed 10, 20, 50, 100, and 200 MA levels — rare alignment of major trend confirmation
Only outlier: Hull MA (9) signaling short-term overextension — may suggest brief consolidation before continuation
🌍 GLOBAL TECHNICAL SUMMARY
📊 12 of 13 Major Moving Averages = BUY
📈 MACD & Momentum Oscillators = BUY
🧭 Majority of Oscillators = Neutral — supporting a “calm before breakout” thesis ⚖️ CCI shows slight overbought = caution near resistance zones
📉 No major bearish divergence detected — trend remains intact
TRADE OUTLOOK 🔎
📈 Bullish Bias above 18,286.55 (TP1) targeting 19,291.55 (TP2) and beyond
📉 Bearish rejection likely near 21,065+ if volume fades — monitor RSI/MACD
👀 Watch for volume confirmation as we approach 19,989.55
🧪 STRATEGY RECOMMENDATION
CONSERVATIVE BREAKOUT ENTRY:
— Entry: 18,286.55
— TP Levels: 19,291.55 / 19,989.55 / 21,065.42
— SL: Below 17,258.99
RISK-ON DIP BUY STRATEGY:
— Buy Zone: 16,630 – 17,258
— TP: 18,286.55 / 19,291.55
— SL: Below 16,335.10
“Discipline | Consistency | PAY-tience”

Technical Breakdown on US100 Cash CFD | 1H Timeframe1. Key Observations (Volume, Gann & CVD + ADX Focused)
a) Volume Profile Insights:
Value Area High (VAH): 18,758.52
Value Area Low (VAL): Approx. 18,259.03
Point of Control (POC):
Recent Session POC: 18,758.52
Previous Session POC: 18,259.03
High-volume nodes: Clustered around 18,600–18,750 – area of high interest and possible re-accumulation.
Low-volume gaps: Below 18,300 – could act as fast-move zones on breakdown.
b) Liquidity Zones:
Stop Clusters:
Above 18,800 (recent swing high).
Below 18,250 (previous swing low).
Absorption Zones (Delta Volume Focus):
Strong absorption around 18,580–18,600; price has consolidated here indicating order filling.
c) Volume-Based Swing Highs/Lows:
High-volume swing low: 18,259.03 (POC) – strong buying response seen post drop.
High-volume swing high: 18,758.52 – rejection seen here on low follow-through.
d) CVD + ADX Indicator Analysis:
Trend Direction: Currently Range-bound (CVD not showing clear accumulation/distribution trend).
ADX Strength:
ADX ≈ 18–20: Suggests weakening trend; possible sideways movement.
DI+ ≈ DI-: Confirms indecision.
CVD Confirmation:
CVD flattening at resistance suggests equal pressure from buyers and sellers.
No strong rising or falling trend in CVD; supports ranging bias.
2. Support & Resistance Levels
a) Volume-Based Levels:
Support:
VAL: 18,259.03
Previous swing low/absorption: 18,300
Resistance:
VAH: 18,758.52
Rejection level: 18,800
b) Gann-Based Levels:
Confirmed Gann Lows: 18,259
Key Retracement Levels:
1/3 retrace from recent high: ~18,430
1/2 retrace: ~18,500
2/3 retrace: ~18,580
3. Chart Patterns & Market Structure
a) Trend:
Range-bound (confirmed by ADX near 20 and mixed CVD).
b) Notable Patterns:
Bearish rejection at VAH zone.
Potential descending channel forming from highs.
Fake-out above 18,750 followed by rejection – possible liquidity grab.
4. Trade Setup & Risk Management
a) Bullish Entry (If CVD + ADX confirm uptrend):
Entry Zone: Near 18,300–18,350 (absorption + VAL zone)
Targets:
T1: 18,580
T2: 18,750
Stop-Loss: Below 18,250
RR: Minimum 1:2
b) Bearish Entry (If CVD + ADX confirm downtrend):
Entry Zone: Near 18,750–18,800 (rejection area)
Target:
T1: 18,300
Stop-Loss: Above 18,850
RR: Minimum 1:2
c) Position Sizing:
Risk 1–2% of total capital per trade for optimal drawdown management.

Downtrend looks to be continuing with a new lower highAre we targeting a new lower low? Time will tell, but with every passing day the true nature of a sitting president full of hot air comes to light. The words that are spewed will have less and less gravity on the markets until his words are put out onto deaf ears and the markets can get back to a functioning state. When you hear a liar speak the first time you don't know the words are lies, but eventually you just stop listening to the nonsense because it all seems like lies after. Either way the words hold little punch. Shock and Shock is the ploy, I guess? I'm not shocked any longer and maybe the markets will get it too eventually.

Quick technical piece on Nasdaq100From the technical side, we are near the short-term downside resistance line, which if broken, may open the door towards higher areas. But will it be enough?
Let's take a look.
MARKETSCOM:US100
Let us know what you think in the comments below.
Thank you.
77.3% of retail investor accounts lose money when trading CFDs with this provider. You should consider whether you understand how CFDs work and whether you can afford to take the high risk of losing your money. Past performance is not necessarily indicative of future results. The value of investments may fall as well as rise and the investor may not get back the amount initially invested. This content is not intended for nor applicable to residents of the UK. Cryptocurrency CFDs and spread bets are restricted in the UK for all retail clients.

NAS100 | 1H | BUY ZONEHey There;
SIGNAL ALERT
BUY NAS100 / 17,682,18
🟢TP1: 18,000,00
🟢TP2: 18,500,00
🟢TP3: 19,726,64
🔴SL: 16,782,61
RR / 2,2
Please don't forget to like 🙏🏻
Thanks to everyone who supports my analysis with likes. 💙💙💙

Nasdaq Big Move (Trump Tariff Pause Effect)yesterday S&P 500 did biggest reversal move since 2008,
its bullish sign for use stock, therefor smart money expecting to buy again ,
there for we are expecting sharp move on CPI event, where smart money will buy with big order for log next 90 days

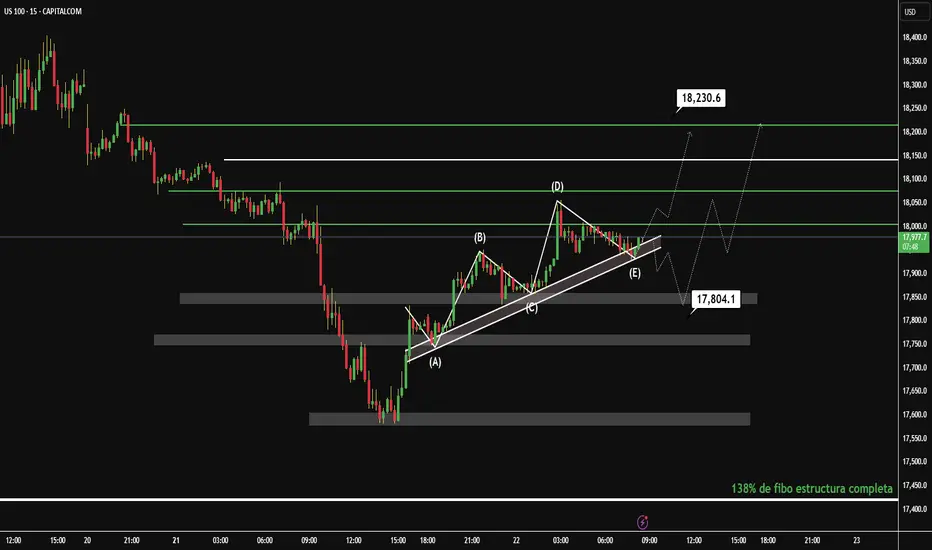
Ready for Takeoff: Buy Signal DetectedThe 15-minute chart of the NASDAQ shows a recent bullish move following a correction. I identify an interesting technical structure that could indicate an upcoming directional move.
Technical Analysis:
Patterns and Structure:
Symmetrical Triangle (A): The price has formed a symmetrical triangle between points (B) and (D), suggesting consolidation before a breakout. This pattern is neutral, but the recent upside breakout indicates a possible bullish continuation.
Fibonacci: The retracement from the high at (D) to the low at (E) reached the 38.2% Fibonacci level, which acted as dynamic support (17,804.1). This level is key and reinforces the validity of the current rebound.
Support and Resistance:
Support: The 17,804.1 level (38.2% Fibonacci) and the triangle base at 17,797.2 are key supports.
Resistance: The next upside target is at 18,230.6, a previous resistance level. If the price breaks above it, it could target 18,400.
Trend:
The breakout of the symmetrical triangle and the rebound from the 38.2% Fib confirm a short-term uptrend. The price is breaking the triangle's downtrend line (E), reinforcing the bullish momentum.
Trading Idea:
Entry: Consider a long entry (buy) at the current level (~18,000) or wait for a pullback to the support at 17,804.1 for a better risk-reward ratio.
Target: First target at 18,230.6 (resistance). If the momentum continues, the next level to watch is 18,400.
Stop Loss: Below the support at 17,797.2, to protect against a false breakout.
Risk/Reward: An entry at 18,000 with a stop at 17,797 and a target at 18,230 offers an R/B ratio of approximately 1:1.2.
Conclusion:
The NASDAQ at 15M shows a bullish breakout following a symmetrical triangle, with support at the 38.2% Fibonacci level. The short-term trend is bullish, with an initial target at 18,230.6. Monitor support at 17,804.1 to confirm the continuation of the move.
This analysis is concise and structured for a TradingView post. If you need adjustments or more details, please let me know.
Disclaimer: Grok is not a financial advisor; please consult one. Do not share information that could identify you.
Choose your Side- i often compare TheKing with Nasdaq right now.
- Have a main reason :
- NAS100 (Nasdaq) have mostly "Top Tech Companies" acting as Thermometers in this index.
- SPX (SP500) have Tech Companies + traditional ones. Nasdaq Companies are also included in SPX, but 500 Companies start to be a lot.
- DJIA (Dow Jones Industrial Average) is a Mastodons, i don't use it much because this top 30 is too mixed ( coca cola, boeing, techs, big banks, nike.. etc).
- i mostly use very high TFs, i prefer look from far, less noise, more easy and less headaches.
- i use sometimes to trade with 1D, H12, H4 TFs but when we are bullish. In bearmarket, it's hard to find entries points in bearish mode.
- i don't short markets and accumulate more coins/tokens, so i just DCA, Dollar Cost Averaging is investing a fixed amount of money into a particular investment at regular intervals.
- so this chart is basically only about MACD :
- it's really interesting to see Nasdaq making another red columns in 3W TF, while the markets should recover slowly.
- if you take a look at BTC, columns stayed in Light Red Color and reducing size.
What could it means ?
- Keep in mind that BTC is not a STOCK.
- One of the most pivotal events on Bitcoin's blockchain is the halving, when the supply of new bitcoins is cut in half (2024).
- BTC have 21M Supplies and that's all. no more will be created.
- At any time BTC could stop to follow Nasdaq and do his way, TheKing used to do that before already.
- A small bounce in Nasdaq could be also a huge move for BTC.
- " Choose your side " and DCA the money you don't need for living.
Happy Tr4Ding !

US 100 Index - Is 17404/749 Support Important?As European traders return from their extended Easter break they turn on their screens to find US assets back under pressure. The US 100 index dropped 2.2% yesterday to close at 17779, which included a late rally from a mid session low at 17570.
These moves are potentially reflecting a growing unease around numerous important issues, including, a lack of progress in trade talks with US allies, US economic growth concerns and President Trump's on-going challenge to Federal Reserve independence.
Looking forward, US 100 traders have a lot to focus on this week, Tesla reports its earnings after the close tonight, against a backdrop of weekend news reports which suggested it may be about to delay production of cheaper EVs. That aside, investors may also be focused on sales projections for 2025, autonomous driving plans and the impact of tariffs on the company's profitability.
It may well be a similar story when Alphabet reports its earnings after the close on Thursday.
Throw in the latest April Preliminary PMI Survey releases on Wednesday from the developed economies, which could well start to show the impact of tariffs on growth, business sentiment and inflation, and it is possible that the recent US 100 index volatility could continue across the week.
Technical Update: Could Potential Support at 17404/17749 Be Important?
As impressive as the 18% recovery in the US 100 index from the April 7th 2025 low to the April 10th 2025 high (16290 up to 19222) appeared, after the latest price weakness, this upside may prove to be a limited reactive move, although further confirmation may still be required.
As the chart above shows, the latest upside strength saw the index back to what some traders may have viewed as an important resistance, marked by a combination of the declining Bollinger mid-average (18992 at the time) and the 50% Fibonacci retracement of the February 18th 2025 to April 7th 2025 weakness, which stands at 19258.
With the latest price activity seeing weakness materialise again, it might now be suggested
this potential resistance range remains the important focus on the topside, although much will depend on future market sentiment and price trends.
With this in mind, what are the potential supports we might wish to monitor, to help us gauge how much further the current weakness may have to carry?
Possible Support Levels:
Fibonacci retracements can offer an insight into potential support zones, with them possibly able to hold, even reverse price weakness back to the upside. Therefore, 17404/17749, which is equal to the 50% and 61.8% Fibonacci retracements of the April price strength, maybe an area traders are currently focusing on.
However, there could still be potential for a further period of price weakness if this 17404/17749 range is broken on a closing basis. In that case, the next support may well then be represented by the April 7th 2025 session low at 16290, possibly further, if this in turn gives way.
Possible Resistance Levels:
The 17404/17749 support range is still intact, and while this remains the case on a closing basis, attempts at price strength could still be seen. However, with the declining Bollinger mid-average currently at 18648 and having recently seen it reverse attempts at price strength, closing breaks above this level might be required to trigger a more extended phase of strength.
That said, as proved the case in early April, 19258, the 50% Fibonacci retracement level, may also now need to give way on a closing basis, to suggest further attempts to develop price strength towards higher resistance levels.
The material provided here has not been prepared in accordance with legal requirements designed to promote the independence of investment research and as such is considered to be a marketing communication. Whilst it is not subject to any prohibition on dealing ahead of the dissemination of investment research, we will not seek to take any advantage before providing it to our clients.
Pepperstone doesn’t represent that the material provided here is accurate, current or complete, and therefore shouldn’t be relied upon as such. The information, whether from a third party or not, isn’t to be considered as a recommendation; or an offer to buy or sell; or the solicitation of an offer to buy or sell any security, financial product or instrument; or to participate in any particular trading strategy. It does not take into account readers’ financial situation or investment objectives. We advise any readers of this content to seek their own advice. Without the approval of Pepperstone, reproduction or redistribution of this information isn’t permitted.

Hanzo | Nas100 15 min Breaks – Will Confirm the Next Move🆚 Nas100 – Hanzo’s Strike Setup
🔥 Timeframe: 15-Minute (15M)
———————
💯 Main Focus: Bullish Breakout at 18160
We are watching this zone closely.
📌 If price breaks with high volume, it confirms Smart Money is in control, and a strong move may follow.
💯 Main Focus: Bearish Breakout at 18000
We are watching this zone closely.
📌 If price breaks with high volume, it confirms Smart Money is in control, and a strong move may follow.
———
🔻 Every warrior needs a tribe.
Follow Hanzo. Support the path.
Analysis
👌 Bearish Signs (15M TF):
• Liquidity Grab + CHoCH at 18700
• Liquidity Grab + CHoCH at 18400
• Strong Rejections seen at:
➗ 18400 – Major support
➗ 19000 – Proven resistance
———
🩸 Key Zones to Watch:
• 18700 – Bearish breakout level
• 19130 – Strong resistance (tested 6 times)
• 18400 – Equal lows

Following weekly structureWeekly tf has giving a clear choch
H4 making LLs
Marked POI on the weekly for potensial downside
First we have to grab all liquidity created before we have a manupilation to the upside
Lets see hows this gonna play out in the next 2 weeks tops

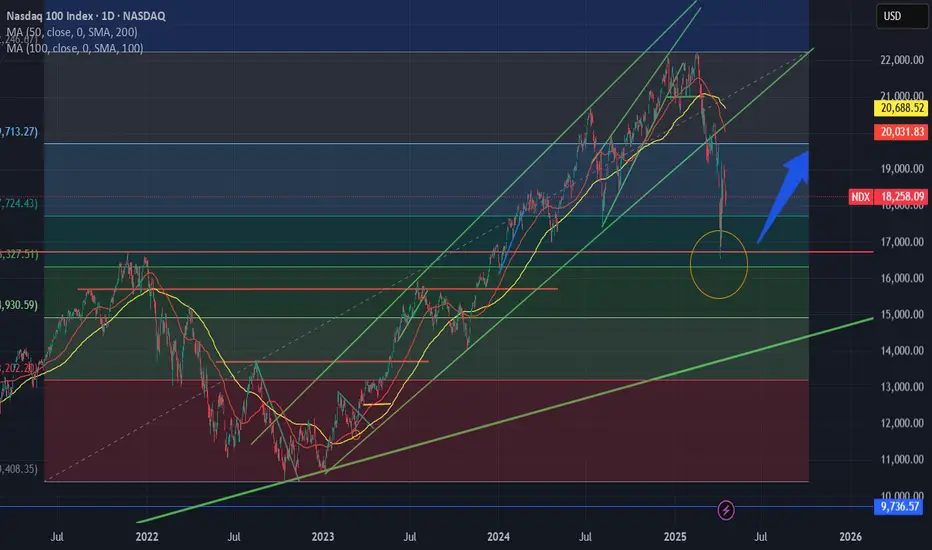
Long - assuming nothing else blows upThe recent drop seems to be due by policy that is still ambiguous and evolving, good chance trade war dies down when deals are made. other than that, NDX bounced off a previous high and has momentum to at least revert to the ma
Nasdaq - This Is Still Not The End Yet!Nasdaq ( TVC:NDQ ) cannot resist bearish pressure:
Click chart above to see the detailed analysis👆🏻
Over the past three months, we saw such a harsh correction on the Nasdaq that a lot of people are freaking out entirely. However technicals already told us that something feels wrong and this is the result. If we see another -10% from here, buying the dip will most likely pay off.
Levels to watch: $16.000
Keep your long term vision,
Philip (BasicTrading)

Bearish drop off 50% Fibonacci resistance?USTEC is rising towards the pivot and could reverse to the pullback support.
Pivot: 18,606.32
1st Support: 17,788.70
1st Resistance: 18,942.56
Risk Warning:
Trading Forex and CFDs carries a high level of risk to your capital and you should only trade with money you can afford to lose. Trading Forex and CFDs may not be suitable for all investors, so please ensure that you fully understand the risks involved and seek independent advice if necessary.
Disclaimer:
The above opinions given constitute general market commentary, and do not constitute the opinion or advice of IC Markets or any form of personal or investment advice.
Any opinions, news, research, analyses, prices, other information, or links to third-party sites contained on this website are provided on an "as-is" basis, are intended only to be informative, is not an advice nor a recommendation, nor research, or a record of our trading prices, or an offer of, or solicitation for a transaction in any financial instrument and thus should not be treated as such. The information provided does not involve any specific investment objectives, financial situation and needs of any specific person who may receive it. Please be aware, that past performance is not a reliable indicator of future performance and/or results. Past Performance or Forward-looking scenarios based upon the reasonable beliefs of the third-party provider are not a guarantee of future performance. Actual results may differ materially from those anticipated in forward-looking or past performance statements. IC Markets makes no representation or warranty and assumes no liability as to the accuracy or completeness of the information provided, nor any loss arising from any investment based on a recommendation, forecast or any information supplied by any third-party.
