US100 Short Idea after TariffsTariffs
expecting short from goldbach FVG level towards next liquidity pool
Good Luck
NASDAQ.USD.1.IEN trade ideas

NAS100 Will Move Lower! Sell!
Here is our detailed technical review for NAS100.
Time Frame: 45m
Current Trend: Bearish
Sentiment: Overbought (based on 7-period RSI)
Forecast: Bearish
The market is trading around a solid horizontal structure 18,546.2.
The above observations make me that the market will inevitably achieve 18,341.2 level.
P.S
Please, note that an oversold/overbought condition can last for a long time, and therefore being oversold/overbought doesn't mean a price rally will come soon, or at all.
Disclosure: I am part of Trade Nation's Influencer program and receive a monthly fee for using their TradingView charts in my analysis.
Like and subscribe and comment my ideas if you enjoy them!

Hanzo | Nas100 15 min Breaks – Will Confirm the Next Move🆚 Nas100 – Hanzo’s Strike Setup
🔥 Timeframe: 15-Minute (15M)
———————
☄️ Main Focus: Bullish Breakout at 18700
We are watching this zone closely.
📌 If price breaks with high volume, it confirms Smart Money is in control, and a strong move may follow.
☄️ Main Focus: Bearish Breakout at 18400
We are watching this zone closely.
📌 If price breaks with high volume, it confirms Smart Money is in control, and a strong move may follow.
———
Analysis
👌 Bearish Signs (15M TF):
• Liquidity Grab + CHoCH at 18700
• Liquidity Grab + CHoCH at 18400
• Strong Rejections seen at:
➗ 18400 – Major support
➗ 19000 – Proven resistance
———
🩸 Key Zones to Watch:
• 18700 – 🔥 Bearish breakout level
• 19130 – Strong resistance (tested 6 times)
• 18400 – Equal lows
• 3245 – Equal highs
———
🩸No rush. Only precision.
Hanzo moves in silence—then strikes with force.
🔻 Every warrior needs a tribe.
Follow Hanzo. Support the path.

Oversold but Not Safe – NAS100 Bears Still in Control
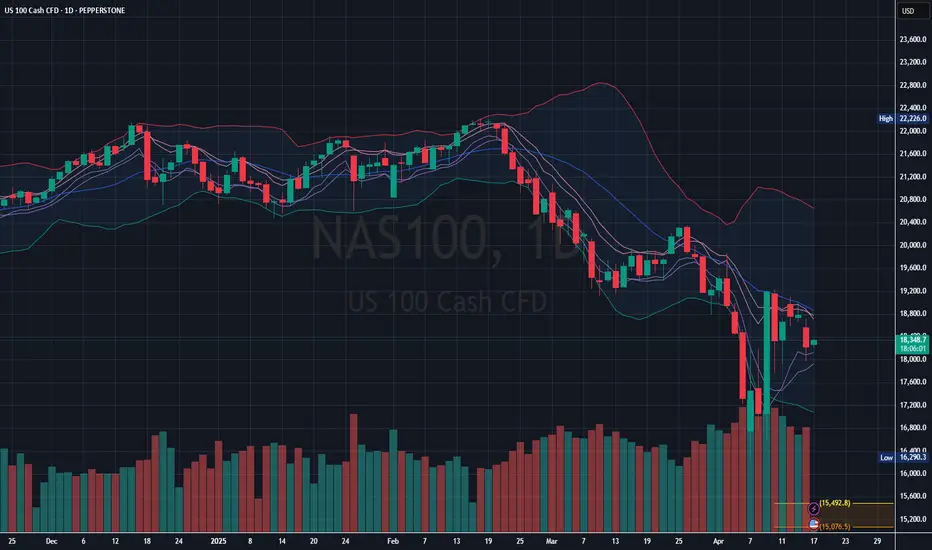
Currently trading below the 20-day SMA (middle of Bollinger Bands), indicating bearish momentum.
Support zone: ~17,600 (recent lows and high volume area)
Resistance zone: ~18,800–19,200 (middle Bollinger Band & recent highs)
Failure to break above 18,800 and another test of 17,600 could lead to continuation downward, possibly toward 17,000–16,800.
US100 shortThis should be a little piece of what will happen this week in my opinion!
Ofc no financial advice!!! ;) <3

FOMO hurtsH1 pushed high enough from a FVG
Structure got broke giving another oppertunity to get in
Resting above we got a clear FVG on the Daily tf thats need to be filled
Well lets see What NFP brings to the table
Be safe out there🫡🫡

NASDAQ IS SET TO REBOUND TO NEW HIGHSWeekly and daily EBP (Engulfing Bar Play) are in sync. Bullish price action and new highs are anticipated. No guessing, no calling the psychic hot-line, just pure price action.

NASDAQ, USTECH, DEAD CAT BOUNCEContinues bearish divergence
Multiple rejections from resistance area
Dead cat bounce appeared
failure to break resistance can lead towards 18500 area
Gap needs to be filled in that area
Negative GDP data will be the actalyst in bearish move
job market data is also negative
slowdown of economic growth

nas falling out the sky??price is at a 4hr bearish order block. have a ton of money to the downside i think its gonna get swept before trump pushes the markets up

Breakout or Rejection at Key ResistanceSupport and Resistance Levels:
Resistance: 19,856.6 is a key level where the price has recently been rejected.
Support: 19,146.4 is a major support, with an intermediate level at 19,516.0 acting as a pivot point.
Trend and Structure:
The price has broken a descending trendline (white dotted line), suggesting a potential trend reversal from bearish to bullish.
Currently, the price is consolidating between 19,516.0 and 19,856.6, indicating indecision.
Indicators:
EMA 200 (Daily): The price is below the EMA 200 (19,856.0), indicating that the long-term trend remains bearish until the price sustains above this level.
Fibonacci: The 138% / 50% Fibonacci retracement level (18,950.0) has acted as support in the recent past.
Bullish Scenario:
If the price breaks and holds above 19,516.0 with volume, it could target the resistance at 19,856.6.
A confirmed break above 19,856.6 (with a close above the EMA 200) could signal bullish momentum toward 20,000 or higher.
Bearish Scenario:
If the price fails to hold above 19,516.0 and breaks lower, the next key support is at 19,146.4.
A drop below 19,146.4 could push the price toward 18,950.0 (Fibonacci level).
Recommendation:
Long Entry: Wait for a confirmed break above 19,516.0 with a strong close and volume. Target: 19,856.6. Stop-loss below 19,400.0.
Short Entry: If the price rejects 19,516.0, consider a short with a target at 19,146.4. Stop-loss above 19,600.0.
Monitor volume and price action near the EMA 200 for trend confirmation.
Note: This analysis is for informational purposes only and not financial advice. Adjust based on your strategy and risk management.

Is Nasdaq still bullish? Steep correction today as expectedIf you look at my last post, you can see where I explained the expectation.
As range theory would state, the rejection from the bottom of a range creates a target in the high of the range. I have identified the candle top that I believe is the target for this rally.
If the bearish imbalance is stacked with too many orders we will not make it there. We are sitting right around the 50EMA for hourly as well as retesting the break point and bottom of the hourly bearish orderblock as I have marked.
It is in my opinion that the Void will act as a magnetic anomaly and assist in pulling price up as many institutional orders will be in that range, but we'll see 🔑
Share with a friend in need of real guidance 🫡

Finally a correction in indices collective imbalance belowBeen wanting to show you all the mechanics of the correction phase when it happened. A very good formation here, feast your eyes. EASY 🔓


NASDAQ a look ahead...As the NASDAQ and other major U.S. Equity Indexes face the pressure of economic uncertainty, the price action between days show that investors are not quite convinced this bull run has seen its finish line. However, we shouldn't only be looking toward private investor sentiment, but also that of the Federal Reserve's presence in the market and how the bond market reflects the Fed's position moving forward.
As shown here, the all time high for the TVC:NDQ is $22,133.22. Our position is that the NASDAQ must reclaim, retest, and continue beyond the all time high in order for us to continue our confirmation on the bull run. The path described should look as shown below...
In this instance, we can assume the bull run should continue. However, we should also be prepared for an alternate scenario where investors leave risk assets behind to chase non-risk assets (bonds for example). This scenario would look as shown below.
All though these are not the only two possible scenarios, we can most likely expect the future to play out in a similar fashion as the examples.
As for the market metrics to keep an eye on, look to TVC:US10Y for any bond yield manipulation, FRED:RRPONTSYD for market liquidity metrics, and FRED:M1V for M1 money velocity. Furthermore, keep an eye on tariffs for consumer tech ( NASDAQ:AAPL , NASDAQ:NVDA , NYSE:TSM ) and military activity ( NYSE:LMT , NYSE:RTX , NYSE:NOC ). Lastly, keep an eye on the banking and financial sector for more than likely banking deregulations withing the coming years.

nas100nas100 went for 484 pips off the bearish action i took an caught 325 pips after the price action close

NAS100 SELL 1 HOUR TIME FRAMESTRONG SUPPLY ZONE
Fair value gaps to fill
Amazing Range 2:41 Risk Reward, Let's See!

NAS 100 EYESThis is where our eyes currently are, there is a clear gap that the low energy movement is heading toward, challenging a weekly low, with a 4 hour unconfirmed bullish trend. We hope to see more unfold today, Happy Trading. Hit me Up.

Nasdaq analysis: 30-APRIL-2025Good morning. Welcome to today's Nasdaq market analysis and educational insights for price action traders.

USNAS100 30M CHART PATTERN echnical Analysis Summary
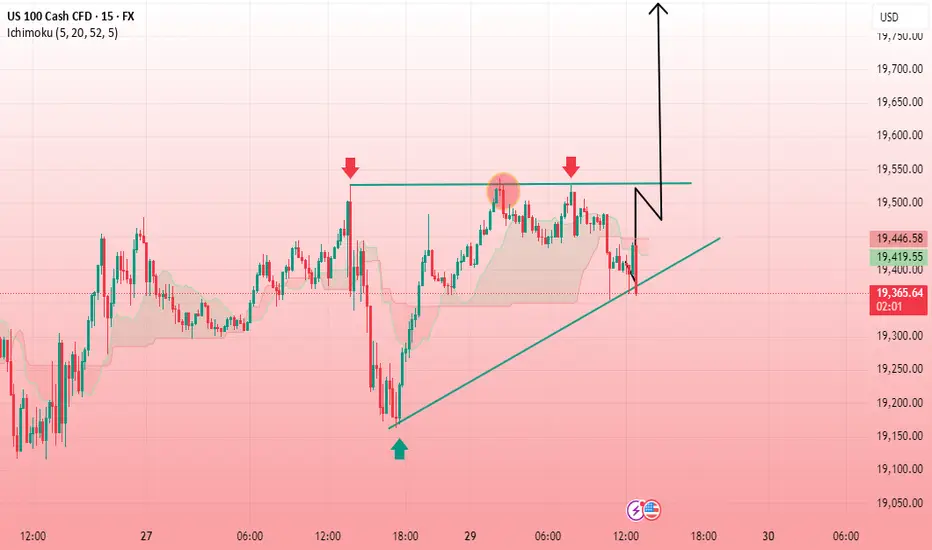
Chart Pattern Observed:
The chart shows a clear ascending triangle pattern, which is a bullish continuation pattern. This is formed by a horizontal resistance level (around 19,550) and a rising trendline (higher lows), suggesting buying pressure is building up.
Key Levels:
Resistance Zone: 19,550
Support Trendline: Rising from ~19,050 to current level
Current Price: ~19,580
Breakout Target: 19,800.00 (as marked)
Interpretation:
Price has tested the 19,550 resistance multiple times without breaking lower significantly, indicating strength.
A breakout above this resistance would confirm the bullish triangle pattern.
The projected target, calculated using the height of the triangle added to the breakout level, is around 19,800.
Volume confirmation would further strengthen the breakout's validity (not shown here).
Potential Strategy:
Buy on breakout above 19,550, ideally with volume confirmation.
Take Profit: Around 19,800, per the measured move projection
Lesson 10: Nas-Daq100 Wick trading analysisAnalyzing Nas 100 trading strategy using wicks as a point of entry.

Technical Breakdown on US100 | 1H TimeframeHere’s the detailed breakdown of the US100 1H Chart based on Volume Profile, Gann analysis, and custom indicators (CVD + ADX):
1. Key Observations (Volume, Gann & CVD + ADX Focused)
a) Volume Profile Insights:
Value Area High (VAH): 19,383
Value Area Low (VAL): 19,220
Point of Control (POC): 19,291.79
High-volume nodes: Clustered around 19,220 to 19,300 (heavy acceptance).
Low-volume gaps: Above 19,400 and below 19,200 — price can accelerate through these zones.
b) Liquidity Zones:
Stop clusters likely at: Above 19,400 (recent swing highs). Below 19,200 (recent breakout area).
Order absorption zones: Around 19,291 (POC) and 19,220 (high bid absorption).
c) Volume-Based Swing Highs/Lows:
Swing High: 19,382 (testing resistance with moderate volume).
Swing Low: 19,220 (breakout launch pad).
d) CVD + ADX Indicator Analysis:
Trend Direction: Uptrend
ADX Strength: ADX > 20 and DI+ > DI-, confirming strong bullish momentum.
CVD Confirmation: Rising CVD + bullish candles = Strong demand and genuine buying pressure.
2. Support & Resistance Levels
a) Volume-Based Levels:
Support: 19,291.79 (POC) 19,220 (VAL & previous demand zone)
Resistance: 19,382-19,400 (current tested highs and potential breakout point)
b) Gann-Based Levels:
Recent Gann Swing High: 19,382
Recent Gann Swing Low: 19,220
Key retracements: 1/2 level: 19,301 1/3 level: 19,274 2/3 level: 19,328
3. Chart Patterns & Market Structure
a) Trend:
Strong Bullish (confirmed by rising ADX and CVD).
b) Notable Patterns:
Ascending Channel: Clear uptrend with higher highs and higher lows inside the purple channel.
Breakout retest: POC retest around 19,291 before moving higher.
No major topping signals yet — still holding structure.
4. Trade Setup & Risk Management
a) Bullish Entry (If CVD + ADX confirm uptrend):
Entry Zone: 19,290–19,310 (near POC support zone)
Targets: T1: 19,400 (swing high breakout) T2: 19,500 (measured move from channel)
Stop-Loss (SL): 19,220 (below VAL and previous swing low)
RR: Minimum 1:2
b) Bearish Entry (If CVD + ADX confirm downtrend):
Entry Zone: 19,380–19,400 (at resistance failure)
Target: T1: 19,290 (POC retest)
Stop-Loss (SL): 19,450 (above resistance breakout trap)
RR: Minimum 1:2
c) Position Sizing:
Risk only 1-2% of trading capital per trade.

Nasdaq market analysis: 28-APRIL-2025Good morning. Welcome to today's Nasdaq market analysis and educational insights for price action traders.

Gold Vs. Nasdaq, since 2022Fairly clear here that Gold and Nasdaq correlated in direction until December 2024, at which time the equities market peaked. The two continued to correlate in trend direction until February, where, after several years divergence finally occurred.
Gold continues upward, equities continue lower. This seems to be a clear indication that equities, in this case the Nasdaq, will continue into downward correctional territory while Gold continues into a positive trending direction.
