NQ: Upcoming Weekly Analysis!FA Analysis:
1- Earnings season: In my view, it's irrelevant in terms of the data itself! It reflects the pre-tariffs era. Market is always looking forward. However, it gives market the opportunity for a relief, consolidation and rebalancing. So beside the kneejerk reaction, uncertainty is in the driver seat.
2- Trump's policies: The 90-day pause has a big chance to become an Eternity pause. Cracks inside Trump's team about the impacts of these tariffs on their own corporations will make them fleeing Trump's boat. Hence, the rational supporting the Eternity pause. This said, we'll see many tweets highlighting how much Trump is winning to feed his mindset.
3- Key economic data: Economic data will take over the driver seat. Recession and Inflation are the key data for market. Bad data is bad for Equities and vice-versa.
4- FED: Rate cut has increased probability during the next meeting, but for the wrong reasons. Both Trump and market will continue their pressure on the FED. This pressure is translated via Sell-off of stocks and equities.
5- Risk: Beside the uncertainty context, I think agreements between Iran-USA and Ukraine-Russia are underway. This is positive for equities. Gold is your indicator in this front.
TA Analysis:
Weekly TF:
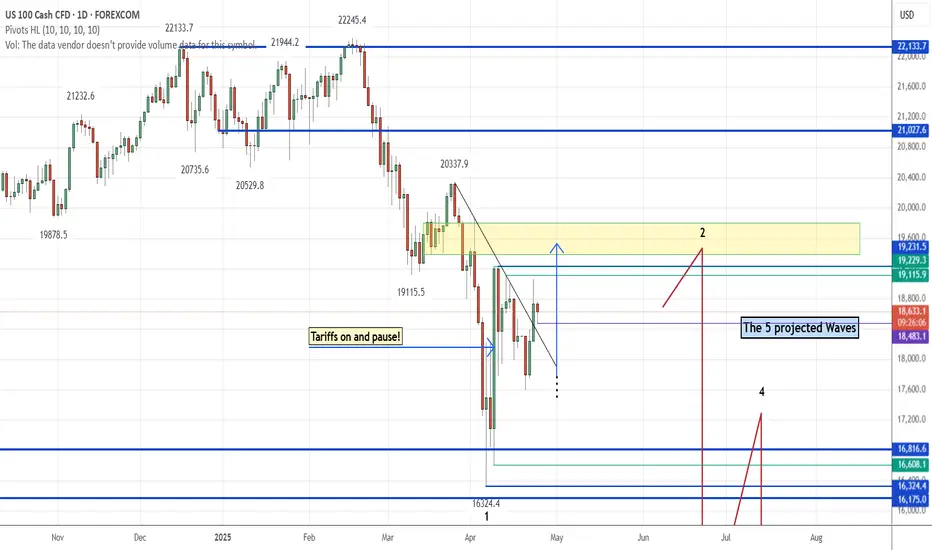
- Not much to update from two weeks ago analysis! Price is in its way to complete Wave 2. Crumbles left.
- Price broke out and closed above the 90-day pause weekly/daily candle. This tells you a continuation up is expected but not too much left in the upper side.
- Economic Data will drive the move. This might last 1-2 weeks.
Daily TF:
- Green daily close with a small size candle.
- A consolidation period is expected to end this Wave 2. So there is no rush to jump in the sell side to catch the top of Wave 3. Here is a good opportunity for swing position that you can build incrementally as the price creates LL from lower TF up to Daily and Weekly TF.
GL!
NASDAQ.USD.1.IEN trade ideas

Price breaking out of a wyckoff balance to go unbalanceMy approach the market was pointing out market had found a balance zone starting on April 9th- today. Today I notice high volume on the bull side towards one of the resistance points which it broke and retraced. One it started to retrace I went to the smaller time frame to look for a sniper entry( 5min bullish and strong delta candle stick rejecting of a low volume node and the session vwap ). The balance zone was $1450 wide so it should go imbalance for the same amount or close. This trade is really a 25rr but im going for 8rr to pass my 2nd phase in my challange. This trade will not hit instill like Wednesday maybe even to the end of next week.

us 100 Buy IDEAUS 100 has entered buy zone
Good idea to buy
Sustained previous support
Making new higher highs

wyckoff balance and unbalance tradeI believe market is going to breakout this balance zone and become imbalance on the buyers side.I'm only going for 6rr to pass my challenge but this is a easy 12rr trade

The Interest Rates Paradox and How it'd Predict a Market Top NowIt is a common assumption that higher interest rates naturally slow economic expansion and cool overheated markets.
However, the historical record over the past 50 years tells a more nuanced story when it comes to bubbles. In several major crashes—the dotcom bubble, the U.S. housing bubble, and the Japanese Nikkei bubble—a pattern emerges: monetary authorities began increasing rates well before market tops were reached.
Surprisingly, instead of slowing the market in the short term, these rate hikes coincided with a parabolic run-up in asset prices .
The paradox lies in the fact that while rising rates are expected to dampen market exuberance, during these bubbles, they coexisted with—and arguably even fueled—frenzied market behavior.
This paradox has played out yet again over the last years. With us seeing not only the parabolic rally phase during the interest rate hikes but also us having a current agreement with the interest rates and equites topping at the same time. As with all previous market tops. As we sit here today, we have followed the interest rate topping paradox to the letter.
Let's look more into it.
Historical Patterns and the Paradox
The Early Phase: Initial hikes into a heating up market.
In each of these historical cases, central banks initiated rate hikes as part of a broader strategy to temper what they viewed as emerging economic imbalances. In the late 1980s, for instance, the Bank of Japan began tightening monetary policy as asset prices soared, anticipating overheating in the economy. Despite these early rate increases, the Nikkei continued its upward trajectory, ultimately reaching its peak in December 1989. This pattern was echoed in the U.S. during the dotcom era. Leading into the 2000 peak, the Federal Reserve started to raise rates to control inflationary pressures—even as the technology-heavy market rallied to unsustainable heights.
The pattern has always been similar. Markets are starting to get hot and perhaps there's some unwanted consequence of this (like inflation). So the central bank takes actions to cool things down with the interest rate hikes. Although there have been reactions from this in the near term, overall the trend has become stronger and stronger during the hike cycle.
Let me give you an example to add some context. Alan Greenspan is famous for the "Irrational exuberance" comment. He said that in 1996! The Nasdaq absolutely boomed from there for another 4 years. What had happened before was nothing compared to what came after the interest rate hikes started.
The Parabolic Reaction: Markets Defy Conventional Logic
What seems paradoxical is that rather than a smooth deceleration, markets often reacted to these rate hikes with an intensified speculative fervor. During the dotcom and housing bubbles, small increases in rates did not immediately curb investor optimism; instead, they appeared to add urgency, fueling a belief that the market was resilient enough to outperform despite higher borrowing costs. The market’s parabolic rise in asset prices during periods of tightening monetary policy is counterintuitive, suggesting that investors were less influenced by the immediate cost of capital and more driven by momentum and fear of missing out.
By the high of these rallies it was firmly believed that this was a sign the uptrends would continue. Indeed, they could only get stronger as the interest rates came back down.
....Nah uh. Wasn't how it went all!
And we find ourselves in a strongly similar situation now in 2025.
Leveling Off and the Market Peak
It gets weirder still when you notice rather than markets slowing down on rate cuts they highs of the equites rallies always came rate increases eventually plateau.
Historical data shows that when interest rates stabilized—often within a narrow band of around 5% to 6.5%—this stabilization coincided with the market reaching its absolute peak. In these instances, the plateau did not signal the end of the monetary tightening cycle; rather, it marked the culmination of the bubble. Market participants, having pushed prices to their limits, were suddenly confronted with a reversion, as the underlying economic fundamentals could no longer justify the inflated asset values.
Knowing what happened before does not let you know what will happen in the future, but it's worth knowing. It may well just end up being useful in the future. In every instance of a big market top in the last 50 years the pattern was interest rate hikes and parabolic rallies in this phase, when the hikes stopped the first market sell off began.
We have an exact matching of these conditions now.
The Bear Market and Rate Easing
Once the market had peaked, and the bubble burst, central banks found themselves in a difficult position. In response to the ensuing economic downturns, monetary authorities were compelled to cut rates dramatically—even as equity markets remained subdued. This rapid reduction in rates was aimed at stabilizing economies and stimulating recovery, yet it often came too late to salvage the once-insatiable market exuberance. The inversion of the earlier paradox—where rate hikes were accompanied by soaring markets—serves as a stark reminder of the complexity of monetary policy in times of speculative excess.
All you have to do is look at any of the interest rate charts for the crash in question and it's clear to see these both peaked and reversed around the same time. During bubbles, historically correlation with equities and interest rates is close to prefect. From the start of our interest rate hikes to now, this has continued to apply.
A play out of the historical norms for this would now see rates continue to drop with equities dropping alongside them (Overall, maybe rallying on the news now and then).
Which would make this a rather risky time to be buying the dip.
=================================
Realistic Examples of the Paradox
=================================
Nikkei Bubble (Late 1980s):
Monetary Policy: The Bank of Japan initiated rate hikes to cool a rapidly expanding economy and soaring asset prices.
Market Behavior: Despite these increases, the Nikkei continued its parabolic climb, peaking in December 1989.
Aftermath: Following the bubble’s burst, rates were cut sharply as the market entered a prolonged bear phase.
Dotcom Bubble (Late 1990s to 2000):
Monetary Policy: In response to rising inflationary pressures, the Federal Reserve began increasing rates before the bubble reached its zenith.
Market Behavior: Rather than curbing exuberance, the rate hikes coincided with an acceleration in market gains, contributing to an unsustainable rise in tech stock valuations.
Aftermath: The eventual plateau in rates occurred as the market hit its peak, soon followed by a dramatic downturn when investor sentiment shifted.
U.S. Housing Bubble (Mid-2000s):
Monetary Policy: The Federal Reserve’s gradual rate increases were part of an effort to moderate the housing market’s explosive growth.
Market Behavior: Housing prices continued to rise, reflecting an underlying confidence in the market that outpaced the modest increases in borrowing costs.
Aftermath: When rates eventually leveled off, the market was near its peak, and subsequent rate cuts during the bear market underscored the stark reversal of fortunes.

X2: NQ/US100/NAS100 Long - Day Trades 1:2 RRX2:
Risking 1% to make 2%
NAS100, US100, NQ, NASDAQ Long for day trade, with my back testing of this strategy, it hits multiple possible take profits, manage your position accordingly.
Risking 1% to make 2%
Use proper risk management
Looks like good trade.
Lets monitor.
Use proper risk management.
Disclaimer: only idea, not advice

Pre-market Plan- Consolidating at highs,potential gap fill below(The following is for personal views only and does not constitute investment advice. Please exercise your own judgment before making any decisions.)
Currently on the 4-hour chart, price remains above the 200 SMA. RSI shows slight overbought signals, while the EMA suggests there is still upward momentum. After the Asian session, a short-term downtrend has formed.
Price is currently forming a downward flag, which could lead to further downside movement. After market open, price is likely to first move down to capture liquidity, with primary targets at 19062 and 19038.
If a reversal occurs, there is a high probability for the price to retrace upward to fill the NDOG at 19266. If bulls take control, ideally this should happen before 10:00. Afterward, there is a chance to break through to EHPDA 19505, but considering the overbought market condition and lack of strong catalysts, the probability of a significant move higher today is relatively low. If the price continues to rise, watch levels at 19891 and 20370. Look for reversal opportunities at these key levels.
To the downside, watch PDL 18493, and gaps at 18280 and 18000 as potential targets.
Due to Friday’s influence, the market may range between 19061–19505 today, with a potential move to fill the lower gaps next week. Price action after the open will help further confirm market sentiment.
If Bullish – Price should show a clear rebound after liquidity is taken.
If Bearish – If price breaks 19036 and fails to rebound effectively, expect significant downside.

NQ is in its way to complete the Impulsive Swing of Wave 2Today's Plan:
So far, NQ is behaving as expected besides Trump cornucopia tweets:)
NQ might not complete the Impulsive swing today, but the direction is up.

Analysis of Nasdaq 100 (US100) based on Price ActionThis analysis examines the recent price action of the Nasdaq 100 (US100) and identifies potential scenarios based on key technical levels.
Current Situation:
The price has recently moved above a short-term downtrend line, which could indicate a shift in momentum. This development suggests a possibility of upward movement.
Potential Bullish Scenario:
A decisive break and sustained close above the recent resistance level of 19,224 may open the door for further gains. In such a scenario, the index might target the 20,329 level. A successful move beyond that could potentially lead to a test of the historical peak at 22,245.
Potential Bearish Scenario:
Conversely, if the index fails to overcome the 19,224 resistance, there is a chance it could retest previous support levels. These levels are identified at 17,592 and, subsequently, at 16,322.
Conclusion:
The US100 is currently at a critical juncture. The ability of the price to sustain a move above 19,224 may determine its short-to-medium-term trajectory. Both bullish and bearish scenarios remain possible, and traders should monitor price action closely around these key levels.

X2: NQ/US100/NAS100 Short - Day Trades 1:2 RRX2:
Risking 1% to make 2%
NAS100, US100, NQ, NASDAQ short for day trade, with my back testing of this strategy, it hits multiple possible take profits, manage your position accordingly.
Risking 1% to make 2%
Use proper risk management
Looks like good trade.
Lets monitor.
Use proper risk management.
Disclaimer: only idea, not advice

NQ: Same plan-Complete the Impulsive swing within Wave 2Price is in its way to complete the last impulsive swing within Wave 2. There is no urgency to close the gap from the opening week; it will be closed during the move down of wave 3.
Looking to buy from NY opening range.
NASDAQ Breakout Done , 5oo Pips Waiting For Us , Are You Ready ?Here is my opinion on Nasdaq , we have a stop hunt very clear and then we have a very good breakout with amazing bearish candle , so i`m waiting for the price to go up a little to retest the broken support and new Res , and then we can enter with good bearish P.A And Targeting from 300 to 500 pips .

Looks Like a Good Short Term Sell To Me - NDXGood Morning,
We have some double rejection on NDX. Forming a nice consolidation pattern for a break above or below. I am in SQQQ until target zone.
Enjoy!

X2: NQ/US100/NAS100 Short - Day Trades 1:2 RRX2:
Risking 1% to make 2%
NAS100, US100, NQ, NASDAQ short for day trade, with my back testing of this strategy, it hits multiple possible take profits, manage your position accordingly.
Risking 1% to make 2%
Use proper risk management
Looks like good trade.
Lets monitor.
Use proper risk management.
Disclaimer: only idea, not advice

CRT CREATEDThis week was a sweep and continue bullish, this was after the market draw on liquidity to send it off upwards. so expectation is the high will be taken out this week or next week if Thursday doesn't fulfil the wish. Monday was the low of the week during New York session causing Tuesday to follow the trend and break Monday's high

Nasdaq market analysis: 23-APRIL-2025Good morning Dear Traders! Join me for Nasdaq market analysis for today. Share your charts, ask questions, and let's discuss trading strategies.

Are we out of the woods yet ? From the day chart, it is 50/50 chance as we are in a crucial position.
While we are officially no longer in a bear market, the price action are still weak and has yet to break above the resistance of 19,213 on 9th April which was the day Trump announced a 90 days cooling period.
If the price action over the next week/month continues nicely in the upward channel, then the probability of breaking above 19,213 resistance is more secured.
The challenge remains nobody knows for sure what trump cards does Trump holds and he is well aware his words alone can moves the market. He said he is unhappy with Powell and that causes market jittery, another fall day and the next day, he said he has no intention of firing him.
And we have Bessent saying the de-escalation with China is coming to a close (really?) and that drives the market higher.
I bet it is very tough to be in Trump's team , facing so much pressure and stress and saying things out of proportions on a daily basis. Credibility is definitely at stake, just like a shattered mirror, the cracks will forever be there.
IF you feel extremely uncomfortable and you have positions in the US markets, perhaps trimming some of your holdings might help you to sleep better. Avoid taking on unnecessary risks by betting on short term market moves. The hardest part of trading is psychology and if you got lucky once or twice winning your bets, are you going to stop and not continue ? Or will you bet bigger? 90% of the traders will do the latter thinking they got things under control and that is when the market takes an abrupt turn and kill you without batting an eyelid.
Stay safe, stay wise, always have stop loss if you want to trade, never borrow money no matter how reliable you think your tips/indicators are telling you.

Buy Nasdaq - Candle stick CONFIRMED BUYERS are in control....
- broke through our STRONG RESISTANCE... bearish trend....
Buys Nasdaq.

ANALYSE NASDAK US 100now nasdak to way to finish first wave forentre now we need corection nasdak now more 8300 point like and follow our profile for more analyse forex crypto stocks future any help just inbox me our write comment and good luck

Nasdaq 100 (US100) – Bearish Double Top PatternNasdaq 100 shows a clear Double Top pattern, signaling a potential bearish reversal after recent bullish momentum. Price has broken below the neckline, confirming the pattern, and is now heading toward the projected target around 16,500.
Fundamentally, risk sentiment remains shaky amid rising interest rate expectations and mixed earnings reports, adding pressure to tech-heavy indices like US100.
Pattern: Double Top
Bias: Bearish
Target: 16,500
Resistance: 18,000+
Trade Active: Short bias below neckline level
NOTE: This is not financial advice. Trade at your own risk.
Support: Like & follow for more trade ideas!

Eyes on US1001. Took out previous high
2. Change of delivery
3. SELL Limit in place
4. TP @ previous low.
Thoughts?

NAS100 BUY NOW!!!!!!!!!!Nas took out the buyside liquidity currently we looking at the price making a pull back or a retest to the buyside for a big rally up 19,107 is my target on nas am in on buy right now.....

