RUT - LONG Can use R2K futures on this as well, may have a bit more downside potentially to 2200 but I am getting in here and giving it some room
RUSSELL trade ideas

SHORT price broke $2275This publish is meant for educational purposes only. This is not an investment device.
Added RUT Double diagonal... Will post trade details soon..


looking for a buy on this pairtested an area of high importance and candlesticks show a rejection so looking long positions to the upside


SHORT if price breaks support $2275...This publish is meant for educational purposes only. This is not an investment device.
If price breaks $2275 support, then the price action will go to target 2215.
Stop above the top end of the channel.
Will add put diagonal...


Selling Russell 2000 here for a pullbackOverbought, top of its volatilty range, due a pullback, good risk/reward

Russell 2000 long targetThe 2357 area looks good as a long target. This is the 100% fib retracement level and also resistance from the upper band of a trendline from the 2016 - 2018 uptrend. I am not suggesting that price will reverse here, but I am preparing for some sort of impulse correction down from that level which should setup fib levels for potential entry longs. That would be how I will be playing it.

RUT - reversing in a massive CUP & HANDLE pattern?
Russell looks like reversing - many signs that 2174 could be a TOP in place - see my previous idea
BUT the reverse has been very SLOW so far
it looks like a massive top reversal curve or CUP & HANDLE pattern
it could be turning in a massive channel till Friday next week (options expiry) or beginning of FEB


RUT TOP? divergences & harmonic patterns, short from 2174
divergences on main 1W 1M time frames
Wolfe wave on 12H time frame
many divergences on 12H timeframe
spike in sell volume on 1H crossing 55WMA

RUT 60% Crash? Contrarian ViewRUT has been on a tear lately but this could end badly.
Looking at the chart, we can see similar ending patterns like we saw in Mar of 2000.
The Fib retracement at .61 (if RUT crashes) will be similar to the one in 2000 as shown in the chart.
Do your research before investing as this is not an investment advice.

RUT/SPX ratio is just a play on commodity pricesIn short, Russel has more exposure to material prices, and this is reflected in the ratio of the russel to the S&P, which looks extremely similar to the combined price of oil, copper, and soybeans (just as an example of a simple commodity basket).


RUT End Of Week EvaluationTrend Analysis:
The current trend is defined by the last price and it's relationship to specific moving averages.
Check the MA strategy for more specific suggestions.
Weekly: The relationship to the primary trend MA is bullish. The price in relationship to the other averages suggest long positions
Price Action:
Weekly: The average price range currently is 82.8169 points/ticks/pips. Prices are currently 4.114x the normal trading range. Prices are equvialent to 4 or more days away from the trend average. Prices can suddenly stall and move sideways while awaiting the averges or transition directions suddenly.
Prices currently are trending and not in consolidation.
Standard Deviation
Weekly: Standard deviation suggests a range from 1928.24 to 2318.159 for the following week.
Calculated Price Strength:
The strength of the trend in conjunction with specific averages.
News announcements can change the strength and directional attitude.
Weekly: Trend strength suggests trading between a range of 2123.20 to 2237.65 for the following week.
Price Projection:
The price action has generated a projection signal for the underlying.
Weekly: Price currently displays (if strength and attitude continue) a desire to move toward 2170.05
If strength and attitude continue, it could take between 5 to 10 trade periods (weeks) to reach the projection.
Indicators Summary.
A collection of technical indicators whose directional attitude has been summarized.
Weekly: Out of the cumulative indicators monitored, 100.00% are bullish, 0.00% are bearish, 0.00% are neutral
The CCI indicator trading strategy suggest the following:
Weekly: Very strongly bullish - long entries.
Confirmation Signal
6 indicators combined to confirm entry/exit.
Weekly Bullish - Open directional trades

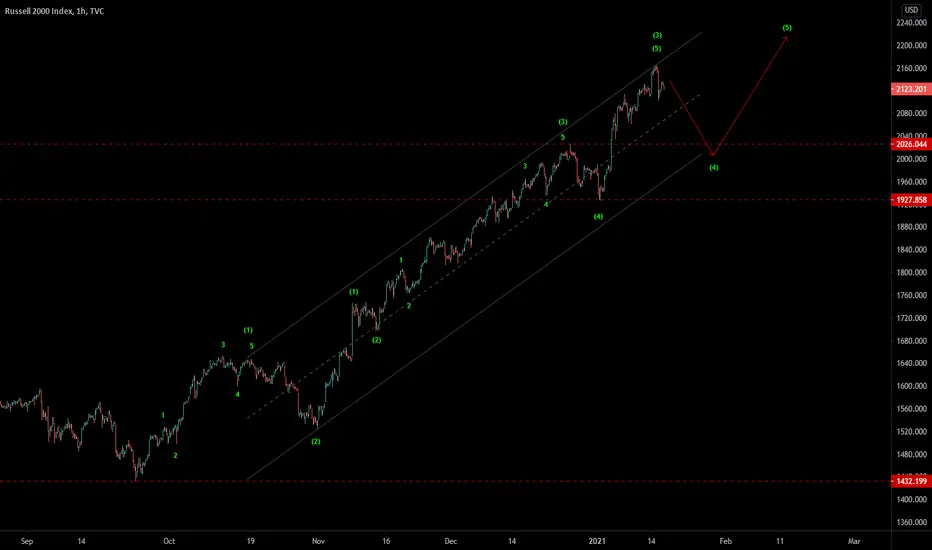
RUT (RUSSELL 2000) - EW analysis - 4th wave correctionRUT - It completed the 3rd wave upside of the impulse cycle and correcting down in 4th wave, which expected to go down up to 2000 level. It is good level to enter in buy set up for next up cycle for new high.
Give thumbs up if you really like the trade idea.
US2000Align prices with resistance areas to sell with the trend
NOTE: the market is for reference only, absolute cut-loss is always observed
---------●_●------------
Leave me a comment or like to keep my content free and lively.
Wishing everyone a happy and happy weekend!


Small Caps are not OverboughtWhile small caps have been one of the best performers lately, they are still far from being overstretched on a relative performance basis . Reopening of the economy in the 1H of 2020 can reaccelerate the outperformance of the cyclical components while stocks that have been leading during coronavirus will lag behind.
