Gold Ideas for April 23 ahead of Flash Manufacturing PMI News📉 XAUUSD Trade Plan – April 23, 2025
Market Overview:
Current Price Action: Gold is in a bearish corrective phase within a higher time frame bullish structure. The recent price action confirms a short-term bearish flow with CHoCH and BOS.
🔻 SELL ZONES
🔴Sell Zone 1: 3330–3341
✅ Valid: Previous support turned resistance
Structure: CHoCH origin on 1H
Watch for: NY spike into zone + LTF rejection
🔥 Most likely short setup today
🔴Sell Zone 2: 3362–3372
⚠️ Still valid, but far from price
Use only on aggressive NY volatility or PMI spike
Risk of price flipping bullish if broken
🔴Sell Zone 3: 3384–3393
❄️ Inactive for now – requires major news catalyst
HTF OB + imbalance, but distant unless price surges
Lower probability unless full reversal structure forms
🔴Key Level: 3410–3414
🔒 Reserved for extreme sweep/reversal
Only valid if all upper zones are taken out + price reaches premium zone with liquidity grab
🟢 BUY ZONES
🟢Buy Zone 1: 3290-3303
✅ Played perfectly – Price tapped and bounced
Structure: M30 OB base + liquidity sweep
Still valid for retests with M1–M5 confirmation
Primary intraday buy
🟢Buy Zone 2: 3272–3282
🟡 Valid but less likely today unless 3291 breaks
Stucture: FVG fill + minor OB
Good for continuation if NY fakes out into discount
🟢Buy Zone 3: 3224–3233
🧱 Strong HTF EQ zoneReactive demand with imbalance
Use for NY deep pullback + structure reclaim
🟢Buy Zone 4: 3150–3190
⚠️ HTF only – not expected to trigger today
Long-term reversal zone, use with caution unless major drop happens
🔍 FINAL STRATEGY NOTES
Watch 3318–3330: Mid-structure, key battle zone → avoid entries here
Best plays:
→ Sell from 3330–3341 if rejection forms
→ Buy retest of 3291 ONLY with clean confirmation
Avoid counter-trend limit orders — wait for BOS/CHoCH on LTF
📌 Important Notice!!!
The above analysis is for educational purposes only and does not constitute financial advice. Always compare with your plan and wait for confirmation before taking action.
USCGC trade ideas

GOLD - at his fresh resistance ? What's next??#GOLD... perfect drop below our area as we told youabout CUT N REVERSE.
now market have 3328 to 3332 region as a current resistance region.
And market dropped 200 points around in 2 days (almost 1 day and 1 hour)
So keep close your region because if market holds that then further drop expected.
Good luck
Trade wisely

Trading Psychology Trap: The Dark Side of Hedging a Bad Trade⚡ Important Clarification Before We Begin
In professional trading, real hedging involves sophisticated strategies using derivatives like options, futures, or other financial instruments.
Banks, funds, and major institutions hedge to manage portfolio risk, based on calculated models and complex scenarios.
This article is not about that.
We are talking about the kind of "hedging" retail traders do — opening an opposite position at the broker to "protect" a losing trade.
It may feel smart in the moment, but psychologically, it can be a hidden trap that damages your trading discipline.
Let’s dive into why emotional hedging rarely works for independent traders.
________________________________________
In trading, there’s a moment of panic that every trader has faced:
"My short position is in the red… maybe I’ll just open a long to balance it out."
It feels logical. You’re hedging. Protecting yourself. But in reality, you might be stepping into one of the most deceptive psychological traps in trading.
Let’s unpack why emotional hedging is rarely a good idea—and how it quietly sabotages your progress.
________________________________________
🧠 1. Emotional Relief ≠ Strategic Thinking
Hedging often arises not from a solid strategy, but from emotional discomfort.
You don’t hedge because you’ve analyzed the market. You hedge because you can’t stand the pain of a losing position.
This is not trading.
This is emotional anesthesia.
You’re trying to feel better—not trade better.
________________________________________
🎭 2. The Illusion of Control
Opening a hedge feels like taking back control.
In reality, you’re multiplying complexity without clarity.
You now have:
• Two opposing positions
• No clear directional bias
• An unclear exit strategy
You’ve replaced one problem (a loss) with two: mental conflict and strategic confusion.
________________________________________
🎢 3. Emotional Volatility Rises Sharply
With two positions open in opposite directions:
• You root for both sides at once.
• You feel relief when one wins, and stress when the other loses.
• Your mind becomes a battleground, not a trading desk.
This emotional volatility leads to irrational decisions, fatigue, and trading paralysis.
________________________________________
🔄 4. You Delay the Inevitable
When you hedge a losing position, you don’t fix the mistake.
You prolong it.
Eventually, you’ll have to:
• Close one side
• Add to one side
• Or exit both at the wrong moment
Hedging here is just postponed decision-making—and it gets harder the longer you wait.
________________________________________
🧪 5. You Build a Dangerous Habit
Hedging out of fear creates a reflex:
"Every time I’m losing, I’ll hedge."
You’re not learning to cut losses or reassess your strategy.
You’re learning to panic-protect.
And over time, you start to rely on hedging as a crutch—rather than developing real confidence and discipline.
________________________________________
✅ The Healthier Alternative
What should you do instead?
• Cut the loss.
• Review the trade.
• Wait for a fresh setup that aligns with your plan.
Accepting a losing trade is hard. But it’s a sign of maturity, not weakness.
Hedging may feel clever in the moment, but long-term consistency comes from clarity, not complication.
________________________________________
🎯 Final Thought
Emotional hedging isn’t about strategy.
It’s about fear.
The best traders don’t hedge to escape a loss.
They manage risk before the trade starts —and have the courage to close what’s not working.
Don’t fall into the illusion of safety.
Master the art of decisive action. That’s where real edge lives. 🚀

4/24 Gold Trading StrategyYesterday's intraday recommendation to buy near 3260 has paid off, with gold trending upward after the market opened today and generating solid profits.
The current pullback appears to be a healthy support retest. However, caution is needed—if the price breaks below 3306, momentum could drag it under 3300 again.
Should that happen, a renewed long position at lower levels is still worth considering. The rebound so far lacks both strength and duration, suggesting a potential shakeout. While it could also be a bull trap, entering at lower levels limits downside risk—with the worst case being reduced profits, not significant losses.
Today's Trading Strategy:
Sell Zone: 3410–3440
Buy Zone: 3267–3230
Flexible Trading Zones: 3383–3340 / 3288–3336

GoldGold has some more correction before any upside further.
Disclosure: We are part of Trade Nation's Influencer program and receive a monthly fee for using their TradingView charts in our analysis.

XAUUSD (GOLD) READY TO MOVING ZONEPrice is currently near a strong demand zone (the shaded grey area at the bottom).
The chart expects a bullish reversal (price to move up from this zone).
The main target is set at 3,343.311.
Based on this, here’s a possible trading plan:
Entry Zone:
- Look for buy entries between 3,266 and 3,260
Targets:
- TP1: 3,290
- TP2: 3,310
- TP3 (Final Target): 3,343
Stop Loss:
- Place a stop loss below 3,255 (below the demand zone for some safety margin).
Summary:
This analysis looks strong because the price has made a "weak low" and there is a high chance for a bullish move upwards.

GoldXAUUSD
- Bullish Channel as an Corrective Pattern in Short Time Frame
- Change of Characteristics
- RSI - Divergence
- Completed " 12345 " Impulsive Waves
- Rising Wedge

Gold delivering side SwingsTechnical analysis: After today’s E.U. session excellent Bearish Short-term opening and clear Technical Selling signal, Fundamentals didn't managed to distort (as seen many times lately) Technical proper trend and from a clear #3,327.80 and main Support mild-aggressive break-out, Gold didn't recovered and tested #3,200.80 benchmark with almost #50-point Intra-day spread in Bear direction. Personally, reason behind it was market speculators pulling the DX (# +0.27%) back towards the Resistance zone, preventing further downtrend on #4-session horizon. Gold is on decline again driven by known factors and keeping almost (# +9.02%) gains comparing on Monthly (#1M) chart which strongly affected Technical values. That not much Buyers expected today’s mini Selling scenario - confirms the small Buying Volume where Gold is unable to reverse from current psychological benchmark. Sellers appear in good health off Swing once Support is now turned in Resistance at #3,327.80. Further Selling from current Price-action draws in Support at #3,252.80 (June #29 spike similarities) which is by my estimations really hard to reach since I can't count out that Gold is still on a Bullish perspective and I see this downside spike as an good re-Buy point as cycle is showcasing / every similar decline on Gold was just another accumulation zone for new Bullish multi-Month uptrend extension. What’s also interesting to mention that Gold soared even though DX was soaring as well, indicating elemental Volatile trend on Gold and almost all market classes. While Weekly chart’s (#1W) Price-action showcases that Gold is less likely heading for Lower levels, Fundamental side flow will reveal the major move (and how DX will digest it). I am enjoying current Price-action suitable for both Buyers and Sellers of the market and monitor DX to position yourself properly.
XAUUSD sell Gold price retreats slightly from near $3,500, or a fresh all-time highs in the early European session on Tuesday as bulls pause for a breather amid overbought conditions on short-term charts. Any meaningful corrective downfall, however, still seems elusive on sustained US Dollar weakness
If Gold sellers manage to fight back control, Gold price could initially retreat toward the $3,400 mark, below which the previous day’s low of $3,329 will be tested.
Gold sell signal 3456
Target 3050

Is gold’s downtrend turning bearish?Gold plunged from a high of 3,500 yesterday, mainly because US President Trump said at the swearing-in ceremony of SEC Chairman Atkins on Tuesday that he had no intention of firing Fed Chairman Powell, although he was disappointed that the Fed did not cut interest rates faster. The cooling of risk aversion directly affected the gold price, which once fell to $3,366, and then closed around 3,382, with the largest drop of 134 points on Tuesday. This wave of gold correction is still continuing. After opening today, it fell straight to 3,315. Although the decline has now been completely recovered, I think the short position still has continuity, so today's operation strategy is still mainly high-altitude.

XAUUSD Today's Operation StrategyLooking back on our previous analyses, we have repeatedly emphasized the close correlation between the easing of tariff issues and the pullback in the price of gold 🔍. Now, based on the judgment of the latest market dynamics, today's trading strategy for gold still maintains short selling as its main tone 📉. Here, we solemnly remind all freelance traders that to avoid the risk of account liquidation caused by drastic market fluctuations, it is advisable to stay away from taking long positions as much as possible ⚠️
From a technical analysis perspective, the range between 3380 and 3360 has established a solid resistance barrier 🚧. Once the gold price rises and reaches this area, there is a high probability that it will encounter strong selling pressure and decline 📉. This is precisely the optimal time to place short orders 📝. Additionally, the price range of 3330 - 3320 deserves special attention 👀. As the starting point of a large bullish candlestick on the hourly chart, it also serves as a potential support level for long positions during retracements 📈. At the same time, the gain or loss of the key support level of 3280 below is of great significance 📊. If this support level is effectively broken, it indicates that the bearish forces have full control of the market, and the gold price may initiate a new round of decline ⬇️. The next target level can be focused on around 3195 🎯. It is crucial to keep in mind that in the actual trading process, formulating a rigorous SL and TP strategy and reasonably managing the position size are the keys to stable trading 🔑
⚡️⚡️⚡️ XAUUSD ⚡️⚡️⚡️
🚀 Sell@3380 - 3360 - 3340
🚀 TP 3330 - 3320 - 3300 - 3280
The market has been extremely volatile lately 📈📉 If you can't figure out the market's direction, you'll only be a cash dispenser for others 💰

Gold Potential Ideas - April 23, ahead of Unemployment Claims📉 Macro Snapshot – April 24, 2025
Gold is currently trading at 3337, stuck in mid-structure between supply at 3384–3414 and demand stacked between 3255–3260 and 3224–3233.
🕒 Key time today: Unemployment Claims and Durable Goods Orders hit. High-impact potential.
Expectations:
🔺 Strong data → possible spike down into buy zones
🔻 Weak data → potential liquidity grab into sell zones first
No confirmed shift unless 3344 is broken or 3220 is reclaimed. This is a reaction day, not a breakout day. Let price come to levels — and strike with confirmation.
🔴 SELL ZONES
🔴 Sell Zone 1: 3384 – 3393
🧱 Confluences: HTF imbalance + OB + structural trap zone
🛡 SL: 3398
🎯 TP1: 3365
🎯 TP2: 3341
🎯 TP3: 3310
🔴 Sell Zone 2: 3410 – 3415
🧱 Confluences: Premium OB + liquidity grab zone
🛡 SL: 3421
🎯 TP1: 3384
🎯 TP2: 3362
🎯 TP3: 3330
🔴 Sell Zone 3: 3450 – 3457
🧱 Confluences: Untouched HTF OB + psychological stop hunt
🛡 SL: 3465
🎯 TP1: 3410
🎯 TP2: 3380
🎯 TP3: 3341
🟢 BUY ZONES
🟢 Buy Zone 1: 3274 – 3282
📍 Strong support pocket — demand + Asia low
🛡 SL: 3264
🎯 TP1: 3300
🎯 TP2: 3330
🎯 TP3: 3350
🟢 Buy Zone 2: 3250– 3260
🧠 Confluences: Deep OB + liquidity grab + structural base
🛡 SL: 3245
🎯 TP1: 3272
🎯 TP2: 3300
🎯 TP3: 3313
🟢 Buy Zone 3: 3224 – 3233
📍 HTF EQ + reactive demand
🛡 SL: 3218
🎯 TP1: 3255
🎯 TP2: 3280
🎯 TP3: 3303
📌 Important Notice!!!
The above analysis is for educational purposes only and does not constitute financial advice. Always compare with your plan and wait for confirmation before taking action.
📣 If this strategy sparked clarity, hit that like button and follow. 💛

Gold Hits 3430 – Time to Hunt the Reversal or Reload the Bull?💥 “3430 Cracked – Is Gold Flexing or Faking?”
📍 XAUUSD Sniper Plan | April 21 NY Session | ATH Game On
🧾 Macro Overview – Why Gold Is on Fire
Gold just pierced through ATH 3430.34, fueled by:
🔥 Escalating US–China trade tensions (145% US tariffs, 125% China response)
📉 Weakening USD (Dollar Index down 5.2% YTD)
🏦 China’s strategic gold accumulation (tripled reserves to 8%)
📊 Rate cut expectations from the Fed & bond volatility
📈 Goldman Sachs target upgrade: $3700 → $4500 if tensions persist
In short: gold isn’t just bullish—it’s a magnet for global fear, positioning, and central bank demand. But after a vertical sprint, even bulls need to breathe.
🔻 SELL ZONES (Only from Premium + Confirmed Trap Structures)
🔴 Sell Zone 1 – ATH Rejection Trap
🎯 Entry: 3430–3434
🛑 SL: 3440
✅ TP1: 3412
✅ TP2: 3390
✅ TP3: 3360
📌 Key Confluences:
– Final sweep zone above ATH
– H1 OB + M15 FVG
– RSI divergence building
– Psychological exhaustion at major round number
🔴 Sell Zone 2 – Parabolic Extension Fade
🎯 Entry: 3444–3448
🛑 SL: 3455
✅ TP1: 3420
✅ TP2: 3400
✅ TP3: 3375
📌 Key Confluences:
– Fibonacci 1.618 extension
– Unmitigated imbalance
– Microstructure overextension (use only with M5/M15 CHoCH)
🟢 BUY ZONES (Only from Real OB + FVG Zones, No Bounce Traps)
🟢 Buy Zone 1 – Mid-Structure Reentry (FVG/OB Confluence)
🎯 Entry: 3395–3398
🛑 SL: 3386
✅ TP1: 3420
✅ TP2: 3432
✅ TP3: 3444
📌 Key Confluences:
– Clean M15 OB
– FVG support from previous impulse
– Trendline touch + EMA21/50 base
– RSI reset at mid-levels
🟢 Buy Zone 2 – H1 Demand + Deep Discount Opportunity
🎯 Entry: 3360–3365
🛑 SL: 3345
✅ TP1: 3390
✅ TP2: 3412
✅ TP3: 3430
📌 Key Confluences:
– Strong H1 OB zone (unmitigated)
– 38.2–50% Fibonacci retracement
– High-probability trap zone if price flushes aggressively
🧠 Final Thoughts
Don't chase the top. Gold has no problem dragging traders up the hill, then letting gravity take over.
Sniper entries only. No emotion. No FOMO. Just structure, logic, and patience.
💬 Caught the 3430 sweep? Ready to reload or reverse?
👇 Drop your thoughts below — or just leave a 🧠 if this plan helps keep you focused.
Let’s keep trading smart, precise, and together.
— GoldMindsFX Team ✨

XAUUSD Market Recap – April 21, 2025 | NY Close Review🟨 XAUUSD Market Recap – April 21, 2025 | NY Close Review
🔹 Price Action:
Gold made another aggressive high into ATH 3430, reaching full premium territory with strong upside momentum through London into NY. But the reaction near 3430 was sharp — indicating potential short-term exhaustion.
🔍 What Worked Today
✅ Liquidity sweep complete – Price ran clean through the previous weak high and liquidity above 3425, grabbing the top before rejecting.
✅ Bullish BOS confirmed – Structure remained bullish on all timeframes, with no valid CHoCH break on H1 or H4.
✅ Sniper bias confirmed – Directional buys played perfectly from lower OBs (especially the ones marked pre-Asia and pre-London).
🔍 What Didn’t Happen
❌ No mitigation of lower H1/H4 FVGs – Zones between 3361 and 3387 remain completely untouched.
❌ The 3305–3315 OB area wasn’t retested – Meaning any breakout traders looking for retests were left hanging.
❌ No real signs of reversal structure – Despite the reaction off ATH, we’ve yet to see a proper CHoCH + BOS sequence on H1 or H4.
⚠️ Unmitigated Key Zones
🟦 H1 FVG – 3361
🟦 H4 FVG – 3285.00–3300.00
🟧 H4 OB block – 3224 (untouched, still a strong magnet if sell momentum kicks in)
These levels remain high interest for any future discount buy setups if price starts pulling back.
📉 What Was Rejected Today
🔼 3430 – New ATH. Price wicked into this level and rejected instantly with visible CHoCH on M15 and M5, leaving a clear bearish reaction.
🔼 M15 OB – The supply zone around 3425–3430 acted as short-term resistance with an intraday bearish sequence into NY close.
🧠 Market Sentiment
🔸 Still bullish on HTF, but intraday shows clear profit-taking behavior.
🔸 Dollar weakness and geopolitical premium still holding gold up — but overextension risk is real above 3425.
📍 Summary
Gold remains in a strong uptrend but may be showing short-term exhaustion after hitting ATH 3430. With unmitigated OBs and FVGs below, any deeper pullback will be liquidity-driven, not structural bearishness… yet.
We'll prep the sniper plan separately soon — stay ready. 🧠⚔️

One Step Ahead of the MarketHey guys and girls,
Look at this chart, Do you see what I see? (we are heading into a bear market).
(RSI= 86, kiss of Death) a chart is worth a thousand words!
Technical Section (a top is in place- ABC bear market):
Wave 1 = $ 850
Wave 3 = $ 1650
Wave 3 > 1.618 x length of Wave 1----> Wave 5 (Max) = 2.618 x length of Wave 1 (Target = $ 3300)
Fundamental (Bearish):
Let's look at the reasons:
a- Trump's trade war is over; as a result, there is no strong overriding trend.
b- Federal Reserve holds interest rates steady
Conclusion:
The trend is losing momentum and a top is in place.
Target = $ 2700
Invalidation level = $ 4170

Gold fluctuates in a range and corrects sideways! Trend AnalysisAnalysis of gold market trends next Monday:
Technical analysis of gold: From the performance of the daily chart, the recent trend of gold prices has shown a high consolidation trend, and there has been a significant correction from the high point near $3,500. After hitting the low point of the week, the gold price rebounded to a certain extent, but the rebound strength was blocked near the 23.6% Fibonacci retracement level (about $3,368-3,370), which has now become an important short-term resistance. The opening trend of the gold market on Friday was like Thursday, and the Asian session started to pull up and rise all the way to around $3,370. However, it encountered strong resistance here, and then turned downward and started to fall. It is worth noting that today's gold price not only failed to break through this key resistance level, but also fell below the low point hit by yesterday's European and American sessions, and rebounded after reaching a minimum of $3,265.
From the current market structure, the position of $3,260 has become the focus of the market, and investors need to pay close attention to whether the gold price can reach or even fall below this point. Once it effectively breaks, the bearish trend will be further strengthened, and the market may usher in a deeper adjustment. From the current form, there are two Yins enveloping Yangs, so the adjustment will continue at the beginning of next week; of course, this adjustment can be replaced by sideways trading, which means that it is not ruled out that it will run back and forth in the 3260-3380 range. On the whole, the short-term operation strategy for gold next Monday is recommended to be mainly long on pullbacks, supplemented by short on rebounds. The short-term focus on the upper resistance of 3368-3370, and the short-term focus on the lower support of 3265-3260. Friends must keep up with the rhythm. It is necessary to control the position and stop loss, set stop loss strictly, and do not resist single operation. The specific points are mainly based on real-time intraday trading. Welcome to experience and exchange real-time market conditions.
Reference for gold operation strategy next Monday: Strategy 1: Short gold rebounds near 3368-3370, target near 3300-3285, and look at the 3260 line when it breaks.
Strategy 2: Go long on gold when it pulls back to around 3265-3270, target around 3290-3330, and look at the 3370 line if it breaks.

XAUUSD Daily Sniper Plan – April 22, 2025Structure: Premium rejection after ATH 3500 | Intraday bearish | HTF bullish trend
📉 Trend & Bias
Macro (D1–H4): Bullish trend remains intact, but price rejected perfectly from the confirmed ATH at 3500, creating a bearish engulfing on H4 and Daily.
Short-term (H1–M30): Bearish bias for intraday plays, confirmed by clean CHoCH and BOS on H1 + M30.
🔻 SELL SCENARIO #1 – RETEST OF LAST M15/H1 OB
Entry Zone: 3485–3492
SL: 3501 (above ATH wick and OB invalidation)
TP1: 3450
TP2: 3425
TP3: 3405
Confluences:
Last valid OB on M15 before the drop
FVG + imbalance above
Weak high at 3492
Premium zone sweep
Rejection from HTF ATH zone
🔻 SELL SCENARIO #2 – LIQUIDITY FAKEOUT ABOVE 3465
Entry Zone: 3463–3467
SL: 3474
TP1: 3435
TP2: 3415
TP3: 3400
Confluences:
M5–M15 LHs and CHoCH
Bearish reaction candle after multiple taps
Previous imbalance and minor OB
Trap area if price fails to break cleanly
🟢 BUY SCENARIO #1 – REACTION FROM CLEAN FVG + LIQUIDITY SWEEP
Entry Zone: 3405–3412
SL: 3395
TP1: 3440
TP2: 3460
TP3: 3480
Confluences:
Clear FVG chain (H1 + M30)
Deep discount sweep
Liquidity below 3405
Structure support + RSI oversold bounce potential
🟢 BUY SCENARIO #2 – FVG BOUNCE AT EQ ZONE
Entry Zone: 3414–3420
SL: 3404
TP1: 3450
TP2: 3475
TP3: 3495
Confluences:
EQ of M30 range
Base of unfilled FVG
Strong reaction last time from this zone
EMA21 support
🔍 Key Zones & Market Notes
Type Level Description
🔺 ATH 3500 Confirmed all-time high (April 22)
🔻 OB Sell 3485–3492 Last clean M15–H1 OB
⚠️ Weak High 3492 Inducement zone – watch fakeouts
🟩 FVG Buy 3405–3412 Strong FVG + liquidity sweep zone
📉 H1 BOS 3456 Intraday momentum shift
🔻 CHoCH 3440 Confirmed lower structure
🟦 Major Support 3362–3368 Valid HTF demand if price breaks down
🔲 EMA Zones EMA21/50 H1 Near 3415–3430 – dynamic support
🧠 Summary
Gold is rejecting heavily from the new ATH at 3500. Intraday structure broke bearish (CHoCH, BOS on H1/M30), and price is now trading between premium OBs and deep FVGs. Both buy and sell sniper entries are available depending on how price reacts to 3465–3485 or if it sweeps the 3405–3412 liquidity area. HTF trend is bullish, but NY could bring a deeper correction if 3400 breaks.
🧠 Stay sharp. Avoid random entries. Stick to clean structure zones.
📊 Drop a like, leave a comment, and follow @GoldFxMinds for daily precision trades!

GOLD Trade Plan 24/04/2024Dear Traders.
Price opened with + GAP , and i have 2 Scenario`s for Reversal ,
1- Reversal From 3290-3305 to Target 3400
2- Reversal From 3220-3240 To Target 3400
This recent drop suggests that we are likely in wave 4, and I expect another upward wave to follow. We need to wait and analyze the daily and weekly candles more closely.
If you enjoyed this forecast, please show your support with a like and comment. Your feedback is what drives me to keep creating valuable content."
Regards,
Alireza

Gold 100% Profit SignalGold has retreated from $3,500, is the price near a top? Possibly. But I wouldn't sound the alarm bells just yet. This is most likely due to some regular profit-taking. The high indicators are more of a warning than a call to arms. Rather than "get out of here," it's more of a "stay alert."
At present, the initial support below is in the 3405-3400 area. Further down are the two key support levels of 3380 and 3357. 3380 is the support level near the middle track of the 4-hour level, and 3357 is an important top and bottom conversion position in the previous period. These two positions still provide strong support for the future market rise. At present, the 4-hour level high has closed in a bearish pattern of Yin engulfing Yang engulfing, and the K-line is negative. The short-term is expected to improve and fall back. Short-term operations will mainly rebound from high altitudes. Pay attention to the resistance near 3435 and 3450 on the top and do not break the air. Pay attention to the support near 3408-3400 on the bottom. If it breaks, adjust the position and continue to look at 3380.

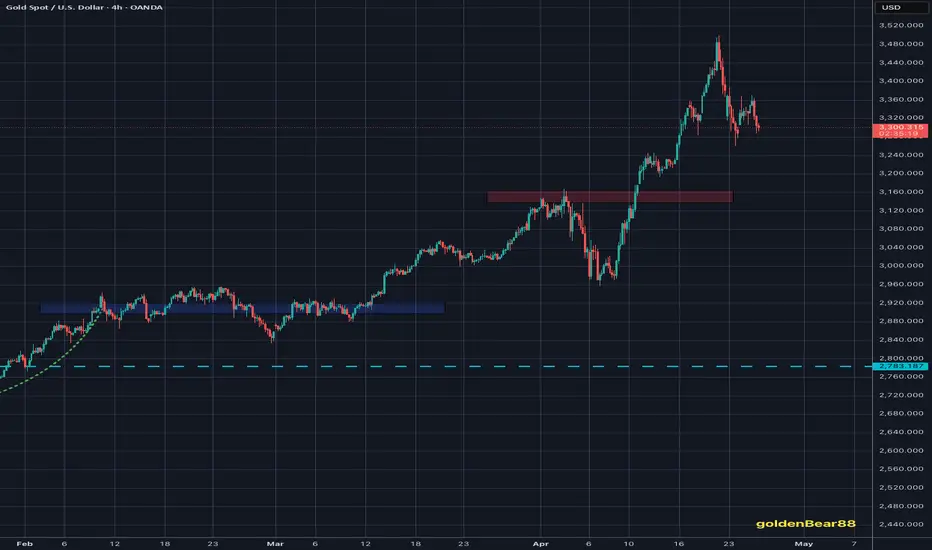
GOLD Price Analysis: Key Insights for Next Week Trading DecisionLast week, Gold briefly hit an all‑time high of $3,357 before profit‑taking drove it back to around $3,320 zone📉
Ongoing uncertainty around US‑China trade relations and a weaker dollar drove traders into safe‑haven assets, supporting bullion bids despite the pullback.
Meanwhile, Fed Chair Jerome Powell’s hawkish speech on Wednesday capped the rally for now, though tariff risks and geopolitical tensions may continue to underpin Gold prices into the new week.
In this video, we:
🗺️ Break down the key chart levels
🔍 Highlight bullish vs. bearish setups
🚀🔻 Preview catalysts that could spark the next move
Disclaimer:
This is my personal take based on experience and what I see on the charts. It’s not financial advice—always do your own research and consult a licensed advisor before trading.
#GoldMarketAnalysis #Inflation #TradeTensions #GeopoliticalRisks #TechnicalAnalysis #GoldTrading

XAUUSD Gold Possible Move 23.04.2025Gold (XAUUSD) Technical Analysis – April 23, 2025
The market is currently showing bearish momentum following a retracement from the recent highs near the 3,500 mark. Price is now approaching key Fibonacci levels, presenting potential shorting opportunities for intraday and swing traders.
Key Levels to Watch:
📉 Short Opportunity 1:
Zone: 3400-3410 USD (Fibonacci 0.5 to 0.618)
Analysis: This is a premium supply zone and a retracement area aligning with the Fibonacci golden pocket. If the price revisits this region and shows bearish confirmation (e.g., bearish engulfing, rejections, or lower timeframe structure break), it's a high-probability short entry zone.
Signal: Look for price rejection patterns in this zone to initiate a short position.
Stop-Loss: 3,430
Target: 3,292 initially, then lower if structure breaks
📉 Short Opportunity 2 (Breakout Trade):
Zone: 3,292 – 3,300 USD (Major Support)
Analysis: This is a major support zone. A clean break below and successful retest from underneath would signal continuation to the downside.
Signal: Wait for a break and retest below 3,292 for confirmation before entering short.
Stop-Loss: Above 3,300 on retest
Target: 3,240 and potentially 3,215 – 3,220 zone
Overall Bias:
Bearish below 3,396. Price action confirms lower highs and lower lows. Structure supports selling rallies or breakdowns.

Gold Trade Plan 25/04/2025Dear Traders,
There is no strong bullish momentum observed in gold, and it seems to be moving within a descending channel. Meanwhile, the dollar index has entered a reversal phase. I expect the price to drop into the 3220–3230 zone to gather momentum, A new update will be shared soon.
If you enjoyed this forecast, please show your support with a like and comment. Your feedback is what drives me to keep creating valuable content."
Regards,
Alireza

XAUUSD possible rejection?XAUUSD has dropped to daily support with a long atr candle and has primarily got rejected with potential trend reversal. As with current price on 15min, is creating series of higher high and higher low may continue with an uptrend to the daily resistance line?
