GOLD Trade Plan 24/04/2024Dear Traders.
Price opened with + GAP , and i have 2 Scenario`s for Reversal ,
1- Reversal From 3290-3305 to Target 3400
2- Reversal From 3220-3240 To Target 3400
This recent drop suggests that we are likely in wave 4, and I expect another upward wave to follow. We need to wait and analyze the daily and weekly candles more closely.
If you enjoyed this forecast, please show your support with a like and comment. Your feedback is what drives me to keep creating valuable content."
Regards,
Alireza
USCGC trade ideas

Gold 100% Profit SignalGold has retreated from $3,500, is the price near a top? Possibly. But I wouldn't sound the alarm bells just yet. This is most likely due to some regular profit-taking. The high indicators are more of a warning than a call to arms. Rather than "get out of here," it's more of a "stay alert."
At present, the initial support below is in the 3405-3400 area. Further down are the two key support levels of 3380 and 3357. 3380 is the support level near the middle track of the 4-hour level, and 3357 is an important top and bottom conversion position in the previous period. These two positions still provide strong support for the future market rise. At present, the 4-hour level high has closed in a bearish pattern of Yin engulfing Yang engulfing, and the K-line is negative. The short-term is expected to improve and fall back. Short-term operations will mainly rebound from high altitudes. Pay attention to the resistance near 3435 and 3450 on the top and do not break the air. Pay attention to the support near 3408-3400 on the bottom. If it breaks, adjust the position and continue to look at 3380.

XAUUSD Gold Possible Move 23.04.2025Gold (XAUUSD) Technical Analysis – April 23, 2025
The market is currently showing bearish momentum following a retracement from the recent highs near the 3,500 mark. Price is now approaching key Fibonacci levels, presenting potential shorting opportunities for intraday and swing traders.
Key Levels to Watch:
📉 Short Opportunity 1:
Zone: 3400-3410 USD (Fibonacci 0.5 to 0.618)
Analysis: This is a premium supply zone and a retracement area aligning with the Fibonacci golden pocket. If the price revisits this region and shows bearish confirmation (e.g., bearish engulfing, rejections, or lower timeframe structure break), it's a high-probability short entry zone.
Signal: Look for price rejection patterns in this zone to initiate a short position.
Stop-Loss: 3,430
Target: 3,292 initially, then lower if structure breaks
📉 Short Opportunity 2 (Breakout Trade):
Zone: 3,292 – 3,300 USD (Major Support)
Analysis: This is a major support zone. A clean break below and successful retest from underneath would signal continuation to the downside.
Signal: Wait for a break and retest below 3,292 for confirmation before entering short.
Stop-Loss: Above 3,300 on retest
Target: 3,240 and potentially 3,215 – 3,220 zone
Overall Bias:
Bearish below 3,396. Price action confirms lower highs and lower lows. Structure supports selling rallies or breakdowns.

Gold Trade Plan 25/04/2025Dear Traders,
There is no strong bullish momentum observed in gold, and it seems to be moving within a descending channel. Meanwhile, the dollar index has entered a reversal phase. I expect the price to drop into the 3220–3230 zone to gather momentum, A new update will be shared soon.
If you enjoyed this forecast, please show your support with a like and comment. Your feedback is what drives me to keep creating valuable content."
Regards,
Alireza

XAUUSD possible rejection?XAUUSD has dropped to daily support with a long atr candle and has primarily got rejected with potential trend reversal. As with current price on 15min, is creating series of higher high and higher low may continue with an uptrend to the daily resistance line?

XAUUSD/GOLD: What happens when GOLD goes too high?Gold Price Soars Amid Geopolitical Tensions – Is There a Correction Coming?
As political tensions, especially the ongoing trade issues between the US and China, continue.
Showing Gold’s Safe Haven Status in These Uncertain Times.
- What’s Driving This Rise?
With investors always looking for safety and minimal risk, recent news surrounding new tariff threats and diplomatic tensions between the two economic giants has added to the interest in buying gold.
- So, Where Will the Gold Peak Stop? Is 3400 or 3500 .. the Final Peak?
🔼 Key Resistance Levels to Watch Are 3358 and 3380

Gold Price Analysis April 23Candle D has a clear bearish confirmation and the 4-line structure is being continuously sold, leading to the gold price falling nearly 200 prices from ATH.
Today's strategy will mainly be SELL following the market trend. At the end of the European session, the price breaks 3319, then wait for a retest to BUY up towards the resistance zones of 3379 - 3345. If it does not break 3319, then SELL Gold back to 3275 and 3247. Pay attention to the price reactions in the chart areas to have a reasonable BUY and SELL strategy.

GOLDJust some educational chart info that portrays success if you combine them into a powerful strategy. Enjoy

GOLD - WAVE 4 CORRECTION TO $2,800GOLD - WAVE 4 CORRECTION TO $2,800
This video analysis is leading on from our long term target for $6,200 which I posted yesterday. We can see from the strong impulse move up, the entire bullish cycle is not complete yet & has more upside, AFTER a healthy correction.
Confluences👇
⭕️Wave 3 Peaked at Psychological Number of $2,500 (LQ Point).
⭕️Wave 4 & 5 Pending.
⭕️Overbought Market Conditions.

How to grasp the ups and downs of market conditions?Judging from the 4-hour analysis, the lower support focuses on the 3310-3315 line, and the 3400-3410 line for short-term suppression. Be careful to pursue orders in sharply rising and falling markets, let alone heavy positions, and wait patiently for sufficient adjustments before entering the market.
Gold operation strategy:
Gold falls back to 3310-15 line, and covers long positions when it falls back to 3300 line, stop loss 3297, target 3400-3410 line, and continue to hold if it breaks;

> "Gold (XAU/USD) - Demand Zone Bounce Targeting 3500 "Current Price: $3,319.59
Indicator: 70 EMA at $3,324.95 ➡️ 📈 (still slightly above price = bearish pressure)
---
Main Observations:
🔵 Demand Zone (📦 Buyers' Area):
Between $3,253 - $3,280
Every time price dips here ➡️ buyers react!
✏️ Descending Trendline:
⬇️ Short-term trend is bearish
Price is trying to break above it now (watch closely!)
🎯 Target Point:
$3,500 🏹 (Big upside if breakout succeeds!)
🛡️ Stop-Loss:
$3,253 🔥 (just below the demand zone = good protection)
Trade Idea:
✅ Buy near demand zone 🔵 after breakout confirmation 📈
✅ Target: $3,500 🎯
✅ Stop-Loss: $3,253 🛡️
Quick Dots Summary:
🔵 Demand zone is strong (buyers defending)
🔻 Still under 70 EMA (bearish until breakout)
✏️ Watching for breakout of trendline = key signal
🎯 Massive Risk:Reward ratio if it works
⚡ If no breakout and price falls, stop-loss saves capital.

GOLD ROUTE MAP UPDATEHey Everyone,
A PITASTIC day on the charts with our targets getting smashed, confirmed with ema5 cross and lock to give us plenty of time to get in for the action.
After support and bounce from 3201 Goldturn into 3230 we stated that we will now look for a break and lock above 3230 for a continuation into the Bullish targets above. We got the lock opening the levels above hitting our Bullish target at 3261, followed with a further cross and lock opening 3292, which was hit perfectly and then our final lock for today above 3292 opened 3324 now complete - what a day!!!!!
We will now look for a lock above 3324 for a continuation into our final target 3352 or a rejection here will see price test the Goldturn below for support and bounce.
We will keep the above in mind when taking buys from dips. Our updated levels and weighted levels will allow us to track the movement down and then catch bounces up.
We will continue to buy dips using our support levels taking 30 to 40 pips. As stated before each of our level structures give 20 to 40 pip bounces, which is enough for a nice entry and exit. If you back test the levels we shared every week for the past 24 months, you can see how effectively they were used to trade with or against short/mid term swings and trends.
The swing range give bigger bounces then our weighted levels that's the difference between weighted levels and swing ranges.
BULLISH TARGET
3261 - DONE
EMA5 CROSS AND LOCK ABOVE 3261 WILL OPEN THE FOLLOWING BULLISH TARGET
3292 - DONE
EMA5 CROSS AND LOCK ABOVE 3292 WILL OPEN THE FOLLOWING BULLISH TARGET
3324 - DONE
EMA5 CROSS AND LOCK ABOVE 3324 WILL OPEN THE FOLLOWING BULLISH TARGET
3352
BEARISH TARGETS
3230 - DONE
EMA5 CROSS AND LOCK BELOW 3230 WILL OPEN THE FOLLOWING BEARISH TARGET
3201 - DONE
EMA5 CROSS AND LOCK BELOW 3201 WILL OPEN THE RETRACEMENT RANGE
3179
3152
EMA5 CROSS AND LOCK BELOW 3152 WILL OPEN THE SWING RANGE
3120
3094
EMA5 CROSS AND LOCK BELOW 3094 WILL OPEN THE SECONDARY SWING RANGE
SECONDARY SWING RANGE
3069 - 3038
As always, we will keep you all updated with regular updates throughout the week and how we manage the active ideas and setups. Thank you all for your likes, comments and follows, we really appreciate it!
Mr Gold
GoldViewFX

XAUUSD Market Update – April 23, 2025“Bulls Are Alive, But Not Rushing – Gold Builds in Discount Trenches 🏗️🟢”
🔍 Macro + Context
HTF Bias: Still bullish. Daily candle shows strong rejection wick from below 3280 → bulls defending structure.
LTF Flow: Bearish → Clean CHoCH + BOS chain (H1–M15) from 3455 ATH zone → currently building base.
Current Price: ~3294
RSI: Starting to climb from oversold on M15–M30 → first hints of a potential shift.
📈 Confirmed Structural Updates
🔻 Sell Zones (Premium)
Zone Range Type Confluences
🔴 3450–3455 ATH Supply HTF OB + 1.618 Fibo Liquidity + Rejection Block
🔴 3414–3422 NY Session OB Retest Zone M30 OB + Last Reaction High
🟠 3380–3395 Flip Zone H1–M30 Rejection Block EMA Lock + FVG + CHoCH
🟢 Buy Zones (Discount)
Zone Range Type Confluences
🟢 3280–3288 LTF Demand Reentry Zone M5-M15 OB + Recent Wick Defense
💚 3220–3235 HTF Demand Stronger Demand Zone H4 OB + D1 EQ zone + Weekly Pivot
🔵 3170–3190 Extreme Discount Long-Term Zone Untapped FVG + D1 OB
⚙️ Current Price Action
📍Price rejected perfectly from the 3260s → defended with strong wick, now reclaiming M15 internal CHoCH.
🟣 M5 showing micro BOS + reclaim of 9EMA → potential for bullish continuation toward 3320–3333.
⚠️ Flip Zone at 3380–3395 remains a major short-term decision level. If price breaks above it, we’ll be in recovery mode toward 3415.
🎯 Session Outlook
Buyers in control short-term if price holds above 3280.
Next key reaction expected at 3320–3333 minor resistance → if broken, bulls might retest 3385+.
Sellers may reengage hard at 3380–3395 or above (3422, 3455).
🧠 Smart Money Snapshot
🟢 Liquidity swept below 3280 = engineered low
🟠 Internal CHoCH on M5 confirmed → LTF bullish short-term
🔴 Next sell interest likely around 3385 or 3415 unless HTF flips bullish again
XAUUSD – News & Risk Preview for April 24, 2025
Claims & Chaos?🧨📉📈
🔍 What’s Coming:
🧾 Unemployment Claims (USD) – 14:30 UTC+2
➤ Expected spike in volatility. Watch for algo-driven whipsaws if numbers surprise (especially under 200k or above 250k).
➤ Low claims = strong USD = potential XAU drop.
🧠 Tactical Advice for Thursday:
Avoid full-size entries→ spikes can violate structure briefly before returning.
Focus on reaction-based trades: let price show direction after the event, then join.
Best plan: pre-mark levels now, react later.
🗣️ Final Note
This market update reflects structure-only precision, no emotional bias. If bulls want back in, 3280–3290 is the launchpad. If not, sellers are watching 3385+ like hawks. 🦅

Gold 100% Trading StrategyGold prices continued to fluctuate this week. Last Thursday, gold prices stabilized and rebounded near $3,284, and remained strong after breaking through $3,300. During today's Asian session, gold prices repeatedly hit the 3,385 pressure level but failed. After retreating to around 3,369 and gaining support, they rebounded again to around 3,396. The current price faces technical repair needs, but the overall upward trend has not changed, and the probability of breaking through the $3,400 mark is still high. The support level of the retracement is focused on the Asian session low of 3369 US dollars and the 4-hour MA5 moving average of 3360 US dollars. You can arrange long orders on dips; the upper pressure focuses on the 3396-3400 line. After breaking through, you need to be alert to the pressure of the daily error band indicator of 3425-3430 US dollars. At present, you can go short at the rebound of 3395 in the short term. The general trend is still dominated by low and long.
Gold recommendation: Go short near the rebound of 3395-3400, stop loss 3405, target 3370, strict stop loss for large fluctuations
Gold operation: Go long near the retracement of 3370-3375, stop loss 3362, target 3400, strict stop loss for large fluctuations

XAUUSD Analysis Today: Technical and Order Flow !In this video I will be sharing my XAUUSD analysis today, by providing my complete technical and order flow analysis, so you can watch it to possibly improve your forex trading skillset. The video is structured in 3 parts, first I will be performing my complete technical analysis, then I will be moving to the COT data analysis, so how the big payers in market are moving their orders, and to do this I will be using my customized proprietary software and then I will be putting together these two different types of analysis.

Gold's decline under pressure is in line with expectations!At present, the short-term suppression level can refer to $3315, and the higher level is $3328. For short-term investors, you can consider waiting for the gold price to rebound to around $3315 to arrange short orders and continue to be bearish on the gold price. The first thing to pay attention to below is the support of the low point just touched at $3287. If this support level is lost, the next key support level will be $3260, the first low point on the previous downward journey. If $3260 is also effectively broken, the short-selling force will be further released, and the gold price may face a larger decline. In terms of the short-term operation of gold, Jin Shengfu recommends rebounding short selling as the main method, and callback long selling as the auxiliary method. The short-term focus on the upper side is the 3315-3320 line of resistance, and the short-term focus on the lower side is the 3285-3260 line of support.

Gold short-term analysisGold daily line fell 240 dollars from the top of 3500. At present, 3500 is under short-term pressure. Whether the adjustment is over or not cannot be confirmed. The short-term 4-hour middle track 3380 has been lost and converted into a key resistance!
The 1-hour level K-line is under pressure and ma10 and ma5 continue to fall. After yesterday's consolidation and pull-up in the NY market, the K-line has now re-run above ma10, plus macd is under the zero axis. The rapid decline of 200 dollars has almost corrected most of the upward trend. If it continues to fall, it may start to build a bottom with the help of the bottom divergence, and then start the next round of gains!
Today is also a critical day for gold. After the bottom of 3260, today's strength is very important. If gold continues to rise directly today without a big correction, it means that gold may start to fluctuate and rise again.
Key points:
First support: 3320, second support: 3300, third support: 3288
First resistance: 3360, second resistance: 3376, third resistance: 3400
Operation ideas:
Buy: 3315-3318, SL: 3306, TP: 3340-3360;
Sell: 3387-3390, SL: 3400, TP: 3370-3350;

XAUUSD Downtrend Continues- Is 3,175 the Next Stop?OANDA:XAUUSD is currently trading within a well-defined descending channel, with price action consistently forming lower highs and lower lows. This structure reflects sustained bearish momentum, and sellers continue to dominate the overall direction.
The recent upward move appears to be a technical rebound, with price approaching a potential resistance zone near the upper boundary of the channel. This area may now serve as a supply zone after acting as previous support, making it an important region for potential rejection.
If the resistance holds, a rejection here could lead to the continuation of the bearish trend, with a potential move targeting the support area around 3,175, aligning with the lower boundary of the descending channel.
However, failure to hold below this level could invalidate the bearish scenario and increase the likelihood of a retest toward the upper boundary of the channel.
Traders should monitor for clear rejection signals at resistance, such as bearish engulfing candles or strong rejection wicks, or alternatively, wait for breakout confirmation before considering a trend shift. As always, proper risk management remains essential.

XAUUSD 30M CHART PATTERNThe chart you've shared is a 30-minute candlestick chart for XAU/USD (Gold Spot vs U.S. Dollar), and it shows a classic bullish pattern setup. Here's a breakdown:
Highlighted Zones:
Take Profit: The green zone at the top suggests the target price level where you might want to close your trade for profits.
Stop Loss: The red zone below indicates the level where you'd exit the trade to limit losses if the price moves against you.
Pattern:
The orange circles highlight a potential inverse head and shoulders pattern (a bullish reversal pattern).
The blue arrow suggests a bullish move, likely a breakout above the neckline (resistance) of this pattern.
Current Price Action:
Price is at 3,383.020 at the moment of the screenshot.
The chart suggests a possible short-term pullback before continuing upward toward the take profit zone.
This setup implies a long (buy) trade based on technical analysis, anticipating continued upward movement if the breakout holds.
Would you like help setting up a trading plan or risk management strategy based on this chart?

DON'T Make This MISTAKE in MULTIPLE TIME FRAME Analysis
Most of the traders apply multiple time frame analysis incorrectly . In the today's article, we will discuss how to properly use it and how to build the correct thinking process with that trading approach.
The problem is that many traders start their analysis with lower time frames first . They build the opinion and the directional bias analyzing hourly or even lower time frames and look for bullish / bearish signals there.
Once some solid setup is spotted, they start looking for confirmations , analyzing higher time frames. They are trying to find the clues that support their observations.
However, the pro traders do the opposite .
The fact is that higher is the time frame, more significant it is for the analysis. The key structures and the patterns that are spotted on an hourly time frame most of the time will be completely irrelevant on a daily time frame.
In the picture above, I underlined the key levels on USDJPY on an hourly time frame on the left.
On the right, I opened a daily time frame. You can see that on a higher time frame, the structures went completely lost.
BUT the structures that are identified on a daily, will be extremely important on any lower time frame.
In the example above, I have underlined key levels on a daily.
On an hourly time frame, we simply see in detail how important are these structures and how the market reacts to them.
The correct way to apply the top-down approach is to start with the higher time frame first: daily or weekly. Identify the market trend there, spot the important key levels. Make prediction on these time frames and let the analysis on lower time frames be your confirmation.
❤️Please, support my work with like, thank you!❤️
I am part of Trade Nation's Influencer program and receive a monthly fee for using their TradingView charts in my analysis.

XAU.usd watch the 22's: 3,322 then 3,222 likely targets for dip Gold may have topped, unless bulls can hold $3,322.95
Looking for minimum first Target zone $3258.64-3259.57
After a bounce we may see another leg down to $3222.15
It topped "for good" then we will quickly hit major support $3062.69-3082.58
.
Previous Analysis that caught the last Bounce at $2,964 EXACTLY:
===================================================================

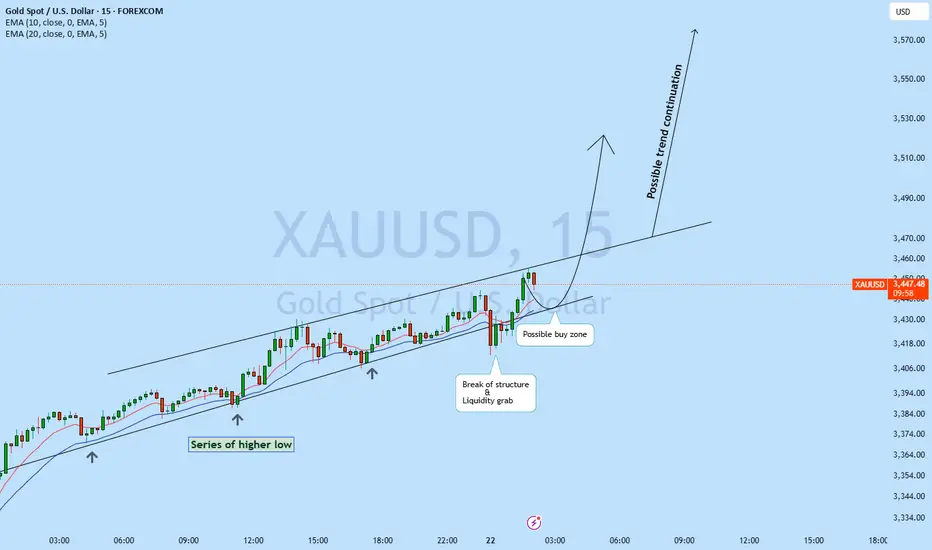
XAUUSD possible buy zone!XAUUSD is moving in the major direction of the rend with series of higher high and higher low
with multiple liquidity grab. Currently upon daily close, there has been a break of structure with strong liquidity grab giving this instrument a strong probability to move back to the upside with new moment. Upon pullback to the trend line is an area looking to buy upon price action confirmation.
XAUUSD BUY SETUP ,Bought at $3352XAUUSD BUY SETUP
Currently $3355
Bought at $3352
(Trading plan XAUUSD down up to $3330 we will add more buy)
Expecting target ($3376 0R UP )
Incase of early exist will update this anaylsis
Its not a Financial Advice
