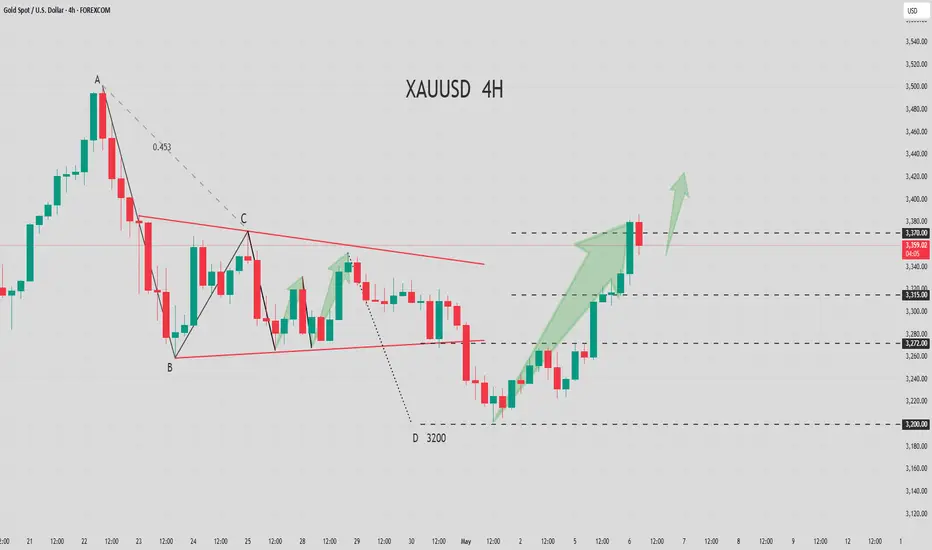
XAUUSD latest analysis strategyWave ABC which is currently in wave B in a corrective triangle of five waves abcde
and could continue to fall for wave C to $3166
Main and important resistance 3360
Short resistance 3321
USCGC trade ideas

Hellena | GOLD (4H): SHORT to 38.2%-50% Fibo lvl 3228.Colleagues, last week we got a stoploss, but I still believe that we should expect a correction in wave “2”. We will try to catch this movement this week.
I believe that the price will correct to the area of Fibonacci 38.2% - 50% levels (3228.41).
Perhaps the price will slightly renew the maximum of wave “1”, reaching the level of 3438. In this case I recommend to work with pending limit sell orders.
And some data:
The prevalence of bulls according to CME reports additionally increased by 13%.
The 23% increase in market volume, meanwhile, indicates a likely strong momentum pattern during the trading week.
Despite the 13% increase in buyers, selling patterns towards the balance level of the week (3200.00) are recommended for the current trading week.
Manage your capital correctly and competently! Only enter trades based on reliable patterns!

The buy low and long strategy is coming!From the 4-hour analysis, the support below is around 3308-3300. If it does not break, the main bullish trend will remain unchanged. The upper side pays attention to the short-term suppression of 3360-66. The daily level stabilizes above this position and continues to maintain the low-multiple rhythm.
Gold operation strategy:
1. If gold falls back on the 3325-3320 line, go long, and if it falls back on the 3310-3300 line, it will cover long positions. The target is 3355-3360.

Will gold fall if the Fed remains on hold?In its latest resolution, the Federal Reserve announced that it would maintain interest rates unchanged, but it also warned of "increased risks of rising inflation and unemployment" in a rare move. This statement indicates that the Federal Reserve is facing the most complex policy choices in recent years: on the one hand, there is high inflationary pressure, on the other hand, there is a potentially deteriorating job market, and the Trump administration's tariff policy casts a shadow on the economic outlook. Will the interest rate cut that the market expects come as expected? How long can the Fed's "wait-and-see" strategy last? I think the next window for the Fed to cut interest rates will not appear until September or later. The Fed itself expects only two interest rate cuts this year, while the market expects three interest rate cuts.

The most important golden strategy📌Fundamentals:
Focus on the Federal Reserve's interest rate decision
📊Technological aspects:
From the golden hour chart, the Asian market is in line with a wave of continued gains and the subsequent adjustment to the 10 moving average of 3350 has stabilized. The European market has slowly moved higher and is approaching the Asian market high. This pattern is still very strong, and there is a high probability of a second rise tonight; The 10 EMA is above 3370 as the primary support and continues to be bullish. As each line closes, the moving support will slowly move up. As long as it does not effectively break, the short squeeze will continue. A breakthrough of 3410 will also happen at any time. If it breaks through, it will be easy to continue to storm above 3420. If it rushes higher and falls back in the evening and falls below the 10 EMA, then If it adjusts to the middle track for the first time, there will still be good support, just continue to be bullish; comprehensively speaking, today's short-term gold operation ideas suggest that the callback is mainly long, and the rebound is supplementary.
🎯 Practical Strategy:
Short strategy: short gold when it rebounds around 3425-3430, target around 3400-3380.
Long strategy: long gold when it pulls back around 3365-3370, target around 3400-3420.

Gold is stimulated to rise stronglyGold has risen strongly as a safe haven, breaking the shock of last week. The current 3328 line is under strong pressure again, and it is recommended to short. Gold has risen and reached the key resistance level in the previous period. Gold has broken through upward without falling back, which means there is no opportunity to go long. First look at the short side to see if it will fall back and adjust. Gold operation is recommended to short on rebound and go long on pullback. Focus on the resistance level of 3330 and the support level of 3260.

Will gold prices rise again this week?As the US dollar is approaching the key middle track of the daily line, it is not far away. In the next two days, it is expected to end the rebound correction and continue to start a weak trend decline. Therefore, gold may also have a short-term bottom at any time in the next two days. The next step is to wait for a wave of pullback. At least the bottom low point of the previous convergence triangle of 3260-3270 will be tested and confirmed. After the test, if it cannot stand under pressure, there may be a second bottom test, a secondary low point or a double bottom, and then finally start a unilateral rise all the way; of course, if 3200 is not the low point of tonight, and the lower shadow of the daily closing is short, then it may be necessary to test the last 3175 position before determining the short-term bottom;

The bulls return strongly and continue to buy after the retracemCurrently, gold is fluctuating around 3360. Wait patiently for the opportunity to go long when it falls back. Below, we continue to pay attention to the short-term support at 3350-54, and focus on the important support at 3336-40. In terms of operation, we mainly go long on pullbacks. Be a prudent trader and take profits within your cognition. I have been waiting for your participation. If your current gold operation is not ideal, I hope I can help you avoid detours in your investment. Welcome to communicate with me!
From the 4-hour analysis, gold bulls are making another strong impact. On the top, we pay attention to the short-term suppression of 3385-90 and the suppression of 3400. On the bottom, we pay attention to the short-term support of 3350 and the important support of 3336-40. In terms of operation, we mainly buy when the price falls back. In the middle position, we should watch more and do less, and follow orders cautiously, and wait patiently for key points to enter the market.
Gold operation strategy:
Gold falls back to 3350-53 and buys more when it falls back to 3336-40. Stop loss 3327, target 3380-3385, and continue to hold if it breaks;

NFP market, looking for opportunities to short goldFundamentals:
Mainly focus on today's NFP market;
Technical aspects:
Gold rebounded near 3200 and has gradually rebounded to around 3265. This wave of rebound is not surprising. After all, I have been insisting on short-term long gold since yesterday, and I have also gained a good profit. As gold falls and breaks through many key supports, my expectations for the magnitude of this rebound are not high. In the short term, it will first face resistance in the 3270-3275 area, and secondly, it will face resistance in the 3285-3295 area.
Moreover, the rebound and rise of gold before the NFP market is very confusing in itself. It is not ruled out that it is to pave the way for the sharp drop in the NFP market. Once gold falls again, it is likely to fall below 3200 and continue to around 3180.
Trading strategy:
1. Consider shorting gold when it rebounds to 3270-3280, TP: 3240-3230;
2. Consider continuing to short gold when it rebounds to 3280-3290, TP is the same as above.

GOLD ROUTE MAP UPDATEHey Everyone,
Great start to the week with our chart idea playing out perfectly inline with our plans to buy dips.
We got our bearish targets 3306 and then into the retracement range like we analysed and then the perfect bounce now heading towards our Bullish targets.
We will look for a test and break above 3344 for a continuation or failure to test and lock above this level will se price play back into the lower Goldturns for support.
We will keep the above in mind when taking buys from dips. Our updated levels and weighted levels will allow us to track the movement down and then catch bounces up.
We will continue to buy dips using our support levels taking 30 to 40 pips. As stated before each of our level structures give 20 to 40 pip bounces, which is enough for a nice entry and exit. If you back test the levels we shared every week for the past 24 months, you can see how effectively they were used to trade with or against short/mid term swings and trends.
The swing range give bigger bounces then our weighted levels that's the difference between weighted levels and swing ranges.
BULLISH TARGET
3344
EMA5 CROSS AND LOCK ABOVE 3344 WILL OPEN THE FOLLOWING BULLISH TARGETS
3367
POTENTIALLY 3390
EMA5 CROSS AND LOCK ABOVE 3390 WILL OPEN THE FOLLOWING BULLISH TARGET
3428
EMA5 CROSS AND LOCK ABOVE 3428 WILL OPEN THE FOLLOWING BULLISH TARGET
3458
EMA5 CROSS AND LOCK ABOVE 3458 WILL OPEN THE FOLLOWING BULLISH TARGETS
3478
POTENTIALLY
3503
BEARISH TARGETS
3306 - DONE
EMA5 CROSS AND LOCK BELOW 3306 WILL OPEN THE RETRACEMENT RANGE
3285 - DONE
3259
EMA5 CROSS AND LOCK BELOW 3259 WILL OPEN THE SWING RNGE
3233
3201
EMA5 CROSS AND LOCK BELOW 3201 WILL OPEN THE SECONDARY SWING RANGE
SECONDARY SWING RANGE
3159 - 3112
As always, we will keep you all updated with regular updates throughout the week and how we manage the active ideas and setups. Thank you all for your likes, comments and follows, we really appreciate it!
Mr Gold
GoldViewFX

Gold continued to rise at the opening and broke upward!The current 4-hour chart of gold has formed an upward breakout trend, and it will continue to strengthen next! In the intraday, we focus on the 3200-line long-short watershed. Before gold falls further, gold will maintain a bullish trend. If gold wants to move out of a steady upward trend, it will not fall below the 3222 line during the day. In the short term, we refer to the points above 3222 to arrange long positions! In terms of operation, it is recommended to adjust the thinking, go long on the decline to 3240-3245 or directly chase the rise after breaking through 3270. At present, it is already long at 3243, and there is no more decline to continue long! Identify the long position during the day! On the whole, today's short-term operation of gold is recommended to focus on callbacks and short on rebounds. The short-term focus on the upper side is 3300-3310 resistance, and the short-term focus on the lower side is 3222-3245 support.

Gold Price Analysis May 8D1 candlesticks started to show some selling pressure but were still pushed back by buyers at the beginning of today's Asian session
Gold is falling at the end of the Asian session towards 3373. BUY zones are noted at the support zones that buyers are waiting for first 3373-3353-3338
On the opposite side, the sell borders 3405 and 3424 are considered for scalping when the price pushes up. These are data analyzing price zones with strong buying and selling pressure in the past, paying more attention to the current price reaction to have the best trading strategy.

GOLD - single supporting area, holds or not ??#GOLD.. well guys market moved perfect as per our analysis in perveious ideas.
Now market just reached at his single supporting area 3290-91
That is market current supporting area so keep close and keep in mind that we will go for cut n reverse below that.
Good luck
Trade wisely

Gold new Update 🧠 Chart Analysis Summary:
Current Price: Around 3,240.610.
Resistance Zone: 3,256 – 3,264 (highlighted in orange).
Support Zone: Around 3,220 (highlighted with a green target).
Chart Pattern: Looks like a possible liquidity grab above before a potential sell-off (indicated by the hand-drawn zig-zag upward move and large downward arrow).
🎯 Trade Setup Suggestion (Short Position):
Entry: Around 3,256 – 3,264 (wait for price to enter this supply/resistance zone).
Stop Loss (SL): Just above 3,270, ideally at 3,273 (above the marked resistance).
Take Profit (TP): Around 3,220, as marked on the chart (support area).
⛳ Summary:
Risk: ~10–15 points.
Reward: ~35–40 points.
Risk-to-Reward: Roughly 1:3, which is favorable.

NF fluctuates in a downward trend⭐️GOLDEN INFORMATION:
China’s Ministry of Commerce announced Friday that the United States has recently initiated communication through official channels, expressing interest in reopening talks on tariffs. Beijing is currently evaluating the proposal, fueling optimism that a resolution to the prolonged tariff standoff between the world’s two largest economies may be on the horizon.
This renewed hope for a breakthrough in trade negotiations helped lift the US Dollar to a three-week high on Thursday, pressuring Gold prices down toward the $3,200 mark. However, bullish momentum for the USD remains tempered as markets increasingly price in the likelihood of more aggressive rate cuts by the Federal Reserve, especially with the closely watched US Nonfarm Payrolls data looming.
⭐️Personal comments NOVA:
NF news volatility is certain, with the big accumulation from last week. Gold price has confirmed the trend after breaking 3267, will fluctuate in a downtrend below 3200
⭐️SET UP GOLD PRICE:
🔥SELL GOLD zone : 3312- 3310 SL 3317
TP1: $3290
TP2: $3280
TP3: $3270
🔥BUY GOLD zone: $3175 - $3177 SL $3170
TP1: $3185
TP2: $3200
TP3: $3210
⭐️Technical analysis:
Based on technical indicators EMA 34, EMA89 and support resistance areas to set up a reasonable SELL order.
⭐️NOTE:
Note: Nova wishes traders to manage their capital well
- take the number of lots that match your capital
- Takeprofit equal to 4-6% of capital account
- Stoplose equal to 2-3% of capital account

( Gold ) Bearish Reversal Setup via Head and Shoulders Pattern Gold is showing signs of a potential short-term bearish reversal as a clear Head and Shoulders pattern has formed on the 30-minute chart. The price is testing the neckline near 3394, where a breakdown could trigger a move toward the 3330–3320 support zone.
🔍 Technical Analysis:
Pattern: Classic Head and Shoulders, indicating a possible shift in market structure.
Neckline level: Around 3394 – a break below confirms the pattern.
Indicator. Price is testing the lower boundary of the cloud; a clean break through supports the bearish case.
Volume Observation: Decreasing volume on right shoulder, suggesting buying momentum is fading.
Bearish Targets: Projected move based on pattern structure points toward 3330–3320.
🧠 Fundamental Backdrop:
U.S. Dollar Strength: Recent hawkish Fed comments and stronger-than-expected U.S. economic data are boosting the USD, putting pressure on gold prices.
Interest Rate Outlook: Rising yields are reducing gold’s appeal as a non-yielding asset.
Geopolitical Calm: Lack of fresh geopolitical tensions reduces safe-haven demand temporarily.
Inflation Outlook: Stabilizing inflation may also reduce urgency for gold hedging.
💡 Trade Plan:
Short Entry: 3394 (after neckline break confirmation)
Target Zone: 3330–3320
Stop Loss: Above 3410
Risk-Reward Ratio: ~2:1 depending on final entry/exit points
Must Support Me Share My Idea With Your Firends Mention Your Feed back Comment Section
📌 Note: Wait for confirmation with a strong candle close below the neckline and increased volume before entering the trade. This is not financial advice. Please conduct your own research and manage risk accordingly.

XAUUSD:The bullish forces make a strong comeback.Yesterday, the gold market soared with an impressive rally. It started rising during the Asian trading session, continued the upward trend in the European session, and witnessed a further surge in the American session. Eventually, it closed at a high level, fully demonstrating the strong comeback of the bullish forces, which is by no means a short-term rebound. In the early trading session of today, we precisely seized the opportunity and placed two long positions near $3,325. Currently, we have successfully locked in the profits after the price reached a peak.
In the following period, we will focus on the price correction and pullback. Once the price stabilizes after the pullback, we will maintain a bullish outlook. If the price moves steadily during the European trading session, we can temporarily adopt a wait-and-see attitude. If the upward trend continues, the pullback before the American trading session will be an excellent opportunity to follow up. Overall, based on the judgment that the Asian, European, and American trading sessions will maintain a continuous upward trend in tandem, we will keep seizing opportunities to go long.
In the future, we will continue to monitor the market changes and update the trading strategies in real time.
I am committed to sharing trading signals every day. Among them, real-time signals will be flexibly pushed according to market dynamics. All the signals sent out last week accurately matched the market trends, helping numerous traders achieve substantial profits. Regardless of your previous investment performance, I believe that with the support of my professional strategies and timely signals, I will surely be able to assist you in breaking through investment bottlenecks and achieving new breakthroughs in the trading field.
Gold Hits Key Resistance – Will It Break Out or Pull Back? Gold has been moving in a downtrend, and there's a clear descending trendline marked in red. The price has just reached that trendline right around the 3316 level, which also aligns with a horizontal resistance at 3329 — making this a very strong resistance zone.
The price surged from the support area near 3224, breaking through minor resistances until it reached the current level. But what we need to keep an eye on is that momentum indicators like MACD and Stochastic below the chart are starting to show overbought signals, which could mean the price might pull back or at least slow down.
🎯 Expected scenario now:
If the price fails to break above 3329 and can't push through the trendline, we might see a corrective drop toward 3269, and possibly down to 3224 again.
However, if the price breaks above this zone with strong volume and holds above it, we could see a continued bullish move toward 3352 — which looks like an ideal selling zone.

Gold is trading at bearish market cycleGold is trading at bearish side of market cycle. Trying to attain its average value by mean reversion. Fundamentally heat of tariff war appears to be settling.

GOLD The Target Is DOWN! SELL!
My dear friends,
My technical analysis for GOLD is below:
The market is trading on 3377.8 pivot level.
Bias - Bearish
Technical Indicators: Both Super Trend & Pivot HL indicate a highly probable Bearish continuation.
Target - 3357.7
Recommended Stop Loss - 3387.7
About Used Indicators:
A pivot point is a technical analysis indicator, or calculations, used to determine the overall trend of the market over different time frames.
Disclosure: I am part of Trade Nation's Influencer program and receive a monthly fee for using their TradingView charts in my analysis.
———————————
WISH YOU ALL LUCK

GOLD falls sharply then recovers slightly from key confluenceOANDA:XAUUSD fell sharply and recovered slightly, as expectations of more such deals increased after US President Donald Trump announced a “groundbreaking” trade deal with the UK, undermining the metal’s appeal as a safe-haven asset.
The US and UK have reached a deal and markets are expecting more “tariff-free” avenues
Trump and UK Prime Minister Keir Starmer jointly announce the signing of a trade deal
• The UK will reduce tariffs on US goods from 5.1% to 1.8%;
• The US will maintain a uniform tariff of 10% on UK imports;
• The UK will further ease market access for US goods.
The US and China will continue high-level talks this Saturday
US Treasury Secretary Scott Bessent and Trade Representative Jamieson Greer will meet with top Chinese economic officials in Switzerland on Saturday to discuss the outlook for trade relations.
Gold prices have hit record highs in recent months, largely due to global tensions caused by Trump's tariff policies.
China's central bank allows banks to buy foreign currency to import gold, signaling potential support
The People's Bank of China has approved commercial banks to buy foreign currency in the latest quota to pay for gold imports, supporting the possibility of increased physical gold demand in the market in the future.
With the implementation of the US-UK agreement, the recovery of risk appetite in the market and the approaching US-China negotiations, the safe-haven demand for gold has temporarily eased, and technical downward pressure has also emerged.
In addition, traders need to pay special attention to geopolitical developments with the focus on Russia - Ukraine when Ukraine has taken actions despite Russia's warnings on May 9.
Any escalation of the conflict will immediately support gold's sudden price increase.
Analysis of OANDA:XAUUSD technical outlook
On the daily chart, after a sharp decline from the weekly target of $3,430, gold's decline has paused and recovered slightly from the 0.382% Fibonacci retracement level. The area around $3,292 is also an important support area as it is a confluence of important technical support factors, with the appearance of EMA21 (major support), the lower edge of the price channel which is the short-term trend price channel and the 0.382% Fibonacci retracement level.
As long as gold remains above $3,292, it still has a bullish outlook in the short term, and in case gold falls below this level, it will likely test technical support at $3,267 in the short term, more than $3,245.
For the day, with the current position, gold still has a bullish outlook, and the notable points will be listed as follows.
Support: $3,300 – $3,292 – $3,267
Resistance: $3,351 – $3,371
SELL XAUUSD PRICE 3334 - 3332⚡️
↠↠ Stop Loss 3338
→Take Profit 1 3326
↨
→Take Profit 2 3320
BUY XAUUSD PRICE 3259 - 3261⚡️
↠↠ Stop Loss 3255
→Take Profit 1 3267
↨
→Take Profit 2 3273

Start shorting gold and seize the opportunity to make a profit!!Fundamentals:
Focus on Trump and the Fed
Technical aspects:
Gold fell back to around 3253 and then rebounded, and continued to rise to around 3318. The upward momentum in the short term looks particularly strong. According to the current structure, as gold gradually rebounds, off-market buying funds gradually enter the market, pushing gold further up. However, when facing the previous turning point position area of 3325-3335, the market is cautious and it is difficult to break through this area in a short period of time. Therefore, when gold gradually approaches the 3325-3335 area, gold may usher in a wave of retracement in the short term; obviously, the retracement area we can foresee is the 3295-3285 area first.
Trading strategy:
Consider shorting gold in the 3315-3325 area, TP: 3295-3285

GOLD - Bearish Head and ShouldersHello Traders !
The GOLD price formed a head and shoulders pattern.
Currently, The neckline is broken !
So, I expect a bearish move📉
_______________
TARGET: 3170🎯
