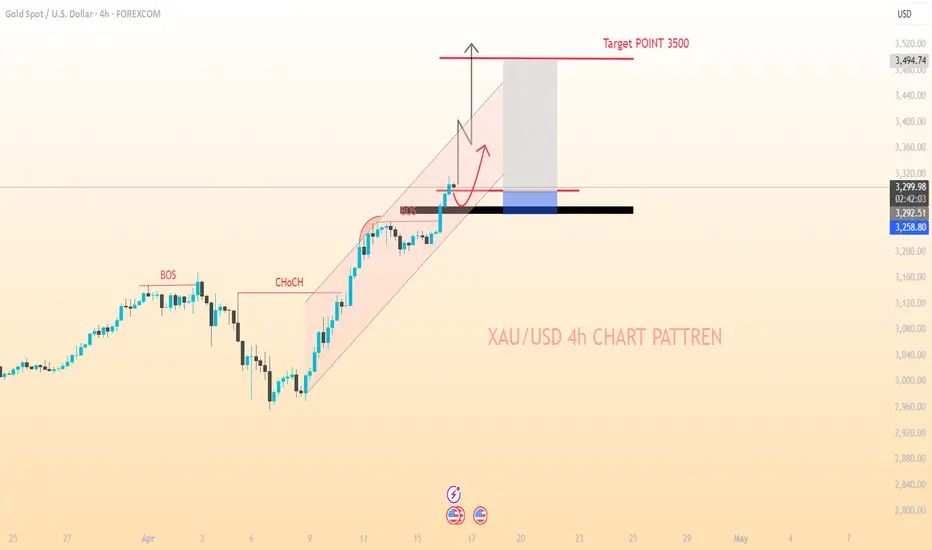
XAU/USD...4h ChartPattrenMY gold trading signal looks clear and concise. Here's a breakdown of the key elements:
*Signal Details*
1. *Entry Price*: 3296
2. *Target Price*: 3500
3. *Stop Loss*: 3250
4. *Sentiment*: Bullish, indicating strong momentum in gold prices.
*Format and Updates*
1. *Text Format*: The current format is straightforward and easy to understand. It's great for quick communication and can be easily shared via text or messaging platforms.
2. *Graphic Version*: Creating a graphic version could enhance visual appeal and make the signal stand out. You could include:
- A chart showing the entry point, target, and stop loss.
- Icons or colors to highlight bullish sentiment.
- Additional information like current price, potential profit/loss, and risk level.
*Considerations for Future Signals*
1. *Consistency*: Keeping a consistent format for your signals can help recipients quickly understand and act on them.
2. *Additional Information*: Consider including more details such as:
- Time frame for the signal (short-term, long-term).
- Rationale behind the signal (technical indicators, news, etc.).
- Risk management tips specific to this trade.
3. *Update Frequency*: Decide how often you'll update the signals. Regular updates can keep recipients informed about market changes.
*Next Steps*
- *Feedback*: Gather feedback from your audience on the preferred format and content of the signals.
- *Automation*: If you're planning to send out signals frequently, consider automating the process using trading software or platforms that can generate and send signals based on predefined criteria.
- *Education*: Provide educational resources or explanations about the signals and trading strategies to help recipients understand and make informed decisions.
Would you like to explore creating a graphic template for your signals or discuss ways to automate signal generation and distribution?
USCGC trade ideas
Gold price breaks down: Will gold price continue to rise?At the short-term 4-hour level, the intraday rebound was under pressure from the middle track downward. At present, the K-line has returned to run below the moving average. The short-term trend is bearish. The market may further test the support near the lower track 3240. The short-term upper pressure focuses on the pressure near 3315, which is near the ma5 moving average. Above it is the pressure near the middle track that has moved down to 3338. Relying on these two suppressions tonight, there is still room for further decline, pointing to the previous day's low of 3260. If it continues to break through here, then the first attempt at bottom speculation may be close.

XAUUSD Sells on possible tariffs reduction on ChinaFX:XAUUSD
XAUUSD
✏️Gold has rose roughly 30% since Trump took office in Jan 20 early this year, trading at about 2,700 per ounce, to highest at 3,500 on 22 April. Price has recently also reacted off the 0.79 fibre zone, giving a fantastic reaction upside, but failed to break above the HTF Resistance.
🔖Trump recently has also mentioned that he would not fire Fed Chair Jerome Powell, and we could see him lowering his 'tough guy' attitude towards China. On his recent speech in the Oval Office he said “I'm not going to say, oh I’m going to play hardball with China, I’m going to play a hardball with you, President Xi”, and “we’re going to be very nice”.
📌On the other hand, a White House official mentioned about possible reduction of the 145% tariffs to less than half of its current charges. Note that, this happened before the China's foreign ministry spokesperson Guo JiaKun clarified that the two countries had not held any negotiations on the tariffs, and reached to any agreements. Treasury Secretary Scott Bessent did mention about the rates being 'unsustainable', as well as Powell warning about Trump's tariffs worsening inflation and slowing the economy. From these sources, we could perceive it as, the US may desperately need the negotiations with China, than vice versa.
📌As mentioned by Radomski ( news article referred below), we could be experiencing the ‘Buy the Rumour, Sell the News' effect, where investors sought to buy low risk investment products, such as Gold at the beginning of the year due to expected tariffs implementation and trade wars, and selling safer investment products when they see better opportunities. Rarely, we experience ATHs after ATHs without significant corrections. Therefore in this scenario, we could expect at least a few % of short term correction in the near future.
Let me know what you guys think!
🔗Sources: www.investing.com
www.reuters.com
spectrumlocalnews.com

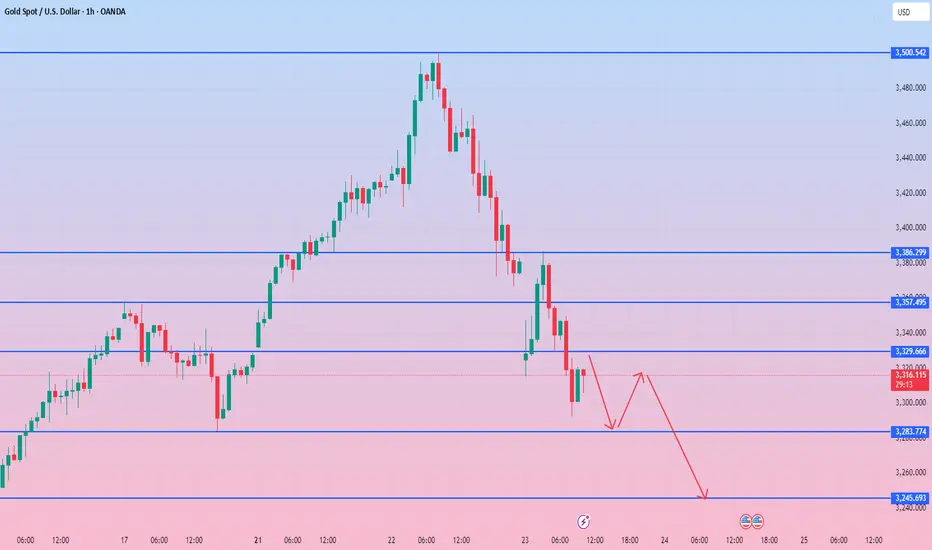
Gold analysis strategy ideasInternal Trendline (Breakout): The previously respected trendline has now been broken, indicating a possible shift in trend.
Supply and Demand (S&D) Zone: Located around the $3,280 to $3,300 area.
Bearish Rejection Zone: The price tried to push higher to the $3,360 to $3,380 resistance level but failed to break through.
Arrow indicates bearish target: The price is expected to fall towards $3,245.94.
The internal bullish trendline has been decisively broken, which is a classic sign of a trend reversal or at least a sharp correction.
After the breakout, the price retested the lower trendline but failed to recover and showed bearish pressure.
There was a clear rejection at the supply zone ($3,360 to $3,380), which is confirmed by the long shadows and bearish candlestick pattern.
This confirms the presence of sellers and a possible setup at this level.
The Point of Control (POC) and high volume node are located around the $3,245 area, which also aligns with a clear bearish target.
Price may move towards this level as this area is a reasonable value area for previous consolidation.
The previously bullish demand zone (around $3,280) has now become a resistance level, confirming the shift in market sentiment.
Target: $3,245.94
Confirmation: Failure to close above $3,360 and continued lower highs indicate that the bearish trend will continue.
This chart shows that gold spot (XAU/USD) is bearish in the short term and may fall to the $3,245 area. Traders may consider watching for signs of continued bearish price movement and possible expansion of volume in the next leg of decline to confirm the decline.

XAUUSD Sniper Plan – April 24, 2025🟡 XAUUSD Sniper Plan – April 24, 2025
Post-Claims Setup | No Bounce Nonsense. Just Zones That Hit.
🔻 SELL ZONES – Premium Rejections Only
SELL #1 – 3384–3392
📌 HTF Flip Zone + FVG + EMA100
SL: 3400 | TP1: 3355 | TP2: 3320 | TP3: 3288
SELL #2 – 3408–3416
📌 Imbalance Gap 3411 + OB + NY Spike
SL: 3425 | TP1: 3375 | TP2: 3345 | TP3: 3315
SELL #3 – 3448–3455
📌 HTF OB + Fibo Extension + Trap Risk
SL: 3465 | TP1: 3415 | TP2: 3380 | TP3: 3340
🟢 BUY ZONES – Real Demand Only
BUY #1 – 3310–3316
📌 CHoCH + M30 OB + RSI Divergence
SL: 3300 | TP1: 3340 | TP2: 3370 | TP3: 3390
BUY #2 – 3275–3285
📌 HTF Demand Base + Oversold RSI
SL: 3260 | TP1: 3310 | TP2: 3340 | TP3: 3370
🧠 STRUCTURE & BIAS
• HTF Bias: Bullish
• LTF Flow: Bearish until 3384–3392 breaks
• ⚠️ 3408–3416 = key for mitigation before any real breakout
• Target rejections first, not dreams
🎯 Plan ready. Zones set. Now it’s your turn, sniper.
🟡 If this breakdown helped clear the noise, hit that Like
💬 Got a bias or reentry zone of your own? Drop it below
📲 And don’t forget to Follow – we’re building gold logic, not fairy tales
Let’s dominate the session. One sniper entry at a time 💛

Gold professional analysis can help you- Symmetrical Triangle as an corrective pattern in Short Time Frame
- Impulse correction
- Completed " 12345 " Impulsive Waves and " ABC " Corrective Waves
- Break of Structure
- Change of Characteristics

GOLD - at his current support? whats next ???#GOLD. market perfectly placed his current supporting region that is around 3448-49 to 3452-53
keep close that region because only that region can create agian buying volume.
NOTE: we will cut n reverse below 3449 on confirmation.
good luck
trade wisely

GOLD...LONGPYTH:XAUUSD
Market structure suggests is preparing for its next move.
The AND level will likely play a critical role in the upcoming direction.
** If structure breaks and confirms the shift, a new bias might form after the retest. **

Place long orders after the adjustment is over!After gold accelerated its rise in the Asian session, it fell back in the European session and temporarily entered an adjustment cycle, accumulating strength to provide power for the next round of launch. The short-term support in the US session is 3430 and 3412. In terms of operation, go long according to the strength of the decline. There is still no guess on the top, and gradually look to 3480 and 3500! Short-term volatility has increased, and the notice has been issued before the market!
Operation suggestion: Gold is long near 3410-15, and look at 3445 and 3455!

$Gold thrives when uncertainty reigns!- Targets... 4/22/2025TVC:GOLD remains the ultimate safe haven in turbulent markets, proving its strength once again. The extended bull run shows no signs of slowing, eyeing potential targets ahead— check the chart for what’s next!
Cheers!

GOLD - at CUT N REVERSE region? what's next??#GOLD. market perfect move as per our analysis and now market just reached at his CUT N REVERSE level
that is around 3305-06 to 3312
keep close that area because if market hold that area in that case you can see another bounce from here otherwise not at all.
so Note that below 3312 we will go for cut n reverse on confirmation.
GOOD LUCK
TRADE WISELY

XAUUSD 30M CHART PATTERNThis chart shows a technical analysis for XAU/USD (Gold vs. U.S. Dollar) on the 30-minute timeframe. It highlights a potential bullish reversal setup, likely based on harmonic or price pattern trading. Here’s a quick breakdown of what’s being suggested:
Key Elements:
1. Bullish Pattern Completion:
The price has formed a potential reversal pattern (possibly a harmonic pattern like Gartley or Bat), ending around the green arrow at the bottom.
The pattern implies a potential buy zone where a

Gold fluctuates at high levels and is ready to goIn the 4-hour chart, the mid-term bottom continuous positive pattern reflects the bullish strength, but the current price has not effectively stood above the middle track of the Bollinger Bands, so it is not in a very strong state. Based on this, there are still trading opportunities for falling back and going long today, and the support points below the small cycle level are at two key points of 3320 and 3310. If the gold price falls back to the above key support levels during the Asian and European trading sessions, you can follow the trend to arrange long orders, and the key to the market rhythm is still in the US trading session. If there is a unilateral surge in the US trading session on Friday, you can look at the extreme rising target; if there is a shock sweeping market during the US trading session, you don’t have to be obsessed with the gold price will definitely go out of the big rise space, and you need to flexibly adjust the trading target according to the actual market changes.
Overall, in terms of today's short-term gold operation ideas, it is recommended to use the rebound high-altitude as an auxiliary strategy and the retracement low-long as the main strategy. The short-term focus on the upper side is the 3327-3454 line resistance area, and the short-term focus on the lower side is the 3286-3360 line support area.
Operation strategy:
Gold is recommended to rebound to high altitudes as the main, and to fall back to low altitudes as the auxiliary. The short-term focus on the upper side is 3327-3454 line resistance, and the short-term focus on the lower side is 3286-3360 line support.

Gold Swing Short Trade Setup**Gold Market Analysis: Potential Reversal Formation**
Gold is finally showing strong signs of a potential top formation after an extended bullish run. After weeks of anticipation, yesterday's price action delivered a significant rejection candle at the psychologically important 3500 level, which could indicate the reversal signal we've been waiting for.
It's essential to recognize that in a robust bullish rally, tops can take longer to form than initially expected, as we've observed recently. The market often exhibits both time and price extensions in such conditions. Nevertheless, the rejection at 3500 in conjunction with the current technical setup suggests that we may be seeing a reversal pattern taking shape.
**Trading Perspective:**
From a trading standpoint, I am currently awaiting a confirmation candle (a follow-up to yesterday's rejection) to validate that the top is in place. If we witness follow-through selling pressure today or tomorrow, it could present an excellent swing short opportunity, with the following targets established:
- **Target 1 (TP1):** 3295
- **Target 2 (TP2):** 3250
- **Target 3 (TP3):** 3200
- **Target 4 (TP4):** 3170
- **Target 5 (TP5):** 3070 (psychological support level)
Stay vigilant and ready for potential short opportunities as the market unfolds. Let’s see if the signals align for a successful trade. Happy trading! OANDA:XAUUSD OANDA:XAUUSD EIGHTCAP:XAUUSD EIGHTCAP:XAUUSD


The opening surge hit another record high! How Gold is TradedAnalysis of gold market trend:
Technical analysis of gold: the opening price rose directly during the day, the bulls were strong, and a new historical high was set. The short-term upward trend remains, and there is still room for growth. In the short term, attention should be paid to the suppression of 3380-90. If it breaks, it depends on the 3400 mark. In fact, I have been reminding everyone that gold is still very strong. Looking back at last week, although gold occasionally fell, it still maintained an upward trend, and the trend is still running according to the rhythm of the bulls. So now it has broken the previous high point again, so many investors are confused again. Can it still rise? Can short orders still be made? My point of view is bullish. There is actually no strong pressure above, judging from the current K-line structure! Even if it retreats, it will only be the acceleration point of the next wave of rise. The probability of 3340 returning here is very high, but it is not so easy to break through in one breath. There will definitely be repeated at that time. At that time, we will get on the train again and do more, and a new high.
The 4-hour chart relies on the middle track of Bollinger Bands as a support point, and the area near the retracement point ends as far as possible. The middle track is the critical point of the short-term. Last week, it stabilized at 3286 on the middle track. This week, the middle track moved up to 3300. At the beginning of the week, the short-term may rise slowly around the middle track to a new high. The slow release of space is also accompanied by a step-by-step and back-to-back shock. The volatility base is large in operation, and it is flexible to deal with it in combination with the pattern. Going long on the retracement is still the main idea at present. The support point is 3340-3335. On the whole, it is recommended to go long on the pullback and short on the rebound for today's short-term operation of gold. The short-term focus on the resistance of 3380-3390 on the upper side and the support of 3335-3340 on the lower side. Friends must keep up with the rhythm.
Gold operation strategy: short gold near 3380-3390 at the opening, target near 3370-3360, and look at 3340 if it breaks.
Strategy 2: Buy gold when it falls back to around 3340-3345, target around 3365-3375, and look at 3400 if it breaks.

The gold market suddenly "changed its face"Gold plunged down from the high of 3500 yesterday, mainly due to the fact that US President Trump said at the swearing-in ceremony of Atkins, chairman of the US Securities and Exchange Commission, on Tuesday local time that he had no intention of firing Fed Chairman Powell, although he was disappointed that the Fed did not cut interest rates faster. The cooling of risk aversion directly affected the gold price, which once fell to $3366, and then closed near 3382, with the largest drop of 134 points on Tuesday. This wave of gold correction is still continuing. After opening today, it fell straight to 3315. Although it has completely recovered the decline, I think the short position still has continuity, so today's operation strategy is still mainly high-altitude.
Gold is currently trading below 3357. There are signs of a rebound in gold prices at the beginning of the European session. Now the upper suppression level can be moved down. The short-term suppression reference is 3330 here, followed by the second highest point on the way up to 3357; the lower support focuses on the vicinity of 3285, and after effectively breaking it, it can focus on the vicinity of 3245. Now the gold price is trading near the Asian low of 3315. The prudent operation idea is to short at 3331 to protect the gold price near 3320 and wait for the gold price to reach 3285. After the break, wait for the rebound to 3300 and then go short to 3245. It is not recommended to participate in long orders.
Gold's safe-haven demand weakens, gold prices peak and fallExpectations of the Federal Reserve's monetary policy:
According to the latest data from CME's "Fed Watch", the market's expectations for the Federal Reserve's monetary policy shift are undergoing subtle changes. The probability of maintaining interest rates unchanged at the May interest rate meeting is as high as 91.7%, while the probability of a cumulative interest rate cut of 25 basis points is 61.8%. This shows that the market generally expects the Federal Reserve to maintain policy stability and may start a rate cut cycle as early as June. This change in expectations has weakened the attractiveness of gold as an inflation hedge tool, as the postponement of interest rate cut expectations has reduced market concerns about inflation risks.
Geopolitical and trade situation:
Former President Trump recently stated that he would abandon his threat to fire Federal Reserve Chairman Powell, a move that significantly reduced the risk of politicization of US monetary policy. At the same time, his optimistic statement on Sino-US trade negotiations further weakened the market's risk aversion demand. The reduction in political uncertainty and the easing of trade tensions have doubled the risk of gold's safe-haven appeal, leading to capital outflows from the gold market.
Daily level:
Gold showed a typical high-rise and fall trend yesterday, with the daily line closing with a negative column with a long upper shadow, which is usually regarded as an important signal of a staged peak. The upper shadow shows that bulls encountered strong selling pressure when trying to push up prices, and finally bears dominated. The $3,500/ounce area constitutes an obvious resistance level, and the suppression effect of this position is confirmed.
Hourly level:
The short-term trend shows the market's turning point more clearly. Gold prices fluctuated lower after being under pressure in the 3,500 area. The $50 low-opening gap that appeared this morning is particularly rare. This gap often indicates an accelerated change in trend. Although there was a technical rebound in the early trading, it failed to form a sustained buying order. Instead, it encountered resistance again in the 3342/3343 area, confirming the short-term bear-dominated market pattern.
Key price:
Resistance: 3342/3343 area (short-term), 3335/3338 area (ideal entry position for rebound short orders)
Support: 3290/3285 area. The gains and losses of this support range will determine the further opening of the downward space
III. Operation strategy suggestions
Trend judgment:
The current gold market has formed a stage top, and the technical form shows that the trend has turned from long to short. The short-term market shows obvious short-term arrangement characteristics, and it is expected that the downward trend will continue during the European trading session.
Trading suggestions:
Short order strategy: It is recommended to arrange short orders in the 3335/3338 area, with a stop loss set above 3350 and a target of 3290/3285 area
Position management: In view of the abnormal volatility in the early trading, it is recommended to adopt a light position trial strategy and gradually increase positions after the trend is confirmed
Risk warning: Pay attention to the performance of the 3290/3285 support area. If it breaks down effectively, it may trigger an accelerated decline, otherwise it may usher in a technical rebound
IV. Market sentiment and capital flow
Market sentiment has clearly turned to caution. The sharp low opening in the early trading has led to the outflow of some long stop-loss orders, exacerbating price fluctuations. From the perspective of capital flow, the changes in the open interest of COMEX gold futures show that some longs are withdrawing from the market. At the same time, the holdings of gold ETFs have been stable in recent days, with no obvious signs of increasing positions, reflecting that institutional investors are taking a wait-and-see attitude towards the current price.
V. Outlook for the future market
In the medium term, the trend of gold will depend on two key factors: one is the specific time when the Federal Reserve's monetary policy turns, and the other is the development of the global geopolitical situation. Before the June interest rate meeting, if the US economic data continues to be strong, the expectation of interest rate cuts may be further postponed, which will put continuous pressure on gold prices. In the short term, the technical short position has an obvious advantage, and the operation should be mainly short-selling on rebounds. Pay close attention to the performance of the 3290/3285 support area. Whether this position is broken or not will determine the further opening of the downside space.


GOLD New 2 Scenarios Available , Which One You Prefer ? Here is my opinion on Gold right now , after my last 2 posts on It , now i see the price need to go down a little to make any correction and i think this will happen tomorrow , so if we have a 4h Closure below my Support , we can sell it at least for 300 pips , and if we have not , then we can buy it but i prefer to sell it before buy it again , just follow the price action and then you can take you decision .
This Is An Educational + Analytic Content That Will Teach Why And How To Enter A Trade
Make Sure You Watch The Price Action Closely In Each Analysis As This Is A Very Important Part Of Our Method
Disclaimer : This Analysis Can Change At Anytime Without Notice And It Is Only For The Purpose Of Assisting Traders To Make Independent Investments Decisions.

Multi-dimensional Analysis of Gold's Strength and Volatility RisLong-term drivers: After the breakout of the super-large sideways range from 2020 to 2023, global geopolitical conflicts, expectations of economic recession, and large-scale gold purchases by central banks worldwide have jointly fueled a super bull market.
Short-term disruptions: The tariff policy announced by Trump in early April triggered a short-term sharp decline in gold and silver. However, on the monthly chart, no effective correction signal has been formed, and the trend remains dominated by bulls.
Weekly strong characteristics: The long upper shadow line was engulfed by a bullish candle, forming an ultra-large bullish candle, indicating that the market still chose to break upward despite trade war risks, continuing the super-strong trend. While a correction of hundreds of dollars may occur after extreme market conditions, the current upward trend remains intact.
Medium-term rhythm: Multiple medium-term corrections have ended rapidly, highlighting gold’s extremely strong resilience. The current upward slope is steep , showing a "crazy bull" short-covering feature, making it difficult to predict the top in the short term.
Short-term technical signals: The 4-hour chart shows that the high-level volatility is still confined above the 21 exponential moving average (strong support), indicating a continuation pattern in the uptrend. Two potential paths lie ahead:
- Conventional path: Consolidation into a platform before resuming the upward trend;
- Extreme path: Direct breakout to new highs without correction (referencing the frequent occurrence of non-correction short-covering rallies in recent months).
Conclusion: All timeframes suggest that gold’s rally remains unexhausted, with short-term volatility not altering the medium-to-long-term upward trend. However, risks of extreme volatility caused by policy mutations must be guarded against.
XAUUSD
buy@3300-3310-3320
tp:3340-3355-3370
I hope this strategy will be helpful to you.
When you find yourself in a difficult situation and at a loss in trading, don't face it alone. Please get in touch with me. I'm always ready to fight side by side with you, avoid risks, and embark on a new journey towards stable profits.

XAUUSD – Daily Trading Plan – April 28, 2025🎯 Market Outlook:
Gold remains trapped in a corrective range between 3260 and 3380, after an aggressive rally to new all-time highs.
Currently, price is consolidating just below a major supply/flip zone (3380–3395) and above a key support pocket (3260–3280).
HTF (High Timeframe) bias: Still bullish as long as the 3220–3235 pivot holds.
LTF (Lower Timeframe) flow: Sideways, with minor bullish attempts inside the range.
🔥 Key Zones to Watch:
Resistance Zones:
3380–3395 → Major flip and strong resistance zone.
3350–3360 → Minor local resistance inside premium.
Support Zones:
3260–3280 → Major intraday support + liquidity pocket.
3220–3235 → Last pivot to maintain bullish HTF bias (critical for any continuation).
👀 Eyes On:
Price reaction inside 3380–3395 → Will it reject again or break through to unlock 3410–3430?
Weakness signs near 3350–3360 → Watch for potential bull traps if momentum fades.
Respect for 3260–3280 → A bounce from here would confirm buyers still protecting liquidity pockets.
HTF invalidation below 3220 → Would flip the entire structure bearish short-term.
📢 Final Words:
Goldie's playing chess, not checkers — patience and sniper precision will make the difference this week. ♟️✨
Stay sharp, stay smart — we trade real flow, not hopes or dreams.
🔔 Follow the flow, adapt the plan, and let's continue hunting clean moves together!
#Gold #XAUUSD #SmartMoney #MindsetMatters #GoldMindsFX

Gold may hit a second bottom today!From the perspective of the daily line, yesterday's rebound relied on the short-term moving average to close positive, but the rebound was not very strong and the continuity was poor. If it can continue to close positive today, it will lay the foundation for an upward trend, and then it can be seen to gradually strengthen. If it closes negative today, or even falls below the short-term moving average, then gold may fall again.
From the previous round of bottom support 2790, there is a triple bottom, and there is a bottoming process. Therefore, gold cannot be too optimistic about returning to a strong bull market at present, and still has this psychological expectation.
