GOLD sell stup H1Hello! Friends,
Greetings. Please leave a Like if you like the idea.
Before start talking about technical Let's share your LOVE by giving me LIKES to support this work. Thanks in advance.
USCGC trade ideas

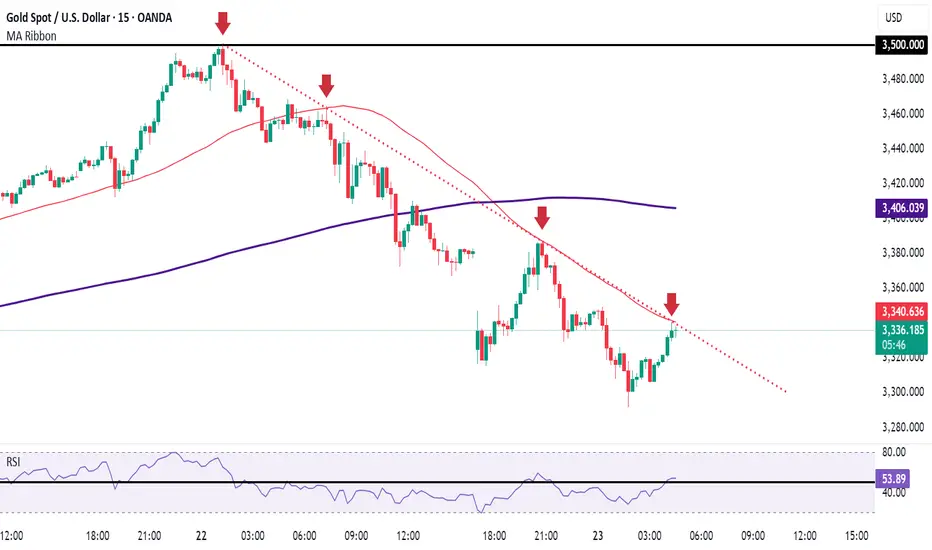
XAUUSD - Will Gold Reverse?!Gold is trading between the EMA200 and EMA50 on the 15-minute timeframe and is on its uptrend line. A continued bullish move towards the supply zone will provide us with the next opportunity to sell it with a good risk-reward ratio. We expect a range of $10-$15.
Gold prices dropped by 4% on Wednesday, just a day after reaching an all-time high. The decline followed remarks by President Trump that helped ease Wall Street’s concerns about the ongoing trade war with China and tensions between the White House and the Federal Reserve.
Throughout this year, gold has seen a substantial rise due to investor fears over the economic consequences of tariffs. Additionally, the metal has benefited from capital fleeing U.S. assets amid political uncertainty under the Trump administration. On Tuesday, Trump reassured markets by stating that he had no intention of removing Jerome Powell as Fed Chair and expressed his expectation that tariffs on Chinese goods would soon be lowered.
Trump’s statements supporting Federal Reserve independence and hinting at easing trade tensions with China reignited risk appetite in financial markets, causing gold prices to tumble on Wednesday.Just a day earlier, prices had hit a record high above $3,500, as investors speculated that Trump might attempt to remove Powell. Trump had previously criticized Powell for not cutting interest rates and for warning that tariffs could lead to higher consumer prices.
Gold’s price surge this year has been especially notable following Trump’s decision to halt the implementation of sweeping new tariffs initially announced in early April. Gold, as a safe-haven asset not tied to any single national economy—unlike traditional alternatives such as the U.S. dollar or Treasuries, which are subject to U.S. government influence—has become increasingly attractive to investors wary of Trump’s policy decisions.
Meanwhile, the International Monetary Fund (IMF) has warned that continued tariff escalation in 2025 could push global public debt to 95.1% of GDP—an increase of 2.8 percentage points from previous forecasts. According to the IMF’s latest “Fiscal Monitor” report, if revenues and output fall significantly below expectations due to tariff-induced pressures, global debt could surpass 117% of GDP by 2027.
Investment bank JPMorgan has projected that gold prices could exceed $4,000 per ounce by mid-2026. This forecast is based on expectations of an economic recession, a prolonged trade war, and sustained demand from central banks. However, JPMorgan also cautioned that a sudden drop in central bank demand could threaten this bullish trend.
The IMF’s report further estimates that global public debt will climb to 99.6% of GDP by 2030, exceeding even the pandemic-era peak.
The IMF has forecasted global economic growth at around 2.8% for 2025. In this scenario, the U.S. budget deficit is projected to decrease from 7.3% of GDP in 2024 to 6.5% in 2025, and further down to 5.5% in 2026, largely due to increased tariff revenues and continued economic expansion.
These IMF projections for the U.S. deficit are based on policies announced up until April 2, 2025, and assume that the individual tax cuts enacted in 2017 will expire at the end of this year.

The gold shorts aren’t over yet
The 1-hour moving average of gold continues to turn downward. If the 1-hour moving average of gold forms a death cross downward, then there is still room for gold to go down in the 1-hour period. Gold has been under pressure from the 3340 resistance line for many times in the US market and has fallen. Gold has hit a new low again in the US market, falling to the 3260 line. The lows of gold continue to hit new lows, so the gold short position has not ended yet. The resistance of the 1-hour moving average of gold has moved down to around 3366. Gold continues to be shorted at highs below 3366.

Gold Trading DirectionGold fell back under the pressure of 3386, and then pulled back to the pressure of 3365. The watershed was the morning high of 3386. Focus on the break of the low of 3313. If it breaks, the support of 3283 can be long. The strong support is 3245. If the European session does not break the low, but continues to fluctuate sideways at a low level, then be careful of the rebound at night.

XAUUSD Today's strategyThere has been a remarkable negative correlation between DXY and gold prices for a long time. Although this internal logic is short-term disturbed by multiple complex factors, the core correlation has always dominated the market rhythm. Recently, the joint remarks by the U.S. Treasury Secretary and Trump on easing tariff issues may boost the U.S. dollar emotionally in the short term, thereby suppressing the bullish momentum of gold. However, this impact needs to be examined within the macro framework.
Currently, the high uncertainty of the global economy, the intermittent escalation of geopolitical risks, and the reconstruction of inflation expectations in some economies jointly form a long-term supporting logic for the safe-haven attribute of gold. From a trading perspective, the above-mentioned short-term disturbances instead provide a window for strategic allocation —
Long-term investors who have not yet positioned or exited midway can take the opportunity of market sentiment fluctuations to build positions in batches, with key attention paid to the test opportunities of the critical support range of $3,250-$3,280。
Short-term traders need to strengthen discipline and strictly follow the established stop-loss and take-profit rules. Given the amplified volatility and enhanced randomness of the current market, it is recommended to appropriately shorten the operation cycle and closely track the intraday dynamics to adjust strategies.
Overall, the marginal changes in tariff policy expectations only constitute small-level fluctuations in the trend process, and the medium-to-long-term upward logic of gold remains undamaged. Investors can grasp structural opportunities under the premise of controlling positions according to their own risk preferences.
XAUUSD
buy@3250-3280
tp:3300-3340
I hope this strategy will be helpful to you.
When you find yourself in a difficult situation and at a loss in trading, don't face it alone. Please get in touch with me. I'm always ready to fight side by side with you, avoid risks, and embark on a new journey towards stable profits.

Gold Short Term UpdateGold on M15 formed a valid descending trendline with 4 touches rejected
so now we're waiting for a M15 candle to broke and close above the touch of the trendline to activate the long (buy) trade
Trade safe and don't forget to trade with risk management
Follow us for more updates and ideas
The Gold Will Make a new All Time High XAUUSD H1 Analysis 📈
The Gold has successfully retraced its Support Level and now it will use this support and pumps itself .
The red area is a very important and strong area and there are many chances that the market will go up as it has retraced already.
If you will see BTCUSD today and it is falling Blindly because the investors are withdrawing their money and maybe they will invest in gold.
The Target 1 and Target 2 are based on the Fibonacci Level.
There is no more buyer in the market due to Gold Crash. Terrifs are horrible thats why There is a bullish move coming in the Gold .
I request you to enter in gold with a proper setup.
In This Chart GOLD HOURLY Forex Forecast By FOREX PLANET
today Gold analysis 👆
🟢This Chart includes_ (GOLD market update)
🟢What is The Next Opportunity on GOLD Market
🟢how to Enter to the Valid Entry With Assurance Profit
This CHART is For Trader's that Want to Improve Their Technical Analysis Skills and Their Trading By Understanding How To Analyze The Market Using Multiple Timeframes and Understanding The Bigger Picture on the Charts

Daily Analysis- XAUUSD (Monday, 21st April 2024)Bias: Bullish
USD News(Red Folder):
-None
Analysis:
-Strong bullish momentum on market open
-Looking for pullback for BUY
-Potential BUY if there's confirmation on lower timeframe
-Pivot point: 3300
Disclaimer:
This analysis is from a personal point of view, always conduct on your own research before making any trading decisions as the analysis do not guarantee complete accuracy.

Gold Prediction!Current Price: ~$3,326
Trend: Strong bullish breakout of ascending channel
Moving Averages: Price is far above the 50 EMA (white)
Still bullishly distanced from the 200 EMA (orange)
Structure: Clean breakout of rising channel and key horizontal resistance zones
-Strong daily candle closed above trendline resistance → this is a confirmed breakout
-No upper wick rejections or bearish engulfing candles
-Buyers remain in control until signs of exhaustion show
Plan: Only look for a Buy position setup for safer trade.

Gold's Trend and Trading Strategy for Next WeekLast week, the price of gold sharply declined after hitting the resistance level of $3,500, dropping to around $3,260 at its lowest point. The weekly chart closed with a bearish inverted hammer candlestick pattern, suggesting a sharp short-term downward momentum. However, on Friday evening, the gold price rebounded near the support level of $3,260 and regained the $3,300 mark. Combining the current fundamental and news-driven analysis, gold remains in an overall upward trend:
Technical Analysis
Although the weekly inverted hammer pattern indicates selling pressure at higher levels, the rapid rebound from the bottom to reclaim the key $3,300 level signals the persistence of bullish momentum. If the short-term decline fails to effectively break below the strong support at $3,250, the gold price has the potential for a rebound.
Trading Strategy
Next week, it is recommended to adopt a bullish bias and focus on long positions. Consider entering near $3,283, with a stop-loss set below $3,260. The upper resistance levels are sequentially $3,331 (short-term resistance) and $3,370 (target after breakthrough).
Risk Warning
Be vigilant against shocks to gold prices from sudden geopolitical news or changes in Federal Reserve policy expectations, and strictly control position sizing and stop-loss levels.
I hope this strategy will be helpful to you.
When you find yourself in a difficult situation and at a loss in trading, don't face it alone. Please get in touch with me. I'm always ready to fight side by side with you, avoid risks, and embark on a new journey towards stable profits.

XAUUSD LONGIm trying again this long trade ideia. Stopped out once but Im still confident about this one. 1-10RR. Lets see. Proper risk management always.

It is only a matter of time before the price breaks below $3,300From a daily chart analysis, gold showed a strong upward momentum during Tuesday's session, once hitting the key level of $3,500, before quickly retreating under overhead pressure and eventually closing with a bearish candle. This pullback after a sharp rally highlights significant selling pressure near the $3,500 level, where bullish momentum was fiercely resisted by bears at high prices.
The bearish trend continued on Wednesday, with gold closing lower again to form a two-consecutive-day bearish candlestick pattern. This consecutive decline further confirms that bears have taken short-term dominance, with bearish forces gradually gaining the upper hand.
Notably, the price action has a clear dividing line: the $3,317 level serves as the bull-bear watershed. A valid break below this level is likely to sustain the downward trend. Based on the current momentum, a decline below $3,300 appears only a matter of time, further reinforcing the short-term bearish sentiment.
XAUUSD
sell@3325-3335
tp:3300-3280
I hope this strategy will be helpful to you.
When you find yourself in a difficult situation and at a loss in trading, don't face it alone. Please get in touch with me. I'm always ready to fight side by side with you, avoid risks, and embark on a new journey towards stable profits.

XAUUSD 30M CHART PATTERNThis chart appears to show a potential bullish reversal pattern in the gold market (CFDs on Gold, 30-minute timeframe). Here's a quick breakdown:
Descending Channel: The green trendlines outline a downward channel, indicating a previous bearish trend.
Bullish Breakout: The price action seems to be breaking out of the descending channel, possibly forming a reversal.
Entry Zone: The green arrow and horizontal support suggest an expected bounce or entry zone.
Stop Loss: Placed just below the support level to manage risk.
Take Profit Zones: Two targets are marked — a conservative target around the mid-channel level and a more aggressive target near previous highs.
This setup anticipates a pullback to support before a strong upward move. Do you want help analyzing the validity of this setup or discussing potential trading strategies around it?

gold next move ?gold currently tradingaround 3342 and we are expecting big drop as peraour analysis,, do your own research

CHECK XAUUSD ANALYSIS SIGNAL UPDATE > GO AND READ THE CAPTAINBaddy dears friends 👋🏼
(XAUUSD) trading signals technical analysis satup👇🏼
I think now (XAUUSD) ready for(BUY)trade( XAUUSD ) BUY zone
( TRADE SATUP)
ENTRY POINT (3292) to (3290) 📊
FIRST TP (3284)📊
2ND TARGET (3276) 📊
LAST TARGET (3268) 📊
STOP LOOS (3302)❌
Tachincal analysis satup
Fallow risk management

Believe me, gold cannot fall all the way down
Gold prices fluctuated this week, hitting a record high of $3,500/ounce, then encountered resistance and fell to $3,300/ounce. The main reason for the record high in gold prices was that after US President Trump verbally attacked Federal Reserve Chairman Powell, the market was worried that the Federal Reserve would lose its independence. But after Trump and Bessant's remarks, market risk appetite rebounded, hitting safe-haven asset gold, and then plummeted all the way!
Is gold going to fall after a sharp retracement?
In fact, the market has a warning for today's retracement. After all, yesterday's closing line was a big negative line, so there must be a continuation in the trend of gold. Moreover, after yesterday's gold rose to 3,500, the trend weakened, and the market fell all the way to break the 3,400 mark and the 3,300 mark, and fell to the lowest level of 3,290! To be honest, this round of decline is still quite strong. After breaking the continuous positive, the market ushered in the suppression of the market retracement, and at present, there is still a trend of continuation!
In my opinion, the key entry point for long orders today is the previous rising point of 3280. The short-term retracement of gold is obviously continuing, and in the medium and long term, gold is still bullish. So our entry point is actually relatively simple. When it retreats to 3280, we can directly enter the market. There are still many opportunities for long orders. The retracement is not the peak!
Gold: 3280 more, defense 10, target 3330-45!
Join me and I will guide you to a profitable trade 💵!

GOLD POSSIBLE SELL Japanese inflation accelerates, complicating BoJ’s rate decision amid global uncertainty
Japan’s core inflation accelerated in March, yet economic uncertainty will limit the Bank of Japan’s ability to continue hiking rates in the near term. With inflation seen accelerating further, a BoJ tightening is likely in July.

XAUUSD:The upward trend persists. Latest trading strategy The gold price continues to drop and has broken below the lower resistance at 3380, signaling the market's liquidation of long positions. (👉signal👉)
Yet, factors like escalating trade tensions, rising geopolitical risks, and doubts about the Fed's independence keep fueling safe-haven buying, maintaining the gold's strong overall trend. Wait till the liquidation ends and then choose a proper price point to initiate a long position.Pay attention to the support level at 3370. Above this price level, you may consider continuing to go long!
Trading Strategy:
buy@3470-3400
TP:3420-3440
The signals last week resulted in continuous profits, and accurate signals were shared daily.
👇 signals👇

Gold bulls are not strong enoughGold has begun to form an inverted V reversal pattern in the 1-hour moving average. If the 1-hour moving average of gold begins to turn, then gold may have a deep adjustment. If there is no strong risk-averse news for gold, then adjustments are inevitable. Gold is at least volatile in the short term. Don’t chase too much easily. Pay attention to the pressure near 3450.
Trading idea: short gold near 3446, stop loss 3456, target 3426

GOLD BEST PLACE TO SELL FROM|SHORT
GOLD SIGNAL
Trade Direction: short
Entry Level: 3,458.82
Target Level: 3,187.96
Stop Loss: 3,639.42
RISK PROFILE
Risk level: medium
Suggested risk: 1%
Timeframe: 4h
Disclosure: I am part of Trade Nation's Influencer program and receive a monthly fee for using their TradingView charts in my analysis.
✅LIKE AND COMMENT MY IDEAS✅

XAU/USD Price Action Update – April 22, 2025📊XAU/USD Price Action Update – April 22, 2025
🔹Current Price: 3,480.53
🔹Timeframe: 15M
📌Key Demand Zones (Support):
🟢3452–3452 – Minor Imbalance Fill Zone (could trigger short-term reaction)
🟢3441–3444 – Strong Demand Zone (aligned with 0.618 Fib retracement)
🟢3412–3419 – Higher Timeframe Bullish Origin (potential reversal zone)
📌Fibonacci Retracement Levels:
🔸0.236 – 3,475.32
🔸0.382 – 3,466.54
🔸0.5 – 3,456.21
🔸0.618 – 3,445.88
📈Bullish Outlook:
Price is retracing after a strong bullish impulse and may react at the Fib levels, especially around the 0.618 zone aligned with demand. Bullish continuation possible if price forms a higher low and confirms with bullish engulfing or BOS.
📉Bearish Outlook:
If price fails to hold above 3452 or breaks 3441 aggressively, a deeper pullback toward 3412–3419 could occur. Look for bearish confirmation candles and signs of weak buyers.
⚡Trade Setup Tip:
✅Watch for entry confirmation at demand zones
✅Use confluences like Fib levels, structure, and reaction wicks
✅Maintain disciplined risk management
#XAUUSD #GoldAnalysis #ForexTrading #SmartMoneyConcepts #PriceAction #TechnicalAnalysis #FXF #fxforever #SupplyAndDemand #FibonacciLevels #IntradayTrading #MarketUpdate #GoldScalping

XAUUSD sell signal In the near term, and according to the 4-hour chart, XAU/USD has room to extend its advance. Technical indicators eased modestly from their recent highs but lack any bearish momentum. Particularly, the Relative Strength Index (RSI) indicator hovers at around 81 with no signs of giving back. Finally, the 20 SMA accelerated north above the longer ones, while offering dynamic support in the $3,320 region.
Support levels:3,400.00 3,386.40 3,375.50
Resistance levels: 3,430.40 3,445.00 3,460.0
XAUUSD sell signal 3414
Support 3387
Support 3345

Gold Uptrend ContinuesThe higher degree diametric wave-(E) is expanding and we can consider the recent price correction that started at $3167 as a small X-wave, as a result, gold can grow as a combination pattern to the range of 3600-3800 and even gold can touch $4000.
The second triangle pattern will probably be a neutral triangle or a reverse contracting triangle, where the wave-(a) triangle can end at 3500 or 3600.
The factor that caused the expansion of the wave-(E) is the US-China trade war, which caused investors to rush to buy gold.
