4.25 gold short-term operation technical analysis!Spot gold suddenly fell sharply during the Asian session on Friday (April 25). At the end of the session, the current gold price was around $3,307/ounce, a plunge of more than $40 during the day.
Gold prices turned lower on Friday as hopes of a trade deal between China and the United States weakened safe-haven assets. The positive risk tone weakened the demand for safe-haven assets. In addition, optimistic US macroeconomic data on Thursday supported the dollar, which also hit gold prices.
Cleveland Fed President Hammack made it clear in an interview on Thursday that the Federal Reserve has basically ruled out the possibility of a rate cut in May. But she also released key information that if there is clear evidence of the direction of the economy, there is room for policy action in June.
Gold prices are currently supported near the $3,300/ounce mark, which is also the 38.2% Fibonacci retracement level of gold prices from this month's low (around $2,950/ounce) The latest round of gains is located.
If gold price falls below the $3300/oz mark, the next support for gold price is the weekly low near the $3260/oz area; if it falls below the above area, gold price may accelerate its decline and fall to the 50% retracement level (i.e. the area near $3225/oz) and finally fall to the $3200/oz mark. Some follow-up selling will indicate that gold has peaked and turn the short-term bias in favor of bearish traders.
Gold price resistance is around the $3368-3370/oz area, which should be a key level now. If it breaks through the above area, gold price may return to the $3400/oz mark. The subsequent rise may push gold price further to the $3425-3427/oz barrier. Once this barrier is overcome, bulls may retry to conquer the psychological $3500/oz mark.
USCGC trade ideas

GOLD SENDS CLEAR BULLISH SIGNALS|LONG
GOLD SIGNAL
Trade Direction: long
Entry Level: 3,299.27
Target Level: 3,358.08
Stop Loss: 3,259.94
RISK PROFILE
Risk level: medium
Suggested risk: 1%
Timeframe: 1h
Disclosure: I am part of Trade Nation's Influencer program and receive a monthly fee for using their TradingView charts in my analysis.
✅LIKE AND COMMENT MY IDEAS✅

Topping Out or Temporary Pullback?Market Analysis (Daily Chart View):
The Daily chart indicates that price has declined after reaching a record all-time high and reacting from the upper boundary of an Ascending Broadening Wedge. Both the Weekly and Monthly charts remain in extreme overbought conditions, suggesting caution. Additionally, the upward trend across all three timeframes—Monthly, Weekly, and Daily—is unusually steep and unsustainable.
Such steep trends often lead to parabolic spikes, typically seen near the end of a trend, which is evident from the long wicks on the recent Weekly and Monthly candles. Based on the structure of the Ascending Broadening Wedge, the projected price target is 2565.00.

XAUUSD 1h ForecatHello guys I hope you are well let me tell you that we can buy from here now because we have crossed the bullish order block, so our target will remain at the resistance area.

Early Asian session. Latest market analysisIn early Asian session, spot gold rebounded slightly and is currently trading around $3,345/oz, supported by bargain hunting. The U.S. session continued its trend of retreating from record highs, falling nearly 3%, hitting a low of $3,260.08/oz and closing at $3,288.18/oz.
People familiar with the matter revealed that the Trump administration is considering reducing tariffs on imports from Asian powers, adding that any action would not be unilateral.
Quaid Analysis:
People are very relieved about the possibility of negotiations between major powers, and we are seeing this trend have a significant impact on the market.
Driven by central bank buying, tariff war concerns and strong investment demand, gold prices have risen by more than 26% since the beginning of 2025. A large number of long orders are facing profit-taking needs, and investors need to beware of the risk of further correction in gold prices.
From a technical perspective, gold prices hit $3,500, soared before this level, and then reversed sharply, which increases the risk of further correction in the short term.
The preliminary monthly rate of durable goods orders in the United States in March and the number of initial jobless claims in the United States for the week ending April 19 will be released on the Asian trading day. Investors need to pay attention to them. In addition, they need to continue to pay attention to the relevant news on the international trade situation and the geopolitical situation.
Action suggestions:
Go long at 3345, stop loss at 3340, watch 33380
If Quaid's analysis can help traders, then Quaid will be very happy.

Gold pullback 3400 Gold can pullback 3408 . And then down to 3200. Sell limit 3400 & 3408 sl 3415 TP 3233 3200

XAUUSD: 23/4 Today's Market Analysis and StrategyGold technical analysis
The resistance level of the four-hour chart is 3400, and the support level is 3285
The resistance level of the one-hour chart is 3371, and the support level is 3300
The resistance level of the 30-minute chart is 3350, and the support level is 3300.
The current gold price is short-term bearish.
The Asian session continued to break through 3300, falling to 3291.8, and then rebounded quickly. If the price falls below the 3300 integer mark again, it may further fall to 3285. After breaking the support of 3285, it will continue to test 3245.
If the price rebounds and breaks through the previous high resistance level of 3350 US dollars, the short-term trend may turn bullish.
Sell: 3350near SL:3355
Sell: 3285near SL:3290
Buy: 3300near SL:3295

XAUUSDI think GOLD gonna go that way. Take these lows and then go up. Use small lot. Do your own research. Thank me later.
This is not financial advice.

GOLD: Bulls Are Winning! Long!
My dear friends,
Today we will analyse GOLD together☺️
The recent price action suggests a shift in mid-term momentum. A break above the current local range around 3,430.01 will confirm the new direction upwards with the target being the next key level of 3,480.61 and a reconvened placement of a stop-loss beyond the range.
❤️Sending you lots of Love and Hugs❤️

SELL GOLD NOW!!!!!!!!!1Gold took out the sell side liquidity with a retest am looking forward to see price rejects properly from this previous lower highs which is also a fvg premium zone then am in holding till new lows is created
JOIN AND ENJOY......

Strategic Outlook | XAUUSD | Tuesday, April 22, 2025TUESDAY AFTER EARNINGS WEEK / POST-EASTER
Market makers love using Tuesday post-holiday to trap and fade over-leveraged weekend bulls.
Don’t chase, let price come to VWAP/VAL. That’s where they reload the big guns.
📌 Current Price: $3,452.12
📈 Daily Range: 3,411.79 – 3,500.11
📅 52-Week High: NEW ALL-TIME HIGH at 3,500.11
📢 News Catalyst: “Gold Futures Break Above $3,500 on Fed Concerns”
💥 Momentum: Insane — 31.47% YTD, +44% YoY. We’re in Supercycle Territory.
Daily Chart (Linear Regression 200 | STDEV 5)
Structure: Clean breakout from linear regression upper band — bull continuation zone.
=====================================================================================================================================================================================================================
✅ Entry 1: Momentum Break + Retest (Smart Continuation)
Play the pullback after blowing out weak sellers at $3,500
🔫 Entry: Buy Limit @ 3,443.00 (Fib pivot + previous liquidity shelf)
🛑 SL: 3,417.00 (Below VWAP band + confirmed structure break)
🎯 TP1: 3,475
🎯 TP2: 3,490
🎯 TP3: 3,505+ (extension target)
🧠 Why: Price will likely retest previous breakout zone at 3,443–3,445 before continuation. This is the sniper's reload zone.
-------------------------------------
Entry 2: Aggressive Breakout Run (Volume Confirmation Required)
If NY explodes volume again like earlier London/Fed candle
🔫 Entry: Buy Stop @ 3,462.50
🛑 SL: 3,444
🎯 TP1: 3,490
🎯 TP2: 3,500 (previous wick)
🎯 TP3: 3,517–3,529 (daily Fib 78.6% ext + ATR+2 zone)
📈 Confirmation: 5m volume bar > 35K
🧠 Why: You’re riding the breakout beast. Ride fast, manage risk tight.
--------------------------------------
Entry 3: Liquidity Trap Reversal (Fade the Blow-Off Top)
Only execute if price smashes $3,500 again & immediately rejects with high-volume reversal
🔫 Entry: Sell Stop @ 3,488
🛑 SL: 3,503
🎯 TP1: 3,462
🎯 TP2: 3,444
🎯 TP3: 3,428
📉 Confidence: 45%
🧠 Why: This is the trapdoor. Only valid if $3,500 rejection aligns with divergence + VSA no-demand + distribution signal.
====/////=====//////=======
Don’t FOMO the $3,500 wick.
Trade with structure or get devoured like retail pawns.
====/////=====//////=======
ADX/DI: Strong DI+ (50.31), solid uptrend confirmation.
Volume MA: Still surging; buyers are not backing off.
ATR RSI: 26.83 — volatility expanding = breakout continuation bias.
🔎 This is classic markup phase post-breakout. Price is riding the SD5 rail like a rocket. Bulls still in full control.
========
4H (240m) Chart
Price: Pulling back slightly from short-term peak.
ADX/DI: Bullish momentum cooling slightly (DI+ > DI−, ADX still elevated).
Dynamic Fibs: Holding above 0.382 = continuation bias unless 3,445 breaks.
Volume Spike: Heavy volume earlier = exhaustion possible — watch for NY volatility trap.
🧠 Strategic Mindset: Wait for either reclaim above 3,460 for continuation OR liquidity sweep down to VWAP zones for sniper longs
==============
1H (60m) Outlook
Price: Holding between dynamic Fib 0.236 (3,455) and VWAP (3,448).
ADX: Flatlining — trend is pausing.
Volume: Lower than average (Volume: 26.2K < MA: 32.6K).
DIs: Compression → Market maker accumulation or trap brewing.
🧠 Execution Zone: VWAP + VAL confluence (3,445–3,440) = prime bounce long area.

Gold is rising step by step, and the 3500 mark is in danger
📌 Driving events
Geopolitical conflicts are escalating (such as the deterioration of the situation in the Middle East)
US CPI data is lower than expected (85% year-on-year)
📊 Comments and analysis
Although gold has experienced a correction, the price of gold has quickly risen strongly, and the positive fundamentals have pushed the market to set new historical highs. As of the end of the Asian market, today's gold trend is almost a replica of yesterday (the gold price continued to rise from the Asian market to the US market on Monday).
What is a bull market? It is to break the cognition of most people, and the rise makes people doubt their lives. Not seeing it does not mean that it does not exist. Empiricists are destined to be eliminated. The underlying logic of the rise in gold during the financial crisis in 2008 and the rise in gold this year has long changed.
💰Strategy Package
Long position:
Actively participate at 3470 points, profit target is above 3500 points
⭐️ Note: Labaron hopes that traders can properly manage their funds
- Choose the number of lots that matches your funds
- Profit is 4-7% of the fund account
- Stop loss is 1-3% of the fund account

Is gold currently in a bullish or bearish trend?We’ve seen gold surge significantly during times of uncertainty. The problem is, when we look back at the 2008 financial crisis, we notice a similarly exponential rise, which was followed by a 45% correction after reaching its peak. Based on a current price of $3,400, a correction down to $1,800 is possible. This means it’s very realistic that gold could spike again sharply—especially if Powell ends up being fired—and then, once things start to calm down again, we could see a major correction of at least 45%.

CHECK XAUUSD ANALYSIS SIGNAL UPDATE > GO AND READ THE CAPTAINEntry Point: ~3,395.000
Current Price: 3,393.185
Stop Loss: 3,400.000
Take Profit 1: Slightly above 3,385
Take Profit 2: 3,380.000
Last Target (Take Profit 3): 3,370.000
STOP LOSS 3400 👍🏼
TECHNICALLY ANALYSIS SATUP ✅
FALLOW RISK MANAGEMENT ✅


Interpretation of technical analysis of gold market opening operDue to the influence of Easter, the market was closed on Friday this week. After hitting a high of 3357, gold also ushered in a short-term adjustment! In the previous interpretation, we also emphasized to everyone that after hitting a new high, we should guard against the pullback caused by profit-taking. Especially at the critical time point when the market is about to close, but this does not mean the end of the bullish trend. After the sharp rise in gold, although there is selling pressure, gold still rose by 2.5% this week and closed above 3300.
So how should we trade gold next week?
The biggest driving factor for the rise in gold prices this time is Trump’s repeated tariff policy, coupled with the recent tense geopolitical situation, and the pace of global central banks buying gold. In the medium and long term, it is still a driving force for gold to rise.
Short-term operation: Pay attention to the first support level, which is 3310, which has been touched many times.
Short-term key support below: 3285-90
Short-term focus on high points above: 3340-45
If the breakthrough accelerates to the historical high point, everyone should be cautious in chasing more!

GOLD | Monthly Chart – Uncharted Territory
We are officially in price discovery.
🔱 Gold has broken out of its multi-decade consolidation range and closed above the previous highs with conviction.
💰 $3,500 is now within reach — a major extension target sitting at the 2.618 Fibonacci level.
🟨 The yellow zone was the key resistance area that capped price action for nearly 13 years — now acting as a powerful base for potential continuation.
📊 This chart is a reminder: when historical resistance gives way, it’s not just a breakout — it’s a paradigm shift.

Will a false breakdown in support lead to growth?The current trading range is 3275-3290. Since the opening, the price has been fluctuating in a small range. There was no news on Friday, so the price may regain its upward momentum after retesting the liquidity and support area of 3270-3285.
Gold prices are currently stable around $3280, but the US dollar has curbed the rise of gold prices.
Gold prices have held their ground after recovering, but the strengthening of the US dollar and hopes for progress in tariff war negotiations have limited further gains in gold prices…
Optimism about US corporate earnings and fears of a recession are easing, supporting demand for the US dollar. However, the continued uncertainty in Sino-US relations has kept interest in gold strong.
The market is waiting for new signals from the White House and the Federal Reserve, which will determine the further trend of gold prices.
Focus on the support trading range. A false break of 3270 could change the balance of power, leading to a rebound or growth.
No news today, except for the unpredictable situation of Trump and the tariff war in general. Any speech or tweet could shake the market.
However, gold prices remain range-bound after a lackluster week.
Quaid recommended:
The market fluctuates sideways today. You can try short-term trading. Look at 10 points for each upward callback and perform scalping transactions in this range.

XAU BEAR FLAGHey guys, I see liquidity sweep sitting at 3259.03 Pre-London. Trade smart, Trade safe. Cheers

XAUUSD Price Outlook – Bearish Setup in Play ??Asset Overview
The chart represents a price action analysis with support and resistance zones, along with EMA indicators (50 and 200), likely on a 4H or 1H timeframe.
Key Technical Levels
Resistance Zone: ~3,400 to 3,450
First Support Zone: ~3,230 to 3,250
Second Support Zone: ~3,090 to 3,130
Indicators
EMA 50 (Red): Currently around 3,340, acting as dynamic resistance.
EMA 200 (Blue): Positioned near 3,232, reinforcing the first support zone.
Price Action Insight
Price had a strong uptrend, peaking above 3,440 before pulling back.
A lower high may be forming, suggesting possible trend exhaustion.
The current bounce appears to be a retracement back toward resistance or EMA 50.
Projected Move (As Illustrated on Chart)
Short-term bullish move into the resistance zone (~3,400–3,450).
Failure to break above resistance leads to sharp rejection.
Price retraces to first support zone (aligned with EMA 200).
If support fails, deeper drop expected toward the lower support zone (~3,100).
Strategic Notes
📉 Bearish Bias if price fails to break above resistance.
🔍 Watch for bearish candlestick patterns or divergences near resistance.
🛡️ First support aligns with EMA 200, making it a critical level for bulls to defend.
🔻 Breakdown below 3,230 opens room for larger correction to 3,100–3,090.
Conclusion
Currently, the chart suggests a potential short opportunity if price confirms rejection at resistance. The EMA cross structure remains bullish long-term, but momentum is weakening, and failure to reclaim highs could shift sentiment bearish in the short to mid-term.

XAUUSDPotential reversal
- short
- Clearly see head and shoulder pattern in the 1HR time frame
- Bearish engulfing candle sticks

Gold's downside target is AB=CD, 3132On the 4-hour chart, XAUUSD fluctuated and fell, and the bears have the upper hand. At present, attention can be paid to the resistance near 3367. If the rebound is not broken, it is expected to start to fall. The support below is around 3260. If it falls below, it is expected to form an AB=CD pattern, with a target near 3132.

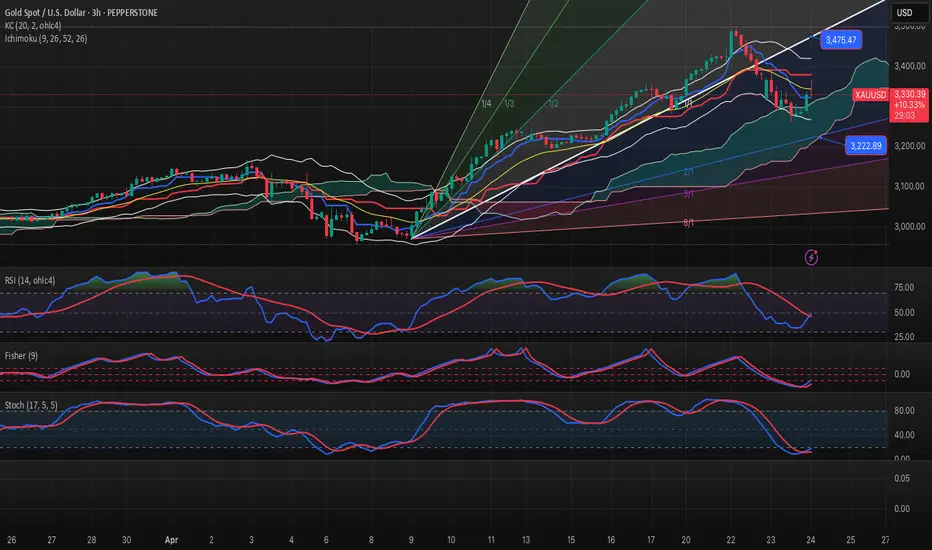
GOLD-BUY strategy 3-hourly chart GANNGOLD move sharply lower, but finding support slightly below $ 3,290 and established a littly higher again. Short-term we may see a move back towards $ 3,450-3,475 area agin before down.
Strategy BUY @ $ 3,310-3,350 and take profit at $ 3,468.