Gold profit taking continuesThe gold market opened at 3337.5 yesterday due to the profit-taking of the previous day. After the market fell back to 3315.6, the market rose strongly to fill the gap. The daily line reached a high of 3386.7 and then fell strongly. The daily line reached a low of 3259.6 and then the market consolidated at the end of the day. The daily line finally closed at 3287.9 and the market closed with a long upper shadow line. After this pattern ended, today's market continued to be empty. In terms of points, the short positions at 3496, 3468 and 3442 the day before were reduced and the stop loss was followed up at 3400.
SELL:3340 45 50 Stop loss: 55
TP1:3330
TP2:3320
TP3:3300
USCGC trade ideas

Quick Trading Idea - GoldGood Afternoon,
Here is a quick trade idea that I will be taking advantage of.
Enjoy!

Gold is bearish, don't chase the decline
There is no technology to speak of for gold at present. Basically, it is a mindless long position. After breaking the new high again today, a strategy of chasing long positions was decisively given. At present, members who entered the market early have made a profit of 40 points. This market has to be said to be too crazy.
Since gold started to rise from the low point of 2956, except for two normal adjustments in the middle, the price of gold has maintained a strong upward trend relying on the MA5 moving average for most of the time. This trend characteristic shows that in a shorter period, the MA5 moving average has become an important support line for the rise in gold prices. As long as the price runs above the MA5 moving average, the bulls will dominate.
At present, 3500 is about to arrive in a flash, it is just a matter of time. The current market depends on everyone's courage. There are more than a dozen profits when you enter the long position, which is easy, basically without callbacks, and any callback is an opportunity. In terms of operation, you can continue to do more by relying on the short-term moving average MA5.
I am Yulia, and I hope you can gain something and gain insights from my article! A small boat is drifting in the sea. If you don't set sail, you will drift in the sea forever. Only the existing value can truly protect you.

Gold Intraday Trading Plan 4/22/2025Gold has been in the bullish trend for a while and there is no sign of slowing down at this moment. However, as explained in my weekly summary and forecast, I do expect it to correct this week. I am looking for selling opportunity from channel top around 3450. 1st target is channel bottom at around 3358. 2nd target is at 3275.

The relentless growth of goldDescription
Given the strong breakout of last week's high and the conversion of the resistance zone into support, the price is expected to continue towards 3450-3460 after a pullback to 3358.
Of course, with this strong trend, a pullback may not occur.
Unfortunately, my trade(BUY POSITION) entry point did not occur in the previous position and gold performed much stronger than I had anticipated at the beginning of the week.
Possible positions this week
A:Suitable prices for BUY positions
1)3358-3347
B:Suitable prices for SELL positions
1)3398~3408
( This high-risk trade is still active )
This is just an analysis and everyone is responsible for their own work.
Hoping for a good and profitable week.

XAUUSD 21/4/25We have another bullish run on the horizon after seeing a new all-time high placed last week and the week before. We expect nothing less than continued bullish momentum for gold.
As we mentioned in the EUR/USD markup, where price currently sits on many pairs is a relatively extended area. This means price action could pull back to more favorable pricing, especially due to the upcoming bank holidays. We know there are lower liquidity areas that may need to be filled, and if we want to follow this bullish move, we must also be prepared for a temporary dip.
As we remain bullish, we should avoid relying on short movements and instead wait for better pricing before entering long positions. As always, short-term lows may form between the last major low and the current price. If they do, those could be potential areas to buy from.
However, we must stay clear in our bias—we want to go long from any potential liquidity-driven lows, not just chase the upward move if it’s likely to retrace. Look for the high-liquidity low we've marked on our chart. If price reaches that area, it would present a highly probable zone for long trades.
Stick to your risk, let Orion lead the way, and always follow your trading plan.

Gold analysis resultThis analysis was the first analysis posted on this page and this video shows the result of this analysis in the long term, this analysis was done with the lowest drawdown.
Sasha Charkhchian

XAUUSD SUPER LONGI don't know just get angry and go up to the lane In the end. use your own common sense to decide

Gold. Further downside is possible.Hey traders and investors!
Gold price bounced from a contextual level 3283 — the correction low within the dominant buyer’s initiative on the daily timeframe.
Further downside is possible. Watching levels 3381 and 3283.
The structure in this post is based on the logic of Initiative Analysis (IA).

How to break through the gold shock patternOperation suggestionsTechnical analysis of gold: The current gold price is in a stalemate stage of long-short game. On the one hand, the path of the Fed's easing policy has been basically clear, and the US dollar is facing correction pressure; on the other hand, the stable global risk sentiment and the strong performance of the stock market have weakened the attractiveness of gold as a safe-haven tool. The repeated signals of global trade negotiations have also made the market direction unclear. From a technical point of view, gold has received support after the correction to the 26.3% Fibonacci retracement level near 3317 this week, and has returned to above $3,300 in the short term. The upper resistance focuses on the position of 3380. Once it breaks through, it will open up the space leading to the 3400 mark.
From the daily chart of gold, yesterday's gold price fell sharply and recorded a large real body Yin line K-line pattern. The peak pattern of the previous price high is more obvious, suggesting that the upper pressure effect is strong. The MACD indicator double line began to turn downward, increasing the risk of further correction in the short term. However, the MA5 and MA10 moving averages have not turned downward yet. You can pay attention to the support and defense of the moving average. From the 4-hour gold chart, the gold price has been fluctuating and falling since it came under pressure at the 3500 level. The current price has fallen back to the 3260 level, with a short-term decline of 240 US dollars. Although there has been a rebound during the day, the upward trend has been destroyed. The MACD indicator has issued a dead cross signal, suggesting that the correction trend may have started.
Gold fell after rising in the Asian session, and fell below the support levels of 3351 and 3330. Now the market rebounded near 3314, which is also in line with our analysis of the long and short trends. In the big trend, the gold rally did not exceed 3380, so there is still a downward demand, that is to say, it can only be regarded as a rebound during the decline. In the short term, this wave of gains stopped at 3367. Now it broke through 3351 and pierced 3316 to rebound. The main focus on the upper side is the support-to-resistance level of 51, followed by 3342. Specifically, you can wait for the area near 3345 to go short and see the gold price break the previous rebound low of 3314 to 3300. If it breaks down effectively, you can move the protection loss down to see the position of the rebound turning point of 3283 and 3260. On the whole, the short-term operation strategy of gold today is to short on rebound and long on callback. The short-term focus on the upper side is 3350-3370 resistance, and the short-term focus on the lower side is 3300-3280 support.

GOD-SELL strategy weekly chart Regression ChannelGOLD has not had a decent correction as yet, and every day we are higher showi8ng market is hungry for it, however, it is very over extended, and it is for the careful leveraged trader to ensure we survive. I have been adding slowly with low leverage and it is good to be add further shorts to the existing positions at current levels. Just to add to the information, the RSI levels weekly to be 90..00% and higher even on Heikin Ashi suggests that the correction will be very severe.
Strategy SELL @ $ 3,475-3,515 and take profit in stages, i.e. first @ $ 3,367 and followed by $ 3,167 for now.

Gold is still on the bearishIt can be seen that the price of gold is currently in minor support, if this support is broken, the potential for decline will still be far away.
SL: 3325 (200 pips)
TP: 3265

XAUUSD: 22/4 Today's Market Analysis and StrategyGold technical analysis
Four-hour chart resistance: 3500-3550, support: 3400-3380
One-hour chart resistance: 3500, support: 3430
30-minute chart resistance: 3480, support: 3440.
Tariff policy drives gold up, and it is clear that the recent technical analysis of gold trends has failed. Just follow the market. London market/NY market pays attention to the trading range (3430-3480), first sell high and buy low at the edge of resistance and support, and if the resistance and support are quickly broken, follow the trend.
Buy: 3430near SL: 3425
Sell: 3480near SL: 3485
Use small size transactions.

Gold target: $3500The structure of the bullish trend of gold remains unchanged, so don't guess the top. From 2600 points at the beginning of the year, gold has been rising all the way yesterday. Gold is now very volatile. In fact, it is easy to fluctuate by 20 to 30 US dollars. The current market is a new high every day. The bullish trend of gold is beyond doubt, but you still need to wait patiently. Recently, the trend of gold in the Asian session has been mainly rising. Gold will continue to be bought after it falls back.
Gold is currently maintaining a high-level oscillation and strong trend in the daily trend, and there is no sign of peaking yet. The 4-hour level trend has been repeating the sideways trend after the rise, and then the continued upward trend after a slight decline.
The current trend can no longer be viewed with conventional thinking, and the high point cannot be judged. It is completely driven by emotions. Do a good job of risk control in the short term to follow the operation. The technical side is not of much reference significance. As long as the tariff policy is not relaxed, it will be difficult for gold to fall and pull back!
Gold has hit a record high driven by the weakness of the US dollar and risk aversion. In the short term, the bullish momentum is still strong, but the overbought signal prompts that we need to be alert to the risk of pullback. The medium-term trend will depend on the evolution of trade negotiations and geopolitical situations. $3,500/ounce is still the target of market attention.
In the short term, it has risen three times during the day, so you can't chase more. If you want to go up more, you need to wait for the support level to retrace. You can pay attention to the MA10 and MA20 support on the hourly line to go long. Too much rise is not a reason to fall. You just need to pay more attention to risks as you go up, and keep buying in the short term. The next big target is the 3,500 mark.
Key points:
First support: 3426, second support: 3414, third support: 3400
First resistance: 3477, second resistance: 3486, third resistance: 3500
Operation ideas:
Buy: 3417-3420, SL: 3408, TP: 3490-3500;
Buy: 3400-3396, SL: 3387, TP: 3430-3440;

The bull market is extremely strong! Keep the rhythm right!Analysis of gold trend:
On Tuesday (April 22) in the Asian session, spot gold continued to rise. Fundamentally, on Monday, as Trump's comments on Powell damaged investors' confidence in US assets, the US dollar index plummeted to its lowest level since March 2022. The United States plans to impose new tariffs on solar products imported from four Southeast Asian countries. Trump's approval rating has dropped to the lowest level since returning to the White House. The market's risk aversion has increased, and gold prices have strengthened significantly. At present, global trade tensions will continue, and concerns about economic growth and inflation expectations will continue to support gold prices.
After rising to around $3,430 at the beginning of the week, the price of gold retreated slightly to around $3,406. Before the close, it was more of a shock operation at the high of the day. Including the idea given before the break at the beginning of the week, the price of gold will continue to break new highs on Tuesday. But it was not expected that the price of gold would rise to around $3,500 during the Asian session, which was indeed a bit unexpected. At the end of the Asian session, the price of gold retreated, retreating to around $3,461. This retracement came relatively late, breaking the normal operation system. Today, it is recommended to refer to the suppression range near 3490 US dollars and 3500 US dollars for shorting. If it breaks above, refer to the daily error band indicator near 3510 US dollars for shorting. If it breaks below, refer to the support near 3455 US dollars and 3444 US dollars for longing. If it breaks below, look at the 3437-3390 US dollars range for high selling and low selling.

#XAUUSD #GOLD LONGS enter hereI have take long position here, let's how it's plays.. full Target at 3500,
BUY GOLD XAUUSD 3464 _ 3460
SL..3449
TP..3472
TP..3490

Resistance RangeThe price is approaching the resistance level. A trend change is expected to occur at this level.
The $3,400 and $3,500 levels could be the trend reversal levels.

GOLD BUY The overheated Gold rally looks to be in need of some further cooling. Traders look to be buying into the rumors that a trade deal between the US and China could come very soon, despite China coming out contradicting those rumors. The risk here could be that markets are misinterpreting the US semantic on whether they are “talking” or “negotiating”, and that no deal is done anytime soon with possibly a revisit to $3,500
Looking at technical levels, the daily Pivot Point at $3,335 is the first upside and intraday level that needs to be reclaimed. The R1 intraday resistance saw a small attempt for a test in very early opening this Friday, coming in around $3,381. Further up, Gold price could extend the rally to the R2 resistance at $3,414, surpassing the $3,400 handle.

Key Buying Levels For Monday Use Proper Money Management !
This trade is based on advanced Concept
Follow for more !
Take only 1% Risk on this Trade

Tariffs have not eased. How will gold trend in the future?Spot gold fell nearly 1% on Friday to close at 3316.26. Earlier this week, gold rose to a record high of 3500. After Trump's statement on tariffs eased, the market rose to 3500 and investors chose to close their long positions. The lowest gold price this week fell to around 3260.
At the moment when tariffs are deadlocked, any remarks made by Trump on tariffs have not reduced the risk of the market, but increased the uncertainty of the market. Next week, the gold market will usher in the World Gold Council's first quarter "Gold Demand Trends" report. In addition, next week's gathering of Trump's 100th day in office may become an important window for gold prices to choose to test the 3500 mark again or continue to fall from 3300.
This week, the international gold price as a whole showed a high and then fell, with the opening price at $3332.96, the highest price at $3499.92, the lowest price at $3260.2, and the closing price at $3316.2. After such a pattern appears, it indicates that the gold cycle will face violent fluctuations.
Quide's analysis:
If international news helps short selling, it is possible for gold to fall to 3100 or fall below 3000. Therefore, we should remain vigilant next week and pay close attention to the geopolitical situation and news such as tariffs, so as to make a buying or selling decision for next week.
At present, the Bollinger Bands continue to close, and the short-term market continues to maintain a range consolidation until the Bollinger Bands reopen and choose a new direction.
Before the upward and downward ranges are broken, the intraday short-term operation adopts the range high-altitude low-multiple operation.
There is currently no international news and comments that can analyze the trading signals for next week; Quide will pay attention to news and comments that may affect the trend of the gold market at any time, so as to bring analysis and strategies to everyone at any time.
Every calm analysis by Quaid is a step towards success. In the gold market, please trust Quaid's professional analysis. It can help you stand at the top of the gold trading market.

Interpretation of ideas after gold opensTechnical pattern: This week, gold closed in a "shooting star" pattern, which is a common peak signal, indicating that the price of gold may face a correction or decline.
Influence of news: This week, affected by Trump's tariffs and dismissal of Powell, gold first hit a record high of 3500 due to its safe-haven properties. Then Trump's remarks changed, and the price of gold plunged from the high point to around 3260. Overall, it ended in a volatile situation under the uncertainty of tariffs, Powell's stay and interest rate cuts. If there are no new safe-haven factors in the market news, there is room for further decline in the price of gold.
Short-term trend analysis
Four-hour level: After the safe-haven, the price of gold rebounded at the low point of 3260, but was unable to continue near 3370. It is believed that the high-level selling repair and low-level buying intervention have affected it. The opening of the gold price next week may continue to fall.
Hourly level: Since the decline in the price of gold, the rebound strength has been insufficient. It rebounded twice near 3260 below, and the overall center of gravity was downward before crossing 3380. Next week, pay attention to the 3330-3346 range to determine the nature of the rebound at the end of this week. At the same time, pay attention to whether 3260 can be broken. If there is a break, you can look down to 3221.
Operational suggestions: Overall, the overall idea for next week will continue to be bearish. Pay attention to the resistance of the 3330-3346 range on the top, and try to go short if it is touched; the initial support below is 3260, and the bearish trend can continue to 3221-3219 if it breaks.
Suggestions for being stuck at high positions: For investors who are standing guard at high positions, if they can withstand the pullback of gold prices, they can continue to hold and wait for the return of their capital; if not, it is recommended to recognize the loss and leave the market first, and then enter the market after the gold price has adjusted to the right level.

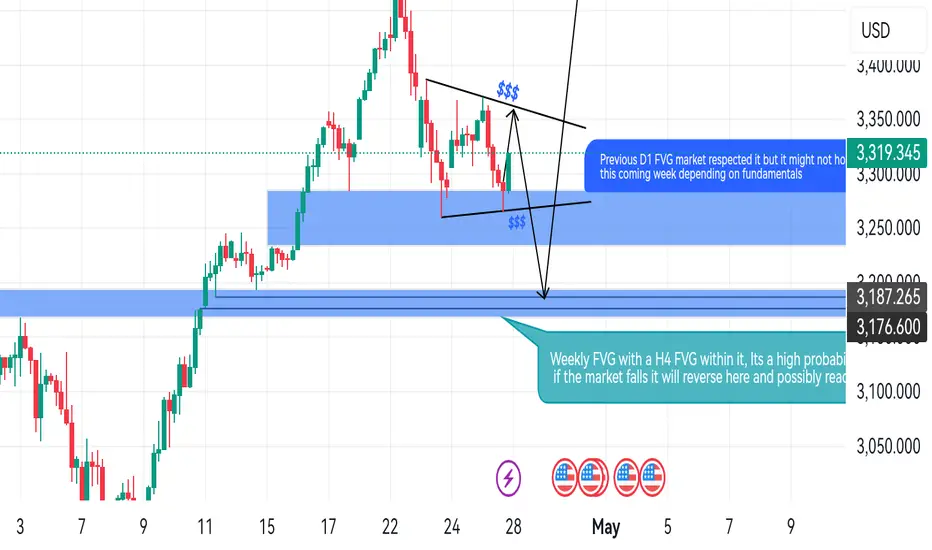
Possible Buy, explanation is in my previous analysisRefer to previous analysis!!!
Market is at the Daily gap currently but the daily gap might not hold and we could see it drop to the weekly gap where it is highly to turn around and could go all the way to 3500 area again
Gold is under pressure and falls again Short again on rebound!Gold rebounded weakly during the European session, and fell twice during the US session, with the lowest price dropping to 3265. However, even though it is extremely weak at present, it is not recommended to blindly chase the short position. The support below is 3260, which is the previous low point and is close to the volatility limit. Instead, you can try short-term long positions with a light position. The short-term pressure above is maintained at 3306, and the breakthrough will gradually reach 3315 and 3328!
Operational suggestions: Gold is short near 3310-20, and look at 3300 and 3280! Long positions can be made if the support below 3260 is not broken!
