Will gold's decline continue?A big negative line closed, covering the previous positive lines, and broke the support of the 5-day and 10-day moving averages. This wave may continue to fall to the Bollinger middle rail near 3300, but if it is a high-level shock, the Bollinger middle rail is not broken, and it may rise again to 3430. Therefore, gold has experienced big ups and downs in this cycle, and now it is possible to rise or fall. In the short cycle, pay attention to the support effect of 3355 under weakness. If it does not break, you can continue to be bullish. Investment strategy: Gold 3350 long, stop loss 3338, target 3450
USCGC trade ideas

With the Federal Reserve on hold, gold is ushering in a new engi
At 2 pm yesterday, the Federal Reserve announced that it would keep the benchmark interest rate unchanged at 4.25%-4.50%, in line with market expectations, and remained unchanged for the third consecutive meeting. After the announcement of the Fed's interest rate decision, the market continued to believe that the Fed would cut interest rates before July, and still expected three rate cuts this year.
Then Fed Chairman Powell downplayed any impression that the central bank would use interest rate cuts to ease the economic weakness caused by Trump's tariff policy at a press conference in the early morning.
Powell used the word "wait" 22 times to emphasize that the Fed is not in a hurry. He said: "We think the cost of waiting is quite low, so we are doing it."
Powell said: "In this case, we can't take the initiative because we don't actually know what the correct response to the data is until we see more data."
Powell hinted that the Fed will only cut interest rates after seeing evidence of a significant slowdown in the economy, and it may cut interest rates soon.
Returning to the market, first of all, from the gold daily chart, it can be seen that the current trend of gold is basically similar to that of the first half of the month.
There was a sharp retracement last week, and then the bottom daily line closed with a cross star, followed by a sharp rebound.
The current market is basically copying the previous market. If nothing unexpected happens, if it goes up in this trend, 3500 is very likely not the high point, and it is only a matter of time before a new high is reached.
In addition, from the 4-hour chart, yesterday, the bottom 3360 was tested many times, but it failed to break down. Today, the opening was stretched from 3360 to above 3400.
3360 is a intensive trading area suppression position in the early stage. After breaking through 3360 on Tuesday, it has not fallen below this position so far.
So, we can currently regard 3360 as an important support position.
So we can regard 3360 as the 618 support position, so as to infer the high point position.
As you can see in the picture, I have also marked the point, which is about 3450-60.
Finally, let's look at the hourly chart. You can see that from 3360 to the morning high of 3415, the Fibonacci position 50% position and 382 position are about 3390-85.
It is also about the lowest position of the callback.
In terms of future operations, you can basically rely on 3390-85 to enter the market and do more.
The upper target can basically see the 3440-60 range.

X1: GOLD/XAUUSD Buy Risking1% to make 3.63X1:
Risking 1% to make 3.63%
GOLD/XAUUSD Long for day trade, with my back testing of this strategy, it hits multiple possible take profits, manage your position accordingly.
Risking 1% to make 3.63%
Note: Manage your risk yourself, its risky trade, see how much your can risk yourself on this trade.
Use proper risk management
Looks like good trade.
Lets monitor.
Use proper risk management.
Disclaimer: only idea, not advice

GOLD - Sell Setup📉 GOLD - Sell Setup
🔹 Date: 07 May 2025
🔹 Pattern: Double Top + Break of Trendline
🔹 Entry Zone: 3387 - 3397 (Strong Resistance Rejection)
🔹 Confirmation: Clear rejection from previous supply area (highlighted in red), with break below ascending trendline.
🔹 Target 1: 3350
🔹 Target 2: 3337
🔹 Stop Loss: Above 3400
🔹 Risk/Reward: Solid setup with favorable RRR.

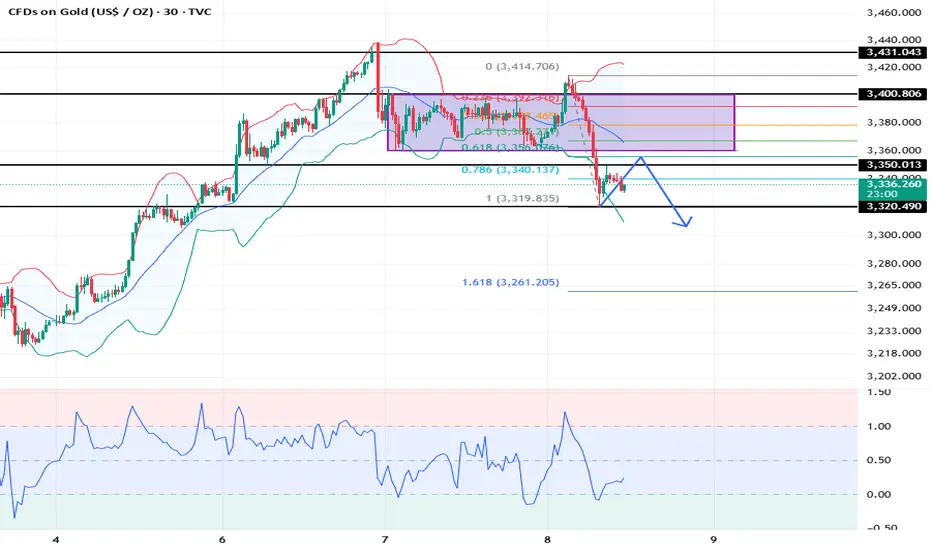
XAUUSD – 30m Precision Buy from 79% Fib + Liquidity Grab📈 GOLD LONG CONTINUATION – May 7, 2025 | Smart Money Masterclass
Here’s a 🔥 textbook entry on XAUUSD, showing exactly how Smart Money engineered liquidity, tapped into the Fair Value Gap, and launched the price from deep Fib levels.
Let’s break this down like a true Chart Ninja:
🔍 KEY CONFLUENCES IN THIS SETUP:
🧠 FVG Respect: Perfect reaction from the imbalance zone (gray box)
💰 Liquidity Sweep: Triple low fake-out → "Buy-side Engineered Liquidity" ($ symbols)
📉 Descending Trendline Break: Acting as a final bear trap
🧲 Fib Retracement: Entry from deep golden pocket zone (between 70.5% and 79%)
📊 50% EQ Magnet Above: Price reacting towards premium inefficiency
🚀 Risk-Reward Setup: ~1:6 RR targeting imbalance fill around $3435
🏗️ Structure: Price built a base with multiple accumulation candles before break
📈 Trade Details:
🟢 Entry Zone: $3,388 – $3,393 (limit filled within FVG + Fib zone)
❌ SL: Just below 79% zone at $3,386
✅ TP: $3,435 (0% Fib level / top of the range + inefficiency)
📈 RRR: ~1:6 sniper level precision
⚙️ Execution Strategy:
Confirmation entry after inducement wick
FVG + Fib overlap = High probability zone
Optional scaling in across zone: 70.5%, 75%, 79%
First partials around $3,412, full TP at $3,435 zone
💬 Chart Ninja Quote of the Day:
"The best trades don’t chase price—they wait for price to chase them."
🔒 SETUP SUMMARY:
Timeframe: 30m
Bias: Bullish
Entry Type: Limit
Confluences: FVG + Fib + Liquidity Sweep
Trade Type: Reversal from Demand
Confirmation: Structure shift + Clean W bottom
💾 Save this setup and study it frame-by-frame.
📲 Share it with your trading crew who still think breakouts are reliable 😉

GOD BUY GREAT TUESDAY
Greetings traders this is my analysis on gold and its a long for buy
Technical analysis of gold
informatoin ; Head and Shoulders
this pattern is now even more clearly presented with.
Head_ a higher peak (higher high)
Left shoulder_a weaker atempt recover , which confirms the loss of bullish strength
Usually, such a pattern is followed by a corrective move downwards (which has already been partially see)
potential trend change zone
Highlighted support in zone
3345_3325 usd _very imortant for confirming the bullish scenario.
the shown ''bounce zone'' suggests a possible purchase if the price bounces from this area
predicted path expected
fall to support (around 3345_3325 USD
Conclusion and strategy
Scenario 1(main) buy zone between 3357 3335 if price action signal is seen (pin bar engulfing
TARGET 3500+
Stoploss: Bellow 3300 support
Scenario2 (riskier) : If price does not bounce from that zone possible further deepening towards 3250 3215
Dear Traders like comment let me know what do you think

XAUUSDHi ,
The market has consistently been rising as indicated in my yesterdays Analysis , The formation of series of HIGHER HIGHS $ HIGHER LOWS from 2nd May - 5Th May. This supports yesterdays idea on testing $3372 and infact went further up to $3380
If the fast EMA (8) is above the SLOW EMA (21) it then further supports the BULLISH COURSE.
If the RSI is hovering above 70 , this indicates the asset been OVERBROUGHT signaling a potential PULLBACK.
The PRICE consolidated before breaking out UPWARD , which indicates a CONTINUATION OF THE BULLISH TREND.
The current WAVES exhibits smooth pullbacks without DEEP CORRECTIONS , signaling STRONG BUYING PRESSURE.
The sudden SURGE in PRICE indicate INCREASING BULLISH MOMENTUM or a possible EXHAUSTION.
OVERALL we should hit $3372-85 and if the price breaks the zone and moves a little further it will signal further BUYS. If the PRICE breaks $3252 going down that should be your FALL CONFIRMATION.
Meanwhile i have a few buy positions active and waiting for further confirmation.

XAUUSD:Sharing of the Latest Trading StrategyToday, all the trading signals finally yielded profits! Check it!👉👉👉
Today, gold has strongly rallied, breaking through the range-bound trading pattern. It climbed to as high as the level of 3,328 at its peak. However, there has been basically no retracement in the price of gold. Thus, it is highly probable that the safe-haven sentiment will be directly released, after which gold will commence its adjustment. Therefore, it is not appropriate to chase the upward trend at this position. Instead, it is advisable to patiently wait for the opportunity of a pullback from the high level. When there is a rebound to a high position, directly go short on gold!
Trading Strategy:
sell@3330-3320
TP:3300-3280
The signals in the Signature have brought about continuous profits, and accurate signals are shared every day. Hurry up and click to get them!
👇 👇 👇 Obtain signals👉👉👉

Gold bull-bear game intensifies
Weekly analysis of the gold market: bull-bear game intensifies, pay attention to the Fed's decision and trade situation
Market Overview
In the early Asian session on Monday (May 5), spot gold rose slightly by 0.2%, trading around $3246.44/ounce. Although retail investors are optimistic about gold prices, most Wall Street institutions are bearish on gold trends this week. The market focus has shifted to the Fed's interest rate decision this week and the progress of the international trade situation. These two factors are expected to dominate the short-term gold market.
Significant divergence between bulls and bears
Institutions are mainly bearish
Kitco survey shows that 50% of 18 analysts are bearish, only 28% are bullish, and 22% expect sideways trading.
Technical indicators show that gold is trending downward in the short term. If the US dollar rebounds due to the Fed's decision, it may further suppress gold prices.
Some analysts believe that the 7% adjustment of gold from its recent high is insufficient and there is still room for decline.
Retail investors are bullish
In Kitco's online voting, 52% of retail investors are bullish, 29% are bearish, and 19% expect consolidation.
Some believe that the current correction is excessive, and gold prices may rebound if US economic data is weak or the Fed sends a dovish signal.
Analysis of key influencing factors
Federal Reserve interest rate decision (May 7)
The market generally expects the Fed to keep interest rates unchanged, but Powell's press conference may trigger volatility.
If the Fed's statement is hawkish, a stronger dollar may suppress gold; if economic risks are mentioned, it may boost safe-haven demand.
International trade situation
The easing of trade tensions may weaken gold's safe-haven appeal, and vice versa, it may drive gold prices up.
Be wary of the market's "knee-jerk reaction" to related news, and gold volatility may increase.
Technical key positions
Support level: $3,200 (psychological barrier), if it falls below, it may fall to the $3,150-3,000 range.
Resistance level: $3,315, only after breaking through can the downward pressure be relieved.
Summary of institutional views
Bearish view:
The adjustment of gold has not yet ended. If the trade optimism continues, the gold price may test $3,000.
The rebound of the US dollar and the rise in US bond yields may further pressure gold.
Bullish view:
The current sell-off may be a short-term phenomenon, and economic and political uncertainties still support the long-term demand for gold.
If the gold price is oversold, it may attract bargain hunting.
Neutral view:
It is expected that gold will maintain a wide range of fluctuations, and the fluctuation range is large. Investors are advised to operate with caution.
Operational suggestions
Short-term traders: Pay attention to the breakthrough of the $3,200-3,315 range and follow the trend.
Medium- and long-term investors: If the gold price falls back to the $3,000-3,150 range, consider arranging long orders in batches.
Hedging strategy: Use inverse ETFs (such as GLL and ZSL) to hedge short-term volatility risks.
Summary
The gold market is currently in a stage of long-short tug-of-war. The Fed's decision and trade trends will become the key drivers of the short-term market. The technical side is bearish, but if risk aversion rekindles or the Fed releases a dovish signal, gold prices may still rebound. Investors need to pay close attention to market dynamics and adjust their strategies flexibly.

Gold Daily Outlook - XAUUSD May 4thXAUUSD Daily Outlook – May 5, 2025
Structure doesn’t lie. Gold is cooling off – but the real game might just be starting.
📊 Trend & Structure:
HTF Bias: Bullish (intact), but showing signs of exhaustion.
Daily Market Flow: Strong rejection from 3500 ATH → bearish correction underway.
Latest Daily Candle: Bearish with large upper wick – confirms aggressive selling after liquidity grab.
🔹 Key Daily Levels:
🔻 Premium Rejection Zone
Zone: 3475–3500
Confluence: Previous ATH + liquidity sweep + FVG + overextension
Note: Reversal confirmed. Sellers aggressively stepped in.
🔻 Active Imbalance Zone
Zone: 3375–3400
Context: Unmitigated bearish FVG formed after ATH rejection
What to expect: Intraday bounces possible, but mostly mitigation unless reclaimed.
🔹 Current Reaction Zone
Zone: 3220–3255
Structure: Micro CHoCH + fresh demand reaction + FVG fill
Note: Bulls defending here. Breakdown = lower retracement likely.
🔻 Key Mid-Term Support
Zone: 3050–3080
Reason: Daily demand + OB + prior BOS
Expectation: Strongest support if price breaks 3200 – ideal HTF reentry.
🔢 Fibonacci Extension Targets (if 3500 breaks)
Using impulse leg 2970 → 3500 with retrace to 3204.50:
Extension Level
Target Price
Commentary
1.0
3500
ATH (already hit)
1.12
3558
First extension zone, minor reaction possible
1.272
3610
Institutional TP1 zone
1.414
3660
Premium FVG / liquidity target
1.618
3730
Strong continuation target, reversal zone
1.786
3785
Final blow-off area, low probability without macro push
📊 Summary:
Gold reached a major milestone at 3500, swept liquidity, and is now in correction mode. As long as 3220–3255 holds, bulls may stage a short-term defense. However, failure to hold opens the door to 3050–3080, the next major structure zone.
Above 3500, use extension zones to track sentiment traps and profit-taking waves.
🧠 Final Thought:
From greed at 3500 to fear at 3200 — markets reset sentiment before the next move. Smart money isn’t emotional. Stay with structure, not ego.
🙏 Like this breakdown? Boost and follow us for sniper setups all week.
📌 Important Notice!!!
The above analysis is for educational purposes only and does not constitute financial advice. Always compare with your plan and wait for confirmation before taking action.
#XAUUSD #GoldOutlook #SMC #LiquidityHunt #SmartMoneyFlow

[ TimeLine ] Gold 5-6 May 2025📅 Today is Friday, May 2, 2025
📌 Upcoming Signal Dates:
May 5, 2025 (Monday) or
May 5 & 6, 2025 (Monday & Tuesday)
🧠 Trading Plan & Notes:
✅ Gold has undergone a significant reversal of over 2000 pips, from its ATH of 3500 down to 3200
⚠️ If the upcoming Hi-Lo range is wide, consider reversal entries or setups based on Fibonacci retracement levels
✅ I will personally be trading both signals as part of my research and ongoing strategy
⚠️ If you're risk-averse or uncertain, it’s okay to skip the May 5–6 signals
📋 Execution Plan:
🔹 Wait for the price range from the selected candles to fully form (marked by green lines on the chart)
🔹 Entry will be triggered upon breakout, including a 60-pip buffer
🔹 If SL is hit, cut/switch and double the position on the next valid setup for potential recovery
📉📈 Chart Reference:
🔗 Copy & paste this code into TradingView URL: TV/x/C5zZyXar/

Gold - Descending Channel in Daily TimeframeGold is trading in a descending channel, breakout from this channel will further determines price direction.
Gold market analysis referenceGold short-term operation strategy is to short on rebound and long on pullback. The upper short-term focus is on the 3370-3375 resistance line, and the lower short-term focus is on the 3280-3290 support line. Gold operation strategy reference: short (buy short) 20% of the position in batches when gold rebounds around 3365-3370, stop loss 10 points, target around 3330-3305, break to look at the 3290 line;

XAUUSD: 8/5 Today’s Market Analysis and StrategyGold technical analysis
4-hour chart resistance level 3410, support level 3310
1-hour chart resistance level 3380, support level 3310
30-minute chart resistance level 3350, support level 3320.
Trump said that he would hold a "large press conference" at 10 a.m. Eastern Time tomorrow, and may sign a trade agreement with the UK. Therefore, the news affected the gold price.
Russia implemented a ceasefire from 0:00 on May 8 to 0:00 on May 11 local time. The temporary ceasefire between Russia and Ukraine and the repeated situation in the Middle East may support the gold price in stages due to the risk aversion demand.
Recently, affected by the news, the daily operation range of gold is very large. Today, we will first look at the 3320-3360 range of fluctuations in the short term. If it breaks through, follow the trend and strictly stop loss!
Buy: 3323 SL: 3318
Sell: 3355 SL: 3360
More free analysis daily sharing
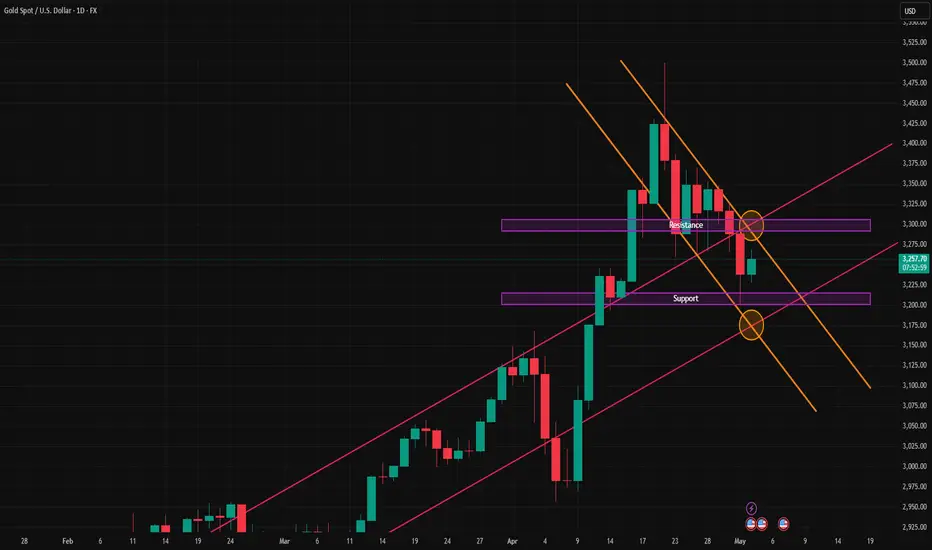
GOLDhe image you provided is a technical analysis of Gold (XAU/USD) on the 15-minute timeframe from TradingView. It clearly reflects a bearish (short) outlook for the coming weeks, potentially lasting until the end of May 2025. Here's a detailed breakdown:
🔍 Technical Context
Gold reached a high around 3,500, followed by a correction that revisited the 3,421 level, creating a strong resistance zone (likely due to liquidity grabs and profit-taking).
From there, the chart shows a potential reversal structure, with expectations of a downward move.
🔻 Bearish Scenario (Short)
The final target for this bearish move is in the 3,124–3,078 area, which represents a key liquidity zone (highlighted with dashed lines and orange horizontal levels).
Before reaching that, the price might test several intermediate support zones:
3,288
3,241
3,124
The current pattern suggests that after a strong upward impulse, the market is now likely taking a breather, possibly influenced by strength in the equity markets, which reduces gold's appeal as a safe haven in the short term.
📅 Expected Timeframe
This downward move is expected to unfold by the end of May 2025, as indicated by the vertical time markers on the chart (one marking May 15th).
📈 Additional Observations
There's a red-green box on the chart indicating the risk/reward zone for the short entry.
The previous bullish trend is marked by clear impulse and correction waves, but the current price action shows loss of momentum and possible reversal signs.

GOLD BUY SETUP INTERDAY+SWINGGold buy setup strong level for buy use proper risk management and must use of sl and tp
Buy from 3330-25
Sl 3305
Target 100-200-500 pips

Breaking news is coming! How to trade XAUUSD/GOLD?XAUUSD/GOLD continued to fluctuate and rise in the New York market yesterday. It closed at around 3430, and today the Asian market opened at a high of 3438.75. For those who followed the buying yesterday, this profit is quite generous. The interest rate decision is about to be announced, how should we trade?
Two key points need to be paid attention to, namely: the continued fermentation of geopolitics, and the Federal Reserve interest rate decision in the New York time period.
The geopolitical fermentation has eased since the Asian market began, and there is no greater news to provide momentum for the rise, so there has been a sharp drop after the opening, and the lowest reached around 3359. The decline is about 80 US dollars/ounce. The subsequent shock rebounded slightly, and the current quotation is 3387. From the trend observation, there is still an opportunity to buy on the left side of the swing trading.
The interest rate decision mentioned yesterday can be further divided into two results: unchanged interest rate and interest rate cut. The result of unchanged interest rate is that the US dollar index still maintains its value, and there is a suppression on XAUUSD/GOLD. At this time, we need to pay attention to which has a greater impact on geopolitics and the preservation of the US dollar index. The former is good for the rise of XAUUSD/GOLD. The latter has an impact on the decline of xauusd/gold. Secondly, the interest rate cut is good for xauusd/gold. If it is the latter, then it is better to do more at the same frequency.
Therefore, the trading logic is still mainly based on low-level longs. Members with larger funds can choose to buy near the current price of 3392. Members with smaller funds can pay attention to buying opportunities below 3375.
Pay attention to risk control when trading.

GOLD: Bullish Continuation & Long Trade
GOLD
- Classic bullish formation
- Our team expects pullback
SUGGESTED TRADE:
Swing Trade
Long GOLD
Entry - 3387.7
Sl - 3380.3
Tp - 3403.8
Our Risk - 1%
Start protection of your profits from lower levels
Disclosure: I am part of Trade Nation's Influencer program and receive a monthly fee for using their TradingView charts in my analysis.
❤️ Please, support our work with like & comment! ❤️

Gold takes a big dive, what happens next?Breaking news, China and the United States are preparing for tariff talks, which is a major negative. Gold plunged more than $60 from $3438 in the Asian session, and should have reached the top within the day; if there is no major positive push, the Asian session high of 3438 should not be broken again, otherwise it will definitely break once it breaks through 3500, but it is unclear how far it will go above 3500. Gold started to retrace from 3438 in the Asian session. It is currently expected that the Asian session will stop falling at the support area of 3350. In the short term, it is necessary to pay attention to whether the gold weekly line will form an evening star pattern. Once the evening star structure is formed, gold will most likely confirm that it has peaked in stages, and will experience a large-scale retracement in conjunction with the weekly top divergence! However, the daily trend is relatively repeated, so we still need to focus on the impact of news on the trend!
Gold began to smash the market in the Asian market, and the speed was too fast. Now the first wave of decline of 3360 is basically in place, and the next rebound focuses on the vicinity of 3400, which is the 61.8% position of the golden section of 3438-3360. Some news in the market dominates the long and short positions, and the trend is not like usual. Continuous rise or fall, most of the time, the news dominates the rise and fall in one day. So the performance of gold price is very eye-catching! Liquidity is high enough, and it started to adjust and fall today.
There is a reason why gold fell sharply by $60 in the Asian session. Technically, the price rushed up and approached 0.809, so with the opening of the Sino-US dialogue, risk aversion will also cool down. On the disk, the price rushed up and fell in the Asian session, and the price just returned to the 5-day moving average of the 720-minute chart, so there was a rebound, but the strength of the rebound was obviously weakening. The price was suppressed when it was on the five-minute line, so if the second wave of long orders is entered, it should be on the four-hour line. As for shorting, the price is back to the inside of the channel, so the rebound cannot be too high. If it is given to 3430 again, it will form a shock, so the corresponding pressure is here at 3397 and 3405. For today's market, it is destined to be not calm, and there will be huge fluctuations up and down. The key support below is 3352, followed by 3320. The current market sentiment is complicated, and geopolitical risks and long profit-taking coexist. In the short term, we need to be vigilant about the risk of technical correction.
On the whole, today's short-term operation of gold recommends shorting mainly on rebounds, supplemented by longs on callbacks. The upper short-term focus is on the first-line resistance of 3400-3405, and the lower short-term focus is on the first-line support of 3350-3300.
Golden strategy:
Range buying: 3345-3340, SL: 3335, TP: 3365-3375
Range selling: 3400-3405, SL: 3415, TP: 3385-3375
Key points:
First support: 3345, second support: 3340, third support: 3330
First resistance: 3400, second resistance: 3405, third resistance: 3415

Gold Market Opens with Imbalance Sweep at 3390sGold market opens the session by sweeping imbalance at 3390s, setting up momentum for a bullish hedge toward the 3450s zone. watch closely as price structure aligns with bullish sentiment. follow for more insights , comment and boost idea

XAUUSD Hi,
The Price was in an UPTREND before settling for consolidation, The moving Avarage is sloping downward, which indicates POTENTIAL REVERSAL.
We can only have a BULLISH CASE if the price breaks above the CONSOLIDATION RANGE with strong BULLISH CANDLESTICKS.
If the Candlestick Patterns show LONG RED BODIES it suggests STRONG SELLING PRESSURE , But if they begin forming HIGHER LOWS $ HIGHER HIGHS it will then be indicating BUYING PRESSURE.
Using Fibonacci Retracement Levels , We Identified KEY SUPPORT AND RESISTANCE LEVELS, where price might REVERSE or GAIN STRENGTH. The common Levels 38.2 % , 50 % and 61.8% .
if the price retraces to the 38.2% level and bounces , it suggests BULLISH CONTINUATION
if the price drops to the 61.8% level it's a stronger SUPPORT ZONE , indicating POTENTIAL BUY PRESSURE.
A break below 61.8% may signal FURTHER DOWNSIDE.
The pattern formation like DESCENDING CONTRACTING TRIANGLE, FALLING CHANNEL and FALLING WEDGES indicate SELL ENTRIES.
OVERALL we are still on Consolidation and expecting to hit $3292 and then Experience a MINOR MELTDOWN TO at least $3193 and only then we will decide on where the market is headed to.
Will be back with FURTHER UPDATES.

Analysis and Layout of Gold at the Opening of the Market!The underlying logic behind the current price movements of gold has changed. Previously, the main factor driving the sharp increase and subsequent decline of gold prices around $3,500 was the tariff war. Currently, the situation has gradually shifted from tension to relaxation, and the latest news indicates that both sides are attempting to make contact in preparation for the next round of negotiations.
Attention should now be focused on the Federal Reserve. Previously, Trump asked the Fed to cut interest rates to mitigate the economic impact of the tariff war. Powell's resistance led to Trump considering replacing the Fed chair. The better - than - expected non - farm payrolls data on Friday implies that the Fed's interest rate cut will be postponed, which is bearish for the gold market. Therefore, gold prices are likely to decline further in the early next week.
On the other hand, since the global - largest gold ETF significantly reduced its positions after gold prices peaked at $3,500 on April 22nd, it has continued to reduce its positions slightly without any significant addition of positions. This, to some extent, suggests that gold prices may further decline.
If your current gold trading performance is not satisfactory and you hope to avoid detours in your investment, you are welcome to communicate and exchange ideas with us!

Gold sellIn my opinion, there is a lot of liquidity in gold at the bottom, and currently, by collecting liquidity at 42, a very good short trade can be made on its re-fall.
