Gold Drops $200 in Hours – Panic or Opportunity? 📌 Gold Plunges $200 – Volatility Surges Amid Fed Signals and Market Panic 🔥📉
📰 What Just Happened?
Yesterday, gold (XAU/USD) experienced one of its sharpest intraday drops in recent months, tumbling from the all-time high around $3,500 to as low as $3,318, losing nearly $200 in just a few hours.
This marked a significant correction following an extended bullish trend.
🔍 Key Drivers Behind the Crash
Fed-related commentary spurred aggressive profit-taking across the market.
The USD staged a technical rebound, exerting downward pressure on gold.
Rapid sentiment shifts triggered panic selling and liquidation flows.
🧭 What’s Next for Gold?
The $3,300–3,320 zone is now a crucial support — if this level holds, a technical recovery could unfold.
However, a break below $3,300 may expose gold to deeper downside targets near $3,250.
⚠️ Strategic Considerations
This is a high-volatility environment — flexibility and strict risk management are key.
Current sentiment is fragile. Unpredictable political headlines and mixed Fed signals are adding to the uncertainty.
In the latest development, Trump clarified he has no intention to fire the Fed Chair and hinted that China’s tariffs could be eased slightly — but not eliminated. These mixed messages continue to create sharp swings in price.
📊 Trade Plan
🔻 SELL ZONE #1:
Entry: 3,378 – 3,380
Stop Loss: 3,384
Take Profits: 3,374 → 3,370 → 3,366 → 3,362 → 3,358 → 3,350
🔻 SELL ZONE #2:
Entry: 3,408 – 3,410
Stop Loss: 3,414
Take Profits: 3,404 → 3,400 → 3,396 → 3,392 → 3,386 → 3,380
🟢 BUY ZONE:
Entry: 3,292 – 3,290
Stop Loss: 3,286
Take Profits: 3,296 → 3,300 → 3,304 → 3,308 → 3,312 → 3,316 → 3,320
The priority remains to sell into rallies near resistance while the downtrend unfolds. All trades should be protected with tight stop-losses, given the current unpredictability.
🧠 Key Takeaways
This is not a market for guessing — wait for price confirmation at key zones.
Focus on reaction zones, not forecasts.
Stay light, stay nimble, and manage risk carefully — news-driven volatility is at its peak.
💬 How are you positioning in this volatile gold market? Waiting for the bounce or selling the rallies? Let us know below! 👇👇👇
USCGC trade ideas

(XAU/USD) 1H Chart: Long Setup Targeting 3,500 with Key Support Entry Point: Suggested near 3,301.51 USD (marked with the purple support zone).
Stop Loss Zone: Below 3,266.87 to 3,221.67 USD (marked in blue and purple). This is where you limit your loss if the trade goes wrong.
First Target (Target Point One): 3,376.65 USD.
Final Target (EA Target Point): 3,523.55 USD (~8.26% potential gain from entry).
Main Setup Idea:
The price is consolidating around the support zone.
There's a plan to buy (go long) at the purple zone (Entry Point) and aim for the two target points

XAU/USD: New ATH ~ $3500, What's Next? (READ THE CAPTION)Upon reviewing the 15-minute gold chart, we can see that the price once again reached a new high today, rallying up to the key psychological level of $3500. Following this move, gold has experienced a pullback down to $3423 so far. If the price stabilizes below $3442, we will likely see a further correction toward the next target at $3411. (This analysis will be updated)
Please support me with your likes and comments to motivate me to share more analysis with you and share your opinion about the possible trend of this chart with me !
Best Regards , Arman Shaban

THE KOG REPORT - UpdateEnd of day update from us here at KOG:
Gold playing ball again early session hitting the level we wanted for the long and then rejecting the hot spot for the short into the lower levels. As it's Friday, we did take it a little easier on gold, hitting 2 targets, and then 6 across other pairs giving us another sensible end to the week.
Now, we've competed the bias level targets up and down, we have support below at the 3280-75 level and resistance at 3306-10 which could be the region they want to target for the close. It's also the level to watch, unless broken we can see further downside, but we'll visit that on Sundays KOG Report.
RED BOXES:
Break above 3335 for 3345✅, 3347✅, 3355✅ and 3367✅ in extension of the move
Break below 3320 for 3310✅, 3306✅, 3296, 3286✅ and 3380✅ in extension of the move
Wishing you all a great weekend ahead.
As always, trade safe.
KOG

Gold: A Complex Outlook After Reacting Near 3,500Gold: A Complex Outlook After Reacting Near 3,500
In today's video, I discussed potential price movements for gold in the coming days. While the overall trend remains bullish, uncertainty is still present.
Be cautious—gold’s direction is not fully clear yet, despite the strong upward momentum. Key price levels and market reactions will help shape the next moves.
You may find more details in the chart!
Thank you and Good Luck!
❤️PS: Please support with a like or comment if you find this analysis useful for your trading day❤️

THE KOG REPORT - UpdateEnd of day update from us here at KOG:
Another blinder of a day on Gold! Although we didn't get the entry again that we wanted from higher up, we continued to hold with the move downside completing Excalibur and using the Indi levels and boxes to guide us.
Now we're at crucial support here and just below 3255 which if attacked and bounced, we should see a retracement up into the 3295 and 3310 regions initially. Too low to short, only support levels for tests here.
As always, trade safe.
KOG

GOLD (#XAUUSD) Technical Analysis & Important Decision Point⚠️Gold is currently at a critical support level, which will be a key factor for the market.
📉Breaking below the highlighted blue support could lead to more downward movement.
The next target for sellers would be 3243.
📈Alternatively, the price could bounce off the highlighted zone. It is advisable to wait for a bullish confirmation before considering buying.
Let's wait and see how the situation unfolds.

THE KOG REPORT - UpdateEnd of day update from us here at KOG:
another ATH, another monster move from Gold! It hit our long target, but no confirmed reversal from the region. Instead, we activated higher which we took caution on but managed to get in on the short just as we wanted using the red box indi's from better price regions. Not a bad day but we could have done with the levels playing ball.
Now we have completed the move that we initially wanted and got a bounce which turns resistance into the 3440 level on the reversal! That's the level that needs to be watched for the break above forcefully to then take out another new ATH and then give another potential entry.
To much going on to keep track off, so level to level unless we get the extreme levels.
As always, trade safe.
KOG

GOLD (XAUUSD) : Is it the bearish time?!Hello guys!
Key Elements:
Internal Trendline (broken): A previously respected trendline is now broken, indicating a potential shift in trend.
S&D (Supply & Demand) Zone: Located around the $3,280–$3,300 region.
Bearish Rejection Zone: Price attempted to push higher into the $3,360–$3,380 resistance zone but was rejected.
Arrow Indicating Bearish Target: Projected move toward $3,245.94.
why:
1. Trendline Break
The internal bullish trendline has been decisively broken, a classic sign of a trend reversal or at least a significant pullback.
After the break, price retested the underside of the trendline, failed to reclaim it, and showed bearish pressure.
2. Supply Zone Rejection
A clear rejection occurred from a supply zone ($3,360–$3,380), evidenced by long wicks and bearish candles.
This confirms the presence of sellers and likely distribution at that level.
3. Volume Profile Insight
The point of control (POC) and high-volume node sit around the $3,245 region, which also aligns with the marked bearish target.
Price is likely to be drawn toward this level as it's a fair value area where previous consolidation occurred.
4. S&D Flip
A previously bullish demand zone (around $3,280) has now become a resistance level, confirming a shift in market sentiment.
🔻 Bearish Scenario:
Target: $3,245.94
Confirmation: Failure to close above $3,360 and continued lower highs suggest bearish continuation.
✅ Confluence Factors Supporting a Move Down:
Trendline break and successful retest.
Rejection from resistance (supply zone).
Lower high formation.
Volume profile attraction to a lower value area.
Bearish market structure forming.
____________________
📌 Conclusion:
This chart setup suggests a short-term bearish bias for Gold Spot (XAU/USD), with a potential drop toward the $3,245 zone. Traders may consider watching for confirmation via continued bearish price action and potential volume increase on the next leg down.

Gold Hits New ATH Again: Is the Bull Run Unstoppable?After printing a new All-Time High on April 17, Gold entered a brief correction that ended on April 18 at 3285. However, the daily candle closed strong at 3327, right before the long Easter weekend.
Fast forward to Monday's ASIA session open, Gold showed no hesitation and pushed into yet another ATH at 3384.
The bullish momentum is so aggressive that it feels like nothing can stop this trend. While I do expect heavy volatility going forward, the core strategy remains clear:
👉 Buy the dips.
Key Level to Watch:
📍 First support zone = 3350
At this level, I will actively look for long entries, targeting a potential new ATH later this week.
Disclosure: I am part of Trade Nation's Influencer program and receive a monthly fee for using their TradingView charts in my analyses and educational articles.

Learn the Harsh Truth About Success & Failure in Trading
The picture above completely represents the real nature of trading:
We all came here because we all wanted easy money.
Being attracted by catchy ads, portraying the guys on lambos, wearing guccies and living fancy lives, we jump into the game with high hopes of doubling our tiny initial trading accounts.
However, the reality quickly kicks in and losing trades become the norm.
The first trading account will most likely be blown .
In just one single month, 40% of traders will be discouraged and abandon this game forever.
The rest will realize the fact that the things are not that simple as they seemed to be and decide to start learning.
The primary obstacle with trading education though is the fact that there are so much data out there, so many different materials, so many strategies and techniques to try, so the one feels completely lost .
And on that stage, one plays the roulette: in the pile of dirt, he must find the approach that works .
80% of the traders, who stay after the first month, will leave in the next 2 years. Unfortunately, the majority won't be able to find a valid strategy and will quit believing that the entire system is the scam.
After 5 years, the strongest will remain. The ones that are motivated and strong enough to face the failures.
With such an experience, the majority of the traders already realize how the things work. They usually stuck around breakeven and winning trades start covering the losing ones.
However, some minor, tiny component is still missing in their system. They should find something that prevents them from becoming consistently profitable.
Only 1% of those who came in this game will finally discover the way to make money. These individuals will build a solid strategy, an approach that will work and that will let them become independent .
That path is hard and long. And unfortunately, most of the people are not disciplined and motivated enough to keep going. Only the strongest ones will stay. I wish you to be the one with the iron discipline, titanic patience and nerves of steel.
❤️Please, support my work with like, thank you!❤️
I am part of Trade Nation's Influencer program and receive a monthly fee for using their TradingView charts in my analysis.

GOLD 4H CHART ROUTE MAP UPDATE & TRADING PLAN FOR THE WEEKHey Everyone,
Please see our updated 4h chart levels and targets for the coming week.
We are seeing price play between two weighted levels with a gap above at 3330 and a gap below at 3282. We will need to see ema5 cross and lock on either weighted level to determine the next range. We have a bigger range in play then usual.
We will see levels tested side by side until one of the weighted levels break and lock to confirm direction for the next range.
We will keep the above in mind when taking buys from dips. Our updated levels and weighted levels will allow us to track the movement down and then catch bounces up.
We will continue to buy dips using our support levels taking 30 to 40 pips. As stated before each of our level structures give 20 to 40 pip bounces, which is enough for a nice entry and exit. If you back test the levels we shared every week for the past 24 months, you can see how effectively they were used to trade with or against short/mid term swings and trends.
BULLISH TARGET
3330
EMA5 CROSS AND LOCK ABOVE 3330 WILL OPEN THE FOLLOWING BULLISH TARGET
3372
EMA5 CROSS AND LOCK ABOVE 3372 WILL OPEN THE FOLLOWING BULLISH TARGET
3414
BEARISH TARGETS
3282
EMA5 CROSS AND LOCK BELOW 3282 WILL OPEN THE RETRACEMENT RANGE
3224
3190
EMA5 CROSS AND LOCK BELOW 3190 WILL OPEN THE SWING RANGE
SWING RANGE
3131 - 3077
As always, we will keep you all updated with regular updates throughout the week and how we manage the active ideas and setups. Thank you all for your likes, comments and follows, we really appreciate it!
Mr Gold
GoldViewFX

Gold vs Bitcoin — Is a Historic Shift Coming ?Hello Traders 🐺
In this idea, I want to take a closer look at the GOLD price — because lately, many people have been asking:
"Where is the top?"
"Are we still bullish on gold?"
And more importantly:
"What’s your take on this as both a crypto trader and macro analyst?"
So let’s dive in and break it down from both the fundamental and technical perspectives.
🟡 Gold and Its Correlation with Other Assets
As you probably know, gold is a safe haven for long-term investors, central banks, and governments.
So when inflation rises or when we see money-printing policies to avoid a recession, gold tends to shine — because it’s a classic anti-inflation asset.
But here’s the catch:
Gold isn’t the only game in town.
Other inflation-hedging assets like Bitcoin, stocks, silver, and real estate also compete for capital — so it’s natural to see money rotate between them.
🇺🇸 Trump’s Policy Twist — Gold vs Bitcoin?
A few weeks ago, Donald J. Trump hinted that the U.S. might sell part of its gold reserves to buy BTC.
Crazy, right? But here’s where the story gets really interesting...
If this happens, we could start seeing an inverse relationship between gold and BTC — kind of like the early days of oil vs. gold correlations.
Let me break it down.
🤖 BTC vs. Gold — Simple Math, Big Picture
Gold’s current market cap is about $22 Trillion — which is almost 20 times larger than BTC’s.
Let’s ask a simple question: Do we need another GETTEX:22T to pump gold 100%? 👉 No.
Why?
Because most gold is held by:
Central banks
Governments
Jewelry industry
Only a small percentage is available for trading. So even a tiny reduction in selling pressure = huge impact on price.
But here’s the flip side: BTC’s market cap is just $1.7T, and a huge portion is held by:
Institutions like BlackRock
Whales like Michael Saylor
Lost wallets from early adoption
So it’s simple:
👉 BTC has way more room to grow, and is easier to store, transfer, and scale.
If we enter a new QE cycle, the upside potential for BTC will be far greater than gold — and smart money knows this.
🧠 Technical Analysis (TA) Time
On the chart, gold has broken above a rising wedge — which is typically a bearish pattern.
So... is this a trap?
In my opinion: No.
Why?
Because if the wedge breakdown were to play out fully, the target would be around $280, which is just laughable 😂 — a 90% crash? Highly unlikely.
Instead, here’s the bullish scenario:
If gold can hold above the monthly support, we may see a slow, steady rally — not parabolic like crypto, but meaningful.
🎯 Bullish target: $7,760
📉 DXY, Fed Policies & Gold’s Future
As I said in my last idea about the U.S. Dollar Index (DXY), the dollar is showing weakness, and the Fed might cut rates to avoid a recession.
Check the chart I posted here: 👉 DXY Chart Idea :
What do we see?
A clear double top pattern
Breakdown from key support
Probable shift to QE mode
All of this could ignite a new bull cycle — and yes, gold may benefit...
…but don’t forget what I said about Trump.
If the U.S. starts selling gold to buy BTC, we might see a short-term correction in gold back to the green support box before the real breakout.
So make sure to stay sharp — and as always:
🐺 Discipline is rarely enjoyable, but almost always profitable. 🐺
🐺 KIU_COIN 🐺

"XAU/USD at Crucial Support Zone"📈 Chart Overview
Instrument: Likely XAU/USD (Gold vs USD)
Date: April 22, 2025
Timeframe: Appears to be a short-term chart (possibly 1H or 4H)
🧠 Key Technical Elements
1. Exponential Moving Averages (EMAs)
50 EMA (Red): Currently at 3,406.818 — acting as short-term dynamic support/resistance.
200 EMA (Blue): Currently at 3,277.286 — indicating long-term trend direction.
The price is well above the 200 EMA, indicating a bullish long-term trend. However, it’s now testing the 50 EMA, suggesting a potential short-term inflection point.
2. Support and Resistance Zones
Immediate Resistance Zone: Around 3,430 – 3,440, which price recently rejected.
Key Support Zone: Around 3,385 – 3,390 (labeled “FOCUS ON THIS POINT”), which aligns closely with the 50 EMA.
Lower Support Zones:
3,310 – 3,320
3,240 – 3,260
🔍 Technical Scenarios Outlined on Chart
✅ Bullish Scenario (Upper Arrow Path)
If the price holds above the 3,385 support zone, especially with support from the 50 EMA:
We may see a bounce back to test and potentially break above the 3,430 resistance.
This would confirm a continuation of the uptrend.
⚠️ Bearish Scenario (Lower Arrow Path)
If the price fails to hold above 3,385:
A breakdown may lead to a drop toward 3,320, with possible continuation toward 3,240.
This would indicate a short-term bearish correction within a longer bullish trend.
🔑 Critical Price Level
Focus on the 3,385 zone — This is a confluence area where:
Horizontal support meets
50 EMA is located
A potential decision point for bulls vs. bears
🧭 Trading Strategy Considerations
For Bulls:
Look for bullish candlestick formations or volume confirmation near the 3,385 level.
Target a retest of the 3,430+ area with stops below 3,375.
For Bears:
Watch for strong bearish breakdown below 3,385.
First target: 3,320, second: 3,240, with stop-loss above 3,400.
📌 Conclusion
The chart illustrates a key inflection point. Price is at a decision zone — hold and bounce = continuation of bullish momentum, break = short-term correction. All eyes on how price reacts at the 50 EMA and support zone near 3,385.

GOLD (XAUUSD) May Continue Dropping, Here is WHY!The price of 📉GOLD may continue to fall after consolidating at a significant intraday resistance level.
The price broke and closed below the support level of the horizontal range. This violation confirms a bearish trend continuation.
The target price is 3247.

Bearish Rejection at Resistance – Potential Drop Incoming🔍 Chart Analysis Summary
1. Key Zones
Resistance Zone: ~$3,340 – $3,360
Price has been rejected multiple times from this area, showing strong selling pressure.
Support Zone: ~$3,200 – $3,240
Strong historical support level, previously held during a pullback after the last rally.
2. Moving Averages
EMA 50 (Red): Currently at ~$3,340
Price is fluctuating around it, indicating short-term indecision or a possible retest.
EMA 200 (Blue): Currently at ~$3,300
Acting as a mid-term support level. Price previously bounced from this region.
3. Pattern and Price Action
Fakeout Potential:
The chart suggests a possible false breakout above the resistance followed by a sharp drop—highlighted by the arrow. This is a common bull trap setup.
Bearish Outlook Indicated:
The projected path suggests a rejection from resistance and a drop to the support zone (~$3,200). This would create a lower high, a bearish sign.
4. Trading Bias
Bearish Setup if:
Price fails to hold above $3,340 (EMA50).
Price gets rejected from the resistance zone and breaks below $3,300 (EMA200).
Bullish Invalidated if:
Price closes convincingly above the $3,360 resistance with volume, flipping it into support.
📉 Potential Trade Idea
Short Entry: Around $3,350–$3,355
Stop Loss: Above $3,365 (above resistance zone)
Target: $3,220–$3,230 (support zone)

GOLD – Will the Correction Continue or Is It Over?📉 What happened yesterday?
Gold extended its drop and touched a low around 3260. A recovery of around 1000 pips followed — a typical day for Gold lately, just daily noise...
However, during the Asian Session, selling pressure kicked in again and we’re now seeing fresh weakness.
❓ Has Gold finished correcting or is there more to come?
That's the big question. And the answer might lie in the 3300 zone — specifically the 3285–3300 range. Why? Because this is where the last powerful bullish impulse started, the one that took Gold to kiss the 3500 level.
🔍 Why continuation of the correction is still possible:
- We’re seeing a retest of support, not a new higher low – this weakens the bullish case.
- The Asian Session high lines up with the old ATH, potentially forming a Head and Shoulders pattern – not confirmed, but worth watching.
At least the market madness of the past days has now given us clearer levels to work with:
→ Below 3280 = further downside possible, with 2k pips target if H&S confirms
→ Above 3350 = likely trend resumption, aiming again for 3500
📌 My trading plan:
Even though I always work with 2 scenarios, I usually have a preferred one. It's not the case at this moment, so I'm still out.
- If I see momentum above 3350, I’ll look to buy.
- If I see a break under 3300 with confirmation, I’ll look to sell continuation.
Disclosure: I am part of Trade Nation's Influencer program and receive a monthly fee for using their TradingView charts in my analyses and educational articles.

Lingrid | GOLD Weekly Analysis: CORRECTIVE Phase after the SurgeOANDA:XAUUSD market initially rallied during the week, reaching the key 3500 level. However, we have a corrective move, showing a bit of profit taking as traders are looking to the tariff noise for direction. The market made a sharp decline resulting in a long-tailed bearish bar on the weekly timeframe, suggesting the price may continue pushing lower toward the 3150 support levels. The price shows similar price action to what we saw at the beginning of this month when a market decline was followed by a week of sideways movement, which then led to continuation of the bullish trend.
I think we might see 2 scenarios to identify the potential endpoint of this corrective move. On the daily timeframe, the price is near the 50% retracement of the bullish swing move, which may be a potential level for continuation. The second scenario is an ABCD pullback where price dips below the 3200 level to find support. In any case, we should react to the price action and how it develops. If the Monday candle gaps up, this potentially indicates that price may move higher. And if we get a gap down, then we can expect a deeper pullback in the market.
Traders, if you liked this idea or if you have your own opinion about it, write in the comments. I will be glad 👩💻

Fading Gold’s All‑Time HighGold has just posted a euphoric all‑time high at 3 499.6 after an almost parabolic climb along a single ascending trend‑line, and the wick that pierced that level sits in a thin, low‑volume pocket on the profile—classic bull‑trap territory—so once we see a four‑hour close beneath the trend‑line we expect momentum algos to flip, dragging price swiftly toward the 3 160‑3 130 demand block that marks the prior high‑volume consolidation; the short thesis is to scale into shorts between 3 480‑3 510, place invalidation above 3 525, and ride a potential vacuum move to that target zone (with room to extend toward 3 100) as crowded longs unwind, especially if a hawkish Fed headline or uptick in real yields provides the spark.

GOLD DAILY CHART MID/LONG TERM UPDATEHey Everyone,
After completing our last daily chart idea please see update on our new daily chart idea. We have also updated a new Goldturn ascending channel.
We are seeing price break out of the channel but will need ema5 to lock outside of the channel to confirm the breakout vs a fakeout. If this happens then the channel top is likely to to form support for a continuation, just like we are seeing the current candles bounce from the channel top, as support.
This is the beauty of our Goldturn channels, which we draw in our unique way, using averages rather than price. This enables us to identify fake-outs and breakouts clearly, as minimal noise in the way our channels are drawn.
We will use our smaller timeframe analysis on the 1H and 4H chart to buy dips from the weighted Goldturns for 30 to 40 pips clean. Ranging markets are perfectly suited for this type of trading, instead of trying to hold longer positions and getting chopped up in the swings up and down in the range.
We will keep the above in mind when taking buys from dips. Our updated levels and weighted levels will allow us to track the movement down and then catch bounces up using our smaller timeframe ideas.
Our long term bias is Bullish and therefore we look forward to drops from rejections, which allows us to continue to use our smaller timeframes to buy dips using our levels and setups.
Buying dips allows us to safely manage any swings rather then chasing the bull from the top.
Thank you all for your likes, comments and follows, we really appreciate it!
Mr Gold
GoldViewFX

XAUUSDWe are entering short around 3500 for a quick short term sell off until 3270
sharing your thought in comment would help us al ot

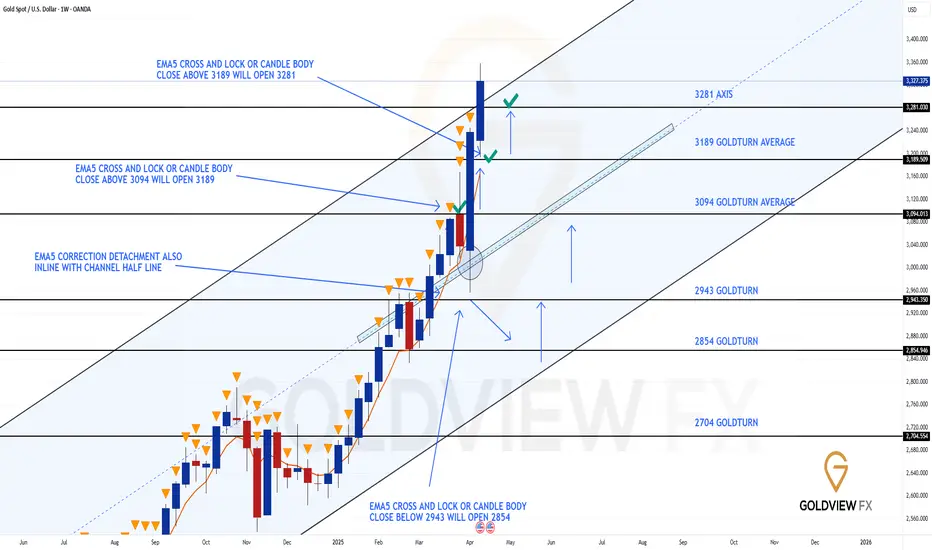
GOLD WEEKLY CHART MID/LONG TERM ROUTE MAPHey Everyone,
Please see update on our week chart idea, which has been playing out perfectly allowing us to track the movement down and trade the movement up and finally complete - BOOOOM!!!
After completed all our [previous targets on this chart, we were left with a body close above 3189 leaving a long range/term gap to 3281. This target was hit last week completed this chart idea.
We will now update a new weekly chart idea next week with more long term/range projections. Please keep an eye out for this for next Sunday or if we get a chance, we will try and get this out earlier.
However, please note if we see a rejection here on the channel top, then the lower levels within the channel, are still valid to track the movement down and up.
Thank you all for your likes, comments and follows, we really appreciate it!
Mr Gold
GoldViewFX
Gold's Cup and Handle: Historical Analysis, post completionThe recent completion of a Cup and Handle pattern on Gold price action leaves an open question about the historical performance after such a technical formation plays out. While Cup and Handle patterns are generally considered bullish, there are legitimate historical reasons to question maintaining a long position after the pattern completes.
Pattern completion often marks exhaustion points
======================================
Historically, the completion of a Cup and Handle pattern indicates near term exhaustion of buying pressure rather than the beginning of a sustained move higher. This occurs because:
1) The pattern completion itself often represents the culmination of a buildup in speculative long positioning.
2) Technical traders who entered based on the pattern may take profits once their target is achieved.
3) The psychological milestone of completing the pattern can trigger selling from larger institutional players.
For example, the technical Bull flag of 2001 on completion saw a 40% following correction. Were that to happen on the Cup and Handle pattern upon completion price action would return to $1950
2001 Bull flag
Monetary policy transition periods
======================================
Historical analysis shows that gold's technical pattern reliability decreases significantly during periods of monetary policy transitions. If the Cup and Handle completion coincides with a shift in central back policy stance (particularly Federal Reserve policy), historical precedent suggest heightened risk of pattern failure.
Looking left, breakouts in the Bond market resulted in serious downside pressure for Gold price action, the Federal Reserve may not have a choice in the months ahead. Especially as the cost of servicing the debt grows and foreign entities increase Bond market selling pressure.
10 year Bond breakout
Conclusion
======================================
While the Cup and Handle pattern is traditionally viewed as bullish, historical data specific to gold markets suggest caution about maintaining long position immediately following pattern completion. The historical tendency toward mean reversion, pattern reliability concerns, volatility expansion, and correlation breakdowns all suggest that a more measured approach may be warranted.
Ww
