The non - farm payrolls data has "disrupted" the gold market.This week’s trading wrapped up successfully. Our exclusive VIP trading signals achieved a 95% accuracy rate!
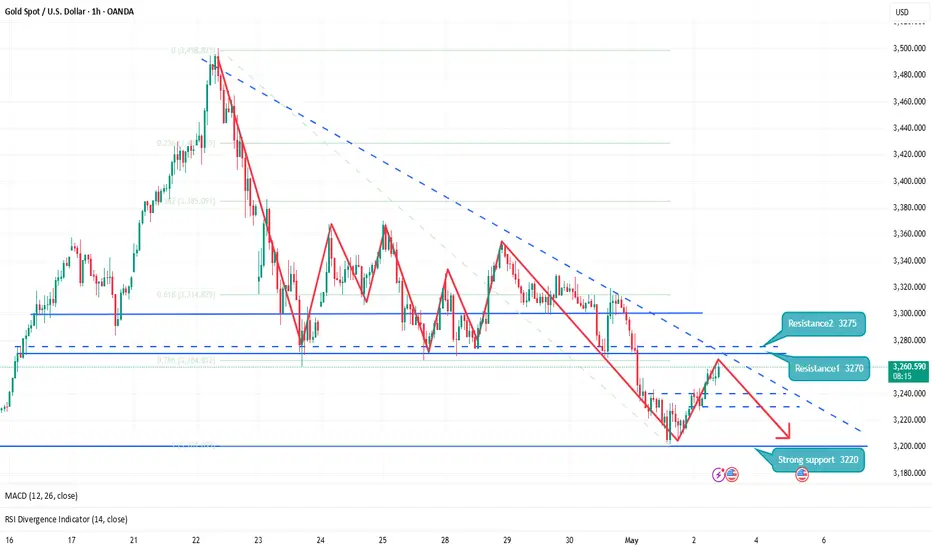
After the release of the non-farm payrolls data last night, the gold price dropped as expected, but then it quickly bottomed out and rebounded, continuing to maintain a volatile trend. Recently, the impact of the non-farm payrolls data on the gold market seems to be gradually weakening, and its fluctuation range is even smaller than usual. In the 1-hour chart of gold, the moving averages formed a bearish arrangement with a death cross pointing downward, and they eventually continued to diverge downward. Currently, gold is under pressure and has pulled back under the suppression at the level of 3,270. Therefore, the area around 3,270 will still be a crucial turning point between the bulls and bears of gold next week. Although there was a rebound in the late night for gold, in fact, the extent of the rebound was not significant compared with the decline. If gold fails to break through the pressure at 3,270 next week, at most, it will just be in a range-bound situation, and the bullish trend of gold will not reverse easily for the time being.
Trading Strategy:
Sell@3260-3270
TP:3230-3240
If your current gold trading performance is not satisfactory and you hope to avoid detours in your investment, you are welcome to communicate and exchange ideas with us!
USCGC trade ideas

Latest gold price range: 3230-3270Latest gold price range: 3230-3270
Important news:
The non-farm payrolls data released on Friday was strong: the next rate cut by the Fed may have to wait until July at least.
If the employment data is strong again in the future, the timing of the rate cut may be further delayed.
After the release of the non-farm data last night, the gold price fell as expected, but then quickly bottomed out and rebounded, continuing to fluctuate.
At present, the gold price is under pressure at the 3270 line and has fallen back, so the area near 3270 will still be the key turning point for gold bulls and bears next week.
If the gold price is under pressure at 3270 next week and does not break, it will fluctuate at most, and the gold bulls will not reverse directly and easily for the time being.
From the 4-hour chart analysis, the non-farm market has basically ended, and the upper side continues to pay attention to the suppression of the 3270 line, with a focus on 3300.
From a technical point of view, the gold daily line shows a bottoming rebound trend, and the price forms a short-term support in the 3230 line area.
Upper pressure: 3270-3300
Lower support: 3220-3230
Operation strategy:
1. It is recommended to short gold near 3260-3270 next week, stop loss 3270, target: 3240-3230-3220.
2. Long gold near 3220-3230, stop loss 3210, target: 3240-3260. If it breaks through, continue to hold;

Gold Buy after NFPIt can be seen that gold when nfp has decreased but the buying power on gold is still strong, my prediction is that gold can still make an increase.
SL: 3230 (300 pips)
TP: 3290

Gold INTRADAY corrective pullback supported at 3218Gold slipped to the $3,200 area as optimism grew over possible US-China tariff talks, which boosted risk sentiment and pushed the US Dollar to a 3-week high. However, gold’s downside may be limited as traders grow cautious ahead of Friday’s US Nonfarm Payrolls (NFP) report.
Despite USD strength, growing expectations of Fed rate cuts—possibly four by year-end—are supportive for gold in the medium term. This follows weak US economic data:
GDP contracted for the first time since 2022
PCE inflation is easing
Jobless claims hit a 2-month high
ADP jobs report showed cooling private-sector hiring
ISM Manufacturing PMI remained in contraction
Key NFP Expectations (Friday):
+130K jobs (down from 228K prior)
Unemployment Rate: steady at 4.2%
Wage Growth: +0.3%
Conclusion for Gold Traders:
Short-term pressure on gold from stronger USD and trade optimism, but soft US data and rising rate cut bets may provide support. Watch NFP closely — a weak report could trigger a bullish move in gold.
Resistance Level 1: 3392
Resistance Level 2: 3457
Resistance Level 3: 3500
Support Level 1: 3218
Support Level 2: 3173
Support Level 3: 3130
This communication is for informational purposes only and should not be viewed as any form of recommendation as to a particular course of action or as investment advice. It is not intended as an offer or solicitation for the purchase or sale of any financial instrument or as an official confirmation of any transaction. Opinions, estimates and assumptions expressed herein are made as of the date of this communication and are subject to change without notice. This communication has been prepared based upon information, including market prices, data and other information, believed to be reliable; however, Trade Nation does not warrant its completeness or accuracy. All market prices and market data contained in or attached to this communication are indicative and subject to change without notice.

How to layout gold before non-agricultural data🗞News side:
1. Progress in Sino-US tariff negotiations: The United States has recently contacted China through multiple channels, releasing signals that a trade agreement may be reached. Market concerns about trade friction have significantly cooled down, weakening the safe-haven appeal of gold.
2. The U.S. non-farm payrolls report for April will be released today (expected to add 130,000 new jobs). If the data is weak, it may strengthen expectations for an interest rate cut. On the contrary, if it is stronger than expected, the interest rate cut schedule may be further delayed.
📈Technical aspects:
Gold bottomed out yesterday and has now rebounded to around 3250. For the current market situation, the previous low of 3260-3270 has become an important resistance level above the gold price after the top-to-bottom conversion. In addition, non-agricultural data will be released in the U.S. market today. Therefore, if gold wants to reverse upward, the first resistance will be in the 3260-3270 range. If the counter pull from the bottom fails to stabilize at 3270, then there will be a downward trend. If it breaks through this resistance range, it may test the 3286 line. Before the release of non-agricultural data, the European market can be shorted when encountering resistance at 3260-3270. Everyone is waiting patiently for the opportunity to enter. The following focuses on the important support of 3200.
If you agree with this point of view, or you have a better idea, please leave a message in the comment area. I look forward to hearing different voices.
GOLD : Intraday Bearish SignalThe price of 📉GOLD is likely to keep falling, following a significant downward trend.
After consolidating within a horizontal range on a 4-hour time frame, the support of the range was recently broken, signaling strong selling pressure and a probable continuation of the bearish trend.
It is possible that the pair will soon reach the 3200 support level.

XAUUSDH1 down trend started, let's wait for the price to create a new Lower High around a Key Level, to allow us to sell

Gold is in the Bearish DirectionHello Traders
In This Chart GOLD HOURLY Forex Forecast By FOREX PLANET
today Gold analysis 👆
🟢This Chart includes_ (GOLD market update)
🟢What is The Next Opportunity on GOLD Market
🟢how to Enter to the Valid Entry With Assurance Profit
This CHART is For Trader's that Want to Improve Their Technical Analysis Skills and Their Trading By Understanding How To Analyze The Market Using Multiple Timeframes and Understanding The Bigger Picture on the Charts

XAUUSD Latest trading opportunities.All profits for five consecutive days of trading. Are you still losing money?
Yesterday, I prompted to sell at a higher position. But today, the Asian market has seen some gains. The highest impact reached 3414, and then fell back by more than 100 US dollars, and the lowest touched 3320. Our high-altitude thinking is completely correct.
It has helped members to make some considerable profits from selling orders.
The market changes a lot. The lag is very strong, mainly because the good news is suppressed, leading to the trend of bad news. This is an aspect that needs to be focused on when trading. The market situation better proves the accuracy of my swing trading strategy.
The current price is at 3345. We need to pay attention to the pressure of the 3362-3355 range and the support of 3300. The trading is still mainly selling.
To prevent missing out on some good trading strategies and ideas, remember to continue to pay attention to the ideas of the swing trading center. If you want to get more and more accurate signals, you can leave me a message.

Sell We have a high probability Sell Set up on GOLD, make sure to not go with more than 1%. When the price gives 1:1 RR make sure to go B.even. 1:2 take 80% and let it run.

Gold technical analysis and trading strategy
Affected by the hawkish stance of the Federal Reserve and the strengthening of the US dollar, gold has been under pressure and fluctuated recently, but geopolitical risks and the news of Trump's upcoming "major trade agreement" have made market sentiment cautious. Some bulls chose to take profits in the Asian session, and the price fell from the highs, showing a long-short tug-of-war pattern on the technical side.
Technical structure analysis
Although the daily level has a top and bottom structure of long-short transformation, the price still holds steady at 3300, indicating that the medium-term trend has not weakened. The current price is running near the key neckline support, and the 3320-3300 area will become an important defense line for bulls, and the upper 3380-3400 constitutes short-term resistance. The hourly chart shows that the price fell below the lower edge of the previous trading day's oscillation box at 3370, the moving average system is arranged in a short position, and the MACD runs below the zero axis, and the short-term trend is weak. The European and American sessions need to focus on the breakthrough direction of the 3310-3365 range.
Operation strategy suggestions
Short-term trading:
If the price falls back to 3310-3315, try to buy with a light position, stop loss below 3299, target 3340-3350
Rebound to 3360-3365, short under pressure, stop loss above 3375, target 3330-3320
Trend layout:
If the price falls below 3300, short orders can be followed up to 3280-3260
If the price breaks through 3380 resistance, it is expected to restart the upward trend and test above 3400
Risk warning
Focus on the content of Trump's press conference in the evening. Any unexpected details of the trade agreement may cause drastic market fluctuations. It is recommended that traders strictly control their positions and do a good job of stop loss protection. The current market sentiment is sensitive, and the game between technical and news aspects is intensifying, so we need to remain flexible.

What’s America's Real Goal in a Possible India–Pakistan War?We are nearing the end of the petro-dollar era. The power balance of the new world order will be defined not by oil, but by the strategic resources essential for AI, electric vehicles, and cutting-edge technology.
Throughout the 20th century, the U.S. maintained its global dominance by controlling access to oil. From the Middle East to Latin America and Africa, wherever oil was found, the U.S. was there.
But today, the focus has shifted to rare earth elements, lithium, copper, and other strategic minerals.
Trump’s 2025 move to buy Greenland wasn’t a diplomatic joke—it was a signal. Behind-the-scenes deals in Ukraine for rare earth deposits tell the same story: whoever controls these "white gold" assets will lead the tech-driven world.
Now enters Pakistan, with mineral-rich lands spanning over 600,000 km², nearly three times the size of the UK. Experts estimate its underground reserves to be worth $8 trillion.
In Balochistan's Rekodik field alone, there are 12 million tons of copper and 20 million ounces of gold, with a copper purity of 0.53%, well above global standards. In the north, newly discovered lithium reserves could be a game-changer for the EV revolution.
This is no longer just about resources—this is about deciding the future balance of global power.

XAU/USD LONGXAU/USD LONG "break of a resistance area and retest it + 38.2% fib retracement + 50 ema dynamic support "


Potential 1:3 Buys on GOLDOpportunity ahead as Gold reaches for ATH.
War news plus confirmations on 4 hour candles as bullish bias.
1:3 RR
SL - 3,351
TP 1- 3,415
TP 2 - 3,438
TP 3 - 3,499

Gold Intraday Trading Plan 5/7/2025Gold has broken every possible resistance and is going towards 3500 previous ATH. I am still expecting strong bullish move today.
I will look for buying opportunity from 3387.
1st target 4430
2nd target 3500

Risk aversion in the international situation is escalating! Gold has risen strongly again, breaking the shock, and there is basically no pullback. It is very likely that the risk aversion sentiment will be released directly, and gold will start to adjust again. Therefore, it is not suitable to chase more at this position now. It is better to wait patiently for the opportunity to fall back. Gold may rise and fall at any time. In the shock rise, it is very likely that the price will return to the starting point or lower in the later trend, but it can continue to rise. This is a feature of the shock. At the same time, the current market is not extremely strong and is still in the shock rise. Therefore, don't chase more, but retrace to support more.
Investment strategy: Gold 3340 short, stop loss 3050, target 3200

Xauusd.4h chart pattrentrend line and is showing strong bullish momentum, that supports your target of 3365. Here's a quick technical outlook based on your info:
Entry: 3272
Target: 3365
Trend: Bullish breakout (potential for continuation)
Upside Potential: 93 points
Suggested Stop-Loss (if not set): Near recent support or just below breakout zone (e.g., 3245–3250) for risk management
Watch for confirmation like:
Strong bullish candles on higher timeframes (e.g., 1H, 4H)
Volume increasing on the breakout
Retest of the trend line acting as support
Would you like a visual chart analysis or real-time gold price check?

Gold (XAU/USD) Analysis – 1H
🏛 1. Current Market Structure
📈 During the Asian session open, gold showed a strong bullish reaction, confirming a resumption of upward momentum.
📐 The breakout of the trendline and reclaim of prior levels indicate a clear exit from consolidation.
🌍 2. Bigger Picture Outlook
🚀 This bullish impulse could now push gold towards new all-time highs, with targets above $3,500.
🗓 On Wednesday, Jerome Powell will speak – a potential rate cut is on the table, which could weaken the dollar, but might also hurt gold short-term if markets anticipate a rebound in growth.
🔍 3. Key Technical Observations
🟩 FVG 1H & OTE: Recently tapped, offering short-term support.
🟦 FVG 4H: A broader liquidity zone that has now been broken through.
🎯 4. Short-Term Expectations
📉 A pullback to the 1H OTE may occur to grab liquidity before continuation.
📈 If Asian market flows remain strong, gold could continue its momentum towards $3,500 and beyond ahead of the FED speech.
🔥 5. Upcoming Catalysts
🕰 Powell’s speech on Wednesday: High-impact event.
💸 Interest rate decision: If a cut is confirmed, gold may temporarily retrace despite a bullish longer-term outlook.
🌍 Asian session flows: Still favorable to gold, with visible liquidity spikes at session open.
✅ Conclusion
👉 The bullish recovery is now technically confirmed, with a clean structure and strong reactions at key zones.
📍 Levels to watch:
OTE + FVG 1H
The $3,500 mark
Powell’s speech as a primary macro catalyst
🔎 For now, gold remains well-supported during Asian hours, reflecting continued investor interest in uncertain times.

Gold prices surge as risk aversion risesGold has now broken through strongly and stabilized above 3350. Gold fell back in the Asian session and went long. Gold bulls restarted and accumulated energy. Now gold bulls obviously occupy a dominant position. Gold fell back in the Asian session and could only go long. For the current market, don't chase it easily. The market fluctuates too much. Wait patiently for the opportunity to go long after the decline.
The 1-hour moving average of gold has begun to cross upward to form a golden cross. Gold bulls have begun to exert their strength. After gold broke through the 3350 line yesterday, gold fell back to around 3305 and continued to exert its strength. In the short term, 3350 is the key to the turning point of gold bulls and bears. Gold fell back to 3350 in the early trading, which is an opportunity to go long on dips.
The market changes rapidly. Since gold bulls are more powerful at the moment, gold will continue to go long. After the adjustment of gold bulls, the bottom rose. Then the gold bulls may have just begun, and the gold bulls are expected to continue to rise.
Buy range: 3350-3348, SL: 3338, TP: 3370-3380
Sell range: 3395-3397, SL: 3407, TP: 3375-3365
Key points:
First support: 3350, second support: 3340, third support: 3330
First resistance: 3390, second resistance: 3400, third resistance: 3410
For more free sharing, please click on my avatar

Gold Price ActionHello traders! This is almost same setup or pattern as BTCUSD
If you look closely at the left side of the chart, you’ll notice multiple rejections from the same zone — forming a head-and-shoulders-style distribution. This area has now become a strong supply zone.
📌 What to Expect:
This is a high-probability short setup. If price taps into the supply zone again, it could trigger a strong move down, especially with liquidity already swept.

Will gold rise or fall this week?Last Friday's non-agricultural data had little impact on the market, and gold is still fluctuating around the range. At present, the gold moving average crosses downward in a short position, and is now under pressure from the 3270 line. 3270 is the turning point for gold bulls and bears. The rise in gold will not be easily reversed for the time being unless there is a big news impact.

After taking a short position in gold briefly, continue to take From a fundamental perspective, the influence of US data is limited. The market's focus still remains on Trump's tariffs. Subsequently, it is on the geopolitical situations, such as the India-Pakistan conflict, the ceasefire between Palestine and Israel, the Russia-Ukraine negotiations, and so forth.
Analysis of the News Regarding Gold: Gold is rising in a fluctuating manner. Currently, it is trading at around $3,315.44 per ounce, with an increase of approximately 0.92%. This week will witness the interest rate decision of the Federal Reserve, which is expected to dominate the market trend of this week. Additionally, we need to continue paying attention to the relevant news of the international trade situation. After the employment data week, the market's focus has shifted to this week's Federal Reserve's May FOMC meeting.
Judging from the 4-hour chart of gold, after a period of wide-ranging volatile consolidation within the price range of 3,270 to 3,350, the current price has moved to a lower volatile range. Although the two lines of the MACD indicator have issued a golden cross signal, the gold price has broken through the resistance level at 3,300. It is recommended to focus on the resistance effect of this level and pay attention to the effectiveness of the support provided by the MA10 moving average at the lower side.
Trading Strategy:
buy@3259-3270
TP:3303-3330
