time for the gold big fall started!!!finallyin my idea its time to see the gold crash finally after all these higher lows and ATH we have seen in this 3 last months...so we start to sell gold with the last ATH stop loss!AND FREE TP
USCGC trade ideas

Gold (XAUUSD) Analysis – All-Time High & Path Toward 3500
Gold has just reached a new all-time high, and we’re currently seeing a healthy retracement, likely driven by liquidity collection. This move is part of a broader bullish structure, with market sentiment remaining strong.
We’ve identified solid support around the 3269.26 level, which has held well, offering a potential launch point for the next leg up. Our medium-term target is the 3500 resistance area. While price may not reach this level immediately, the current structure suggests a steady climb over the coming days.
Positive macroeconomic news continues to support the bullish outlook, and long-term sentiment is increasingly pointing toward the 4000 level as the next major milestone.
Stay patient, trade smart.

XAU/USD 24 April 2025 Intraday AnalysisH4 Analysis:
-> Swing: Bullish.
-> Internal: Bullish.
Analysis and bias remains the same as yesterday's analysis dated 23 April 2025
Price has now printed a bearish CHoCH according to my analysis yesterday.
Price is now trading within an established internal range.
Intraday Expectation:
Price to trade down to either discount of internal 50% EQ, or H4 demand zone before targeting weak internal high priced at 3,500.200.
Note:
With the Federal Reserve's dovish stance and persisting geopolitical uncertainties, heightened volatility in Gold is expected to continue. Traders should proceed with caution and adjust risk management strategies in this high-volatility environment.
Price could also be driven by President Trump's policies, geopolitical moves and economic decisions which are sparking uncertainty.
H4 Chart:
M15 Analysis:
-> Swing: Bullish.
-> Internal: Bearish.
Price printed as per my note yesterday whereby I mentioned that we should be surprised if price printed a bearish iBOS as all HTF's require a pullback.
Price subsequently printed a bearish iBOS which confirms internal structure.
Intraday Expectation:
Price has traded up to just short of premium of internal 50% EQ where we are seeing a reaction. Price could potentially trade further into premium of 50%, or H4/M15 nested supply zone before targeting weak internal low priced at 3,260.190.
Note:
With the Federal Reserve maintaining a dovish stance and ongoing geopolitical tensions, volatility in Gold prices is expected to remain elevated. Traders should exercise caution, adjust risk management strategies, and stay prepared for potential price whipsaws in this high-volatility environment.
Trump's tariff announcement will most likely cause considerably increased volatility and whipsaws.
M15 Chart:

Is the gold price rally over?Market news:
In early Asian trading on Thursday (April 24), spot gold rebounded sharply and is currently trading around $3,355/ounce, supported by bargain hunting. London gold prices continued to fall from record highs on Wednesday, falling nearly 3% to a low of $3,260/ounce, a stunning plunge. U.S. President Trump's remarks not only appeased investors and encouraged risky assets, but also hit international gold. Due to the possible easing of tensions between China and the United States, and U.S. President Trump's statement that he does not intend to fire Federal Reserve Chairman Powell, risk appetite has improved, the overall financial market atmosphere has improved, and the U.S. dollar has also rebounded from Trump's criticism of Powell for not cutting interest rates for several consecutive days. This has suppressed gold prices. After gold prices were blocked and fell back at the 3,500 mark, more short-term long profit-taking also dragged down international gold prices. This trading day will release the initial monthly rate of durable goods orders in the United States in March and the number of initial jobless claims in the United States as of the week ending April 19. Investors need to pay attention to them. In addition, they need to continue to pay attention to relevant news about the international trade situation and geopolitical situation.
Technical Review:
Gold Since 2025, the bull market of gold has been obvious. In just one quarter, it has reached the 3500 mark, and the increase has jumped by about 30%, which further illustrates the severe global economic situation and the risks brought by regional political turmoil, thus prompting investors to choose to buy gold to avoid inflation! After the gold white plate fell yesterday, the European plate continued to adjust widely, and the long and short battles were obvious. Subsequently, the short-term correction continued to intensify. The United States was afraid of breaking down again to 3260, the largest correction from the recent high! As time goes by, Huang is facing the closing of the monthly and weekly lines today. In the short term, we believe that the correction is likely to end soon, and there will be another pullback at any time. Pay attention to the 3380 inflection point for the pullback, and the inflection point breakthrough will be tested again at any time! At present, from the market, we can clearly see that the long-term gold bull market is not reduced. The short-term correction may be for better stretching later. Therefore, we should pay attention to the correction strength in the short term. From the 4-hour chart, the current long MACD of Huang Jin is gradually decreasing, and it is about to switch to short position. However, the KDJ indicator signal bottom divergence, and the big golden cross is expected. Obviously, the most important thing is to look at the Asian market trend and the closing of the next white market of gold!
Today fenxi:
The gold daily line fell by 240 US dollars in a row. At present, 3500 is temporarily under short-term pressure. Whether the adjustment is over or not is still uncertain. The short-term 4-hour middle track 3380 has been lost and has become a key counter-pressure point. As long as it does not stand on it again, it will maintain a downward correction. After breaking 3292 below, it is the 66-day moving average of 3260 to see the loss! The 1-hour K-line was under pressure from ma10 and ma5, and continued to fall. After last night’s consolidation and pull-up, the K-line is now running above ma10 again, and the macd is under the zero axis. This wave of 200 US dollars’ rapid decline has almost corrected most of it. If it continues to fall, or with the help of bottom divergence, it will slowly brew a short-term bottom! Today is also a critical day for gold. After the bottom of 3260, will the adjustment end and continue to rise, or will it just rebound? Then today’s strength is very important. If gold continues to rise directly today without a major correction, it means that gold may start to fluctuate and rise again.
Operation ideas:
Short-term gold 3315-3318 buy, stop loss 3306, target 3360-3380;
Short-term gold 3387-3390 sell, stop loss 3400, target 3320-3330;
Key points:
First support level: 3326, second support level: 3300, third support level: 3288
First resistance level: 3350, second resistance level: 3376, third resistance level: 3400

Daily Analysis- XAUUSD (Thursday, 24th April 2024)Bias: Bearish
USD News(Red Folder):
-Unemployment Claims
Analysis:
-No bottom wick on daily open
-Looking for retest of 0.5 or 0.618 fib level
-Potential SELL if there's confirmation on lower timeframe
-Pivot point: 3420
Disclaimer:
This analysis is from a personal point of view, always conduct on your own research before making any trading decisions as the analysis do not guarantee complete accuracy.

Thu 24th Apr 2025 XAU/USD Daily Forex Chart Sell SetupGood morning fellow traders. On my Daily Forex charts using the High Probability & Divergence trading methods from my books, I have identified a new trade setup this morning. As usual, you can read my notes on the chart for my thoughts on this setup. The trade being a XAU/USD Sell. Enjoy the day all. Cheers. Jim

XAUUSDWeekly on an uptrend
Daily still on also on an uptrend with no reason to change for the moment.
H4/H1 is trying to build a new direction

XAU / USD 4 Hour ChartHello traders. Looking at the 4 hour chart I have marked the area of interest. Let's see what tomorrow brings after tonight's overnight sessions. Big G gets a shout out. Be well and trade the trend.

CHECK XAUUSD ANALYSIS SIGNAL UPDATE > GO AND READ THE CAPTAINBaddy dears friends 👋🏼
(XAUUSD) trading signals technical analysis satup👇🏼
I think now (XAUUSD) ready for(BUY)trade( XAUUSD ) BUY zone
( TRADE SATUP)
ENTRY POINT (3318) to (3320) 📊
FIRST TP (3325)📊
2ND TARGET (3330) 📊
LAST TARGET (3335) 📊
STOP LOOS (3310)❌
Tachincal analysis satup
Fallow risk management

GOLD doing pullback after reaching top channelAdditionally of Trump news, the technical analysis create a great opportunity to have a pullback in gold, by joining the top of the channel plus RSI and Stochastic in overbought areas in Weekly, Monthly and Daily bases.
The 3 Step Rocket Booster Strategy + Gold Price CorrectionThe rocket booster strategy is very
easy to understand.
In this video i show it to you.
Also we re using the strategy
to study the trends of
crypto market and stock market.
The video is very interesting.
Watch to see how we
compare the dollar to gold
in price performance
you will want to see this.
Also watch the video to learn more
about the Rocket Booster Strategy,
Rocket boost this content to learn more.
Disclaimer:Trading is risky please learn risk
management and profit taking strategies.
Also feel free to use a simulation trading account.

Gold hits all-time highTechnical Analysis
Gold prices hit an all-time high near $3,500 earlier Tuesday, consolidating a strong uptrend. This latest surge, which has surpassed 10% in just over a month, follows rapid gains from $3,126 to $3,498. Currently, the bulls are maintaining their dominance.
Looking at historical price action, every significant rise in gold has been followed by a period of profit-taking. Therefore, a short-term correction is expected. Furthermore, a break above $3,417 could trigger a deeper correction, which warrants caution.
Trading Recommendations
Trading Trend: Sell
Entry Price: 3,438
Target Price: 3,235
Stop Loss: 3,534

Gold targets $3,475: Strong wave has not stoppedThe world gold price's uptrend continues to hold steady after a technical correction to the support zone around $3,336 - $3,369 (Fibonacci 0.5 - 0.618), coinciding with EMA34 on the H4 frame, showing that buying power is still dominant in the main trend. The price has now recovered to around $3,395/ounce and continues to maintain a strong uptrend pattern with the target of expanding to the $3,475 zone - the 100% Fibonacci level of the most recent uptrend. The convergence between the technical structure and macro news creates a solid foundation for the uptrend: safe-haven money continues to flow into gold amid geopolitical instability, a weakening USD and market sentiment worried about risks from US economic policy.
Comments from experts such as Sean Lusk and Christopher Vecchio also reinforce the bullish outlook, especially as speculative money and central bank buying have yet to show signs of cooling off. With the EMA34 and EMA89 maintaining a positive slope, the possibility of the price continuing to climb to the target area of $3,475 is very high, before a short-term correction to test the breakout zone may appear. In the short term, any correction to the $3,370–$3,390 area is seen as an opportunity to increase long positions following the trend.

Daily live trade with XAUUSD in 15m/30m/1h 20250422Daily live trade with XAUUSD in 15m/30m/1h 20250422

GOLD entering Bear MarketIf you look at RSI and Stochastic RSI across higher time frames—weekly, bi-weekly, and monthly—they're sitting at extreme overbought levels. Historically, similar conditions in 2008, 2011, and 2020 were followed by major corrections or long periods of sideways movement in gold.
Right now, all I see in the media is hype around buying gold, which often signals distribution—whales unloading positions onto retail. While overbought conditions don’t tell us exactly when a correction starts, they do suggest we’re not in a solid buying zone. In fact, we might be approaching a significant top.

What if Kid Rock ran the Fed?Gold has broken above $3,400 for the first time, setting a new all-time high as investor confidence in the United States continues to decline.
Citi forecasts gold could reach $3,500 within the next three months. However, this projection might be underestimating Trump’s potential to further undermine confidence in the US.
On Monday, President Trump intensified pressure on Federal Reserve Chair Jerome Powell, calling him a “major loser” and demanding immediate interest rate cuts. Last week the President said, "Powell's termination cannot come fast enough,".
A move to dismiss Powell would likely trigger significant market volatility. Markets generally view Powell as a stabilizing figure, and history shows that a less independent central bank is less effective at keeping inflation under control.
I think it might be fair to wonder what a Federal Reserve Chairman Kid Rock would do for the price of gold.

Critical point at 1.68 Fib level Market Is on bullish streak without testing the previous BOS and liquidity volume gap it's hit the weekly target of 3400 Mark.
Now market is forming bearish diversion with rising wedge channel although we have Fib retracement level of 1.68 level at 3404-05.
If market gives closing above 3405 then 3430 on mark for TODAY.
On the other hand, without retesting the previous high is question for bulls.
If we got rejection at 3405 , market can drop to 3380 then 3365.
Overall im on bulls side
I wait for the Dips to buy again.

Buy OpportunityGOLD/USD Buy Setup – Breakout & Retest Confirmed
Entry: 3384
TP: 3563
SL: 3307
RR: 2.3
Analysis:
Gold has broken out of the recent consolidation range and is respecting the ascending trendline. Volume is increasing on the breakout, confirming bullish strength. Minor pullback held perfectly at the trendline and previous resistance-turned-support. Clean move expected toward 3560+ if momentum continues.
Bias: Bullish
Timeframe: 1H
Outlook: 1–2 days

April 21, 2025 - XAUUSD GOLD Analysis and Potential OpportunitySummary:
Bullish momentum remains strong. Based on previous price action — especially when new highs were made during the Asian session — today’s strategy is to buy on pullbacks to support.
Key Levels to Watch:
3380–3385: Bullish target zone
3376: Support
3371: Support
3365: Support
3358: Support
3353: Support
👉 If my insights have been helpful to you, or if you traded based on my ideas, please consider giving a like — it’s a great encouragement for me! Thanks for your support!
Disclaimer: This is my personal opinion and not financial advice. Please manage your risk accordingly.

XAU/USD Longs from 3,220 or 3,120 back to ATHMy Analysis this week for gold is for it to keep pushing higher, even though gold has been overbought and we could at any time expect a major correction or distribution. We will be going on. current market structure and currently we have seen another ATH breach as well as multiple break of structures to the upside.
From these demand zones that have been created we will be looking for a small correction a retracement in which price will then re accumulate in one of our POI, to cause another rally to the upside.
Confluences for GOLD Buys are as follows:
- Demand zone on the 4hr and 6hr is near by for potential long setups to formulate.
- Market structure has been very bullish on the lower and higher time frame
- There is asian high above that needs to get taken out as well
- Dollar index has been bearish which means bullish movement for GOLD
P.S. If price breaks through both demand zones i do have an extreme one at 3,020 but if it reaches that low we could expect price to just start moving temporarily bearish.

XAUUSD to print LOWERGuaging that price will print lower and sweep more liquidity before making a bullish run again upon uncertainty

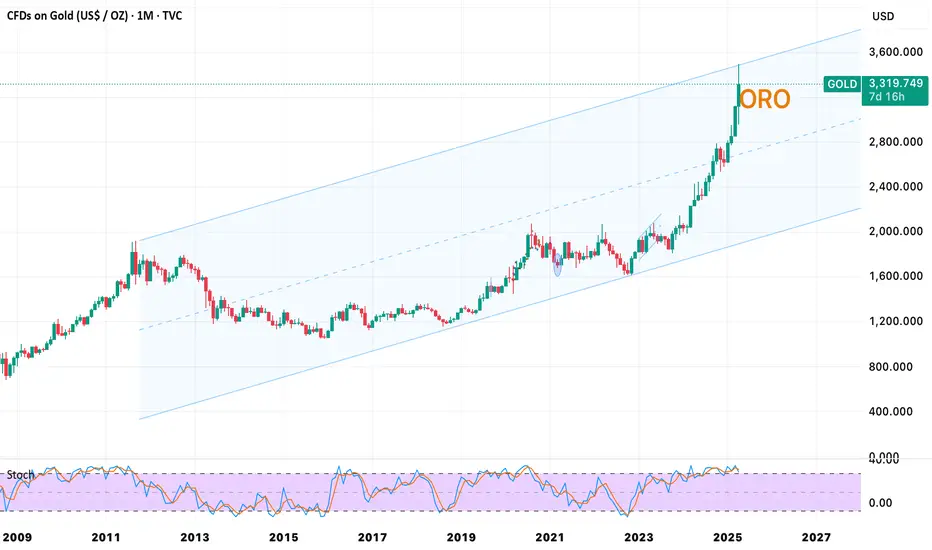
Gold at a Turning Point? The Case for a Correction!Gold has been on an unrelenting vertical rally, but the cracks are starting to show! On the quarterly chart, the price has just kissed the 161% Fibonacci extension of a key channel, a level that often signals exhaustion. Meanwhile, volume has been quietly fading since early 2023, despite this marathon of a bull run with no meaningful correction yet. Is the market running out of steam? The charts are whispering a pullback—don’t miss the signs!

Key Buying Levels For Monday Use Proper Money Management !
This trade is based on advanced Concept
Follow for more !
Take only 1% Risk on this Trade
