strong bullishIt seems like gold hasn't made WCL yet, there's still a big possibility for a new ATH again.
admin's view for tonight
USCGC trade ideas

The first negative line after three consecutive positive linesThe current gold market is facing dual drivers of policy and fundamentals. Trump's tariff policy trend has become a key variable. Coupled with expectations of a slowdown in the US economy in 2025 and rising global geopolitical risks, safe-haven demand continues to support gold prices.
Gold technicals show the first small negative line after three consecutive positive lines, and the correction signal is to be confirmed. The intraday shock adjustment is obvious, and the magnetic effect of the 3235-3200 range is significant. It is recommended to maintain the range thinking at the operational level. The upper resistance is currently at 3232-3235, and the lower support is at 3200-3195. Wait for the key guidance on Wednesday to clarify the direction. The market is in a sensitive period of market change, and it is necessary to focus on the pulsed impact of policy dynamics and geopolitical risk evolution on gold prices.
Operation strategy 1: It is recommended to rebound to 3233-3237 short, stop loss 3245, and the target is 3210-3200.
Operation strategy 2: It is recommended to pull back to 3190-3185 long, stop loss 3178, and the target is 3210-3230.

Gold Trading Signals!!Looking back to last Thursday, our gold short strategy hit the mark perfectly. Prices dropped nearly $60 as expected, and we captured around $45 in profit from that move. Overall, we secured over $200 in profit space last week—an excellent performance.
Today, gold opened higher and continues to climb. Technically, bulls still have room to push higher, with 3360 as a key resistance level. However, judging by the current momentum, we may even see a test of 3400. That said, trading is about precision, not perfection. If prices approach 3380 and the upward momentum stalls, it may be time to watch for a pullback. On the other hand, if strength continues, holding some light long positions remains a relatively low-risk strategy.
Trading Strategy for Today:
📉 Sell in the 3380–3410 range
📈 Buy in the 3307–3280 range
🔁 Flexible trades between 3360–3330 / 3272–3315

Gold Potential Bullish Breakout (Potential HH formation)With with continued global tariff panic between USA and China, Gold price still seems to exhibit signs of overall Bullish momentum as the price action may form a prominent Higher High on the shorter timeframes with multiple confluences through key Fibonacci and Support levels which presents us with a potential long opportunity.
Trade Plan:
Entry : 3363
Stop Loss : 3278
TP 0.9 - 1 : 3439.5 - 3448

Gold continues to rise on risk aversionThe bullish trend structure of gold remains unchanged. Don't guess where the top is. From 2600 points at the beginning of the year to 3382 points now, the increase is more than 780 US dollars.
Stimulated by the news, the price of gold has continuously refreshed historical highs this year. In the short-term trend, the correction last Thursday stopped at 3283! The central banks of many countries continue to increase their gold reserves, providing medium- and long-term support for gold prices, indirectly increasing the attractiveness of gold, and causing gold to rise straight at the opening of the Asian session!
In addition, the US government's strengthening of financial supervision has caused the market to worry about the independence of the Federal Reserve. The uncertainty of trade negotiations, the tense situation in the Middle East, the ongoing conflict between Russia and Ukraine, etc., continue to drive funds to flow to gold. From many perspectives recently, gold is still bullish in the long term. For our intraday layout, we still wait for the opportunity to fall back and go long. Pay attention to the top and bottom conversion position of 3357 in the Asian session, and buy in with a small adjustment back!
Gold has been rising wildly recently under the stimulus of risk aversion. In this emotional market, you can only trade with the trend, because gold keeps hitting new highs and no one knows where it will rise. However, don't enter the high position easily. After the volatility increases, the amplitude of each callback is also large. Wait patiently for the opportunity to enter.
Key points:
First support: 3367, second support: 3348, third support: 3333
First resistance: 3386, second resistance: 3400, third resistance: 3415
Operation ideas:
Buy: 3357-3360, SL: 3348, TP: 3380-3390;
Sell: 3403-3405, SL: 3414, TP: 3380-3370;
GOLD Price Analysis: Key Insights for Next Week Trading DecisionLast week, Gold briefly hit an all‑time high of $3,357 before profit‑taking drove it back to around $3,320 zone📉
Ongoing uncertainty around US‑China trade relations and a weaker dollar drove traders into safe‑haven assets, supporting bullion bids despite the pullback.
Meanwhile, Fed Chair Jerome Powell’s hawkish speech on Wednesday capped the rally for now, though tariff risks and geopolitical tensions may continue to underpin Gold prices into the new week.
In this video, we:
🗺️ Break down the key chart levels
🔍 Highlight bullish vs. bearish setups
🚀🔻 Preview catalysts that could spark the next move
Disclaimer:
This is my personal take based on experience and what I see on the charts. It’s not financial advice—always do your own research and consult a licensed advisor before trading.
#GoldMarketAnalysis #Inflation #TradeTensions #GeopoliticalRisks #TechnicalAnalysis #GoldTrading

Today's gold analysis strategyThe gold market has experienced significant price fluctuations and corrections. From a technical perspective, the overbought correction has already arrived. The price of gold has deviated significantly from its short-term moving average, strongly suggesting that a correction is needed to complete the technical adjustment. The current correction is not a simple unilateral decline.
From a fundamental perspective, the underlying support for gold remains rock solid. Geopolitical risks, especially the continued escalation of the tariff standoff, have maintained strong demand for safe-haven assets. Therefore, this price adjustment should be regarded as a typical correction following the previous sharp rise.
Buying price: 3290 - 3295
Target price: 3320 - 3330

The gold price target on Monday continued to be 3400.The gold price target on Monday continued to be 3400.
As Friday was a Jesus holiday, the international gold market was closed yesterday.
In the early hours of Thursday, Fed Chairman Powell released a signal of "maintaining interest rates unchanged" at the monetary policy meeting, triggering short-term fluctuations in the gold market.
After hitting a new high of $3357/ounce, the gold price fell back and once reached a low of $3284, but was affected by the weakening of the US dollar and the escalation of trade tensions, and finally closed at $3327.
Factors such as global economic uncertainty and geopolitical risks continue to support the safe-haven demand for gold. The Fed's position of suspending interest rate hikes further strengthens the logic of gold's rise.
Gold 4-hour level: bullish power remains strong.
In the short term, the gold price may fluctuate and consolidate in the range of 3290-3350.
$3350 will become a short-term bull resistance level, while the $3300 mark is the watershed between long and short games.
If the gold price can hold steady at $3,300, it is expected to test $3,357 again, or even hit $3,400. On the contrary, if the gold price falls below $3,300, it may fall to the support level near $3,250.
Operation suggestions are as follows:
Only consider long strategies above $3,300
Stop loss: 3,290
Target: 3,350-3,400
Reject short selling in the short term

Analysis and layout of the latest gold market ?Analysis of gold market trend next Monday:
Gold technical analysis: Stimulated by the news, gold prices have continuously refreshed historical highs this year. As of the close of this week, gold prices have reached a high of 3357. There was a slight retracement signal after setting a historical high on Thursday, but the closing price was still above 3320. The weekly line closed with a real body longer than the upper and lower shadows, suggesting that there is a possibility of further upward movement next week. That is to say, while we are optimistic that overbought will trigger selling at the end of the week, there are also investors who continue to be optimistic about the pullback and buy into the market. So Thursday's trend is to dive from the high to 3284 and then rebound to 3327 to close. The closing price reflects that the gold price is still in a state of continued rise in the general trend.
In the short-term trend, Thursday's callback stopped at 3284, and did not reach the previous high conversion support of 3245, which we predicted. Then the support level can be moved up to 3285; as for the upper resistance, we need to pay attention to the suppression of the historical high of 3357. If the news over the weekend, especially the trade conflict and Trump's remarks, continue to stimulate the Fed to cut interest rates, then the probability of gold rising will be greatly increased. So for next week's operation, it is recommended to focus on long positions on pullbacks. As for the entry point, the first one is 3310. This is a step support level for high-level pullbacks and a retracement point during the rebound, so it can be used as an entry point to look bullish. The upper side mainly focuses on the high point suppression of 3357. If it continues to break, the upper side can continue to see the position of 3409. On the whole, it is recommended to focus on pullbacks and short positions on rebounds for the short-term operation of gold next Monday. The upper short-term focus is on the resistance line of 3357-3360, and the lower short-term focus is on the support line of 3285-3310. Friends must keep up with the rhythm.
Reference for gold operation strategy next Monday:
Strategy 1: Short gold rebounds near 3350-3360, target near 3335-3320, and look at the 3310 line after breaking.
Strategy 2: Go long on gold when it pulls back to around 3305-3310, target around 3325-3345, and look at the 3360 line if it breaks.

13,900 pip on gold XAUUSDHi guys today analysis is about GOLD XAUUSD
based on some factors and based on chart analysis the chart will bi like this
open sell on 3340$ - 3440$
stop lose 3540$
tg1 3051$
tg2 2422$
tg3 2300$
tg4 2200$
tg5 2050$
note: this is not financial advice it is only my opinion please do your research and analysis

Gold weekly update with both buy and sell levels🔍 Short-Term Forecast for XAU/USD
Current Market Context:
Price: $3,227.375 (currently)
Recent High: Around $3,328
Structure: Strong bullish rally with minor retracement. Currently consolidating under a key resistance zone.
Fib Levels: Price has respected Fibonacci retracement and extension levels, particularly 0.618 and 0.786.
Volume Delta: High macro delta volume at 19.67%, indicating aggressive buying.
Forecast:
Bullish Bias short-term with room for a minor pullback to retest lower support zones around $3,200–$3,180 before continuation higher.
If $3,328 is broken convincingly, we could see a rally toward $3,345, $3,360, and beyond.
📈 Potential Trading Signals
Buy Signals:
Break and Retest of $3,328 Resistance – Watch for a clean break above $3,328 and retest as support to initiate a long position.
Pullback to $3,200–$3,180 Zone – This is a high confluence area of previous support + Fib level (near 0.382–0.5). Bullish reversal candlestick patterns here could be a buy trigger.
EMA Bounce – The 21 and 50 EMA are acting as dynamic support. A bounce from these EMAs could be a signal for continuation upward.
Sell Signals:
Failure to Break $3,328 With Strong Bearish Rejection – Look for long wicks and engulfing candles near resistance.
Break Below $3,180 – Could trigger a sharper correction to $3,150 and possibly $3,100.
📊 Upcoming Economic Data & Impact on XAU/USD
Key Events to Watch:
U.S. Fed Commentary & Rate Decision Expectations
U.S. CPI / PPI / Core Inflation Reports
Non-Farm Payroll (NFP)
Geopolitical Risks (Middle East, Ukraine, etc.)
Influence:
Hawkish Fed Data (higher inflation, strong jobs) → Stronger USD → Bearish for XAU/USD.
Dovish Signals (cooling inflation, rate cut hints) → Weaker USD → Bullish for XAU/USD.
Geo-Risk Escalation → Gold rallies as a safe haven.
📋 Day Trading Plan for XAU/USD
Trading Style: Scalping to Intraday Swing
Timeframe Focus: 15min, 1hr, 4hr
Indicators Used:
21 EMA, 50 EMA
Fibonacci Retracement/Extension
Price Action (Engulfing, Doji, Pin Bars)
Volume & Delta Volumes
Key S/R Zones
🔹 Bullish Setup (Buy the Dip Strategy):
Entry: $3,200–$3,180
Confirmation: Bullish engulfing or pin bar + bounce from EMA
TP1: $3,245
TP2: $3,280
SL: $3,172 (below structure)
🔹 Breakout Strategy (Momentum Trade):
Entry: Break of $3,328 and close above
Confirmation: 15m or 1h candle close above with increased volume
TP1: $3,345
TP2: $3,360
SL: $3,312
🔻 Bearish Setup (Fade the Resistance):
Entry: Rejection of $3,328 zone
Confirmation: Long upper wick or bearish engulfing candle
TP1: $3,280
TP2: $3,250
SL: $3,335
📌 Risk Management Tips
Risk max 1–2% per trade.
Adjust position size according to volatility (ATR).
Use alerts around key levels: $3,200, $3,328, $3,345.
Avoid trading major news releases without clarity.
🗺️ XAU/USD Day Trading Roadmap (Short-Term)
✅ Scenario 1: Bullish Continuation (Breakout Play)
📍 Key Level to Watch:
→ Resistance at $3,328
🟢 If price breaks and closes above $3,328:
Enter LONG on retest of $3,328 as support.
TP1: $3,345
TP2: $3,360
TP3: $3,382
SL: Below $3,312
📊 Confirmation Needed:
Bullish 15m/1h close above resistance
Increasing volume
🔄 Scenario 2: Range Play / Rejection from Resistance
📍 Key Range:
Top: $3,328
Bottom: $3,200–$3,180
🔴 If price rejects $3,328:
Consider SHORT entries from resistance
TP1: $3,280
TP2: $3,250
SL: Above $3,335
📊 Confirmation Needed:
Bearish engulfing or pin bar near $3,328
Divergence or decreasing volume
🟢 Scenario 3: Buy-the-Dip (Support Bounce)
📍 Buy Zone:
→ $3,200–$3,180 support zone (confluence of Fib & EMA)
🟢 If price pulls back and holds above $3,180:
Go LONG on bullish candle
TP1: $3,245
TP2: $3,280
SL: Below $3,172
📊 Confirmation Needed:
Pin bar, hammer, or bullish engulfing
Volume bounce or EMA support hold
🔻 Scenario 4: Bearish Breakdown
📍 Critical Support:
→ $3,180
🔴 If price breaks & closes below $3,180:
Go SHORT on retest of $3,180 as resistance
TP1: $3,150
TP2: $3,100
SL: Above $3,190
📊 Confirmation Needed:
Clean break + bearish volume spike
EMAs cross bearish
🧠 Bonus Tips:
🕓 Best sessions: London and New York overlap
📅 Check calendar: U.S. CPI, PPI, and NFP are gold movers
🧯 Avoid overtrading. Let price come to your key zones.
🎯 Use alerts at $3,180, $3,200, $3,328

XAUUSD profit analysisGold has been breaking new highs recently. Don't chase the short position blindly. Gold is still strong. Although there is a need for a correction on the technical level, gold has not fallen sharply. It is still mainly long, but don't be blindly long at high levels. It is recommended to wait for a short-term correction before continuing to go long. In the short term, you can pay attention to the 3320-3325 range. You can enter long orders in this area, but you must pay attention to risk management when trading. If there is a loss, you must stop loss in time. Stop loss is also one of the trading techniques. Many people who shorted gold have been trapped or even cleared because they did not set a stop loss account. Don't insist meaninglessly!
I share my market analysis and trading strategies every day. If you are confused about trading, you can take a look. I think it will be helpful to you.

GOLD (XAUUSD): Updated Support & Resistance Analysis
With a strong bullish rally that we saw on Gold since the beginning
of the week, I prepared for you the updated support & resistance analysis.
Resistance 1: 3340 - 3357 area
Resistance 2: 3390 - 3406 area
Resistance 3: 3440 - 3450 area
Support 1: 3235 - 3246 area
Support 2: 3135 - 3167 area
Support 3: 2957 - 2983 area
Consider these structures for pullback/breakout trading.
❤️Please, support my work with like, thank you!❤️
I am part of Trade Nation's Influencer program and receive a monthly fee for using their TradingView charts in my analysis.

Gold Dips From PRZ – Will Supports Hold for New ATH?Gold ( OANDA:XAUUSD ) started to correct again from the Potential Reversal Zone(PRZ) and near the Resistance lines . The question is, can Gold create a new All-Time High(ATH) again?
In terms of Elliott waves , Gold appears to be completing a main wave 4 . This main wave 4 is likely to complete near the Support lines and Support zone($3,168-$3,133) .
I expect Gold to either rise again after breaking the Resistance zone($3,220-$3,211) or near the Support zone($3,168-$3,133) and Support lines .
Do you think Gold can create a new All-Time High(ATH) again?
Note: If Gold breaks the Support zone($3,168-$3,133), we should expect a further correction from Gold.
Gold Analyze ( XAUUSD ), 1-hour time frame.
Be sure to follow the updated ideas.
Do not forget to put a Stop loss for your positions (For every position you want to open).
Please follow your strategy; this is just my idea, and I will gladly see your ideas in this post.
Please do not forget the ✅' like '✅ button 🙏😊 & Share it with your friends; thanks, and Trade safe.

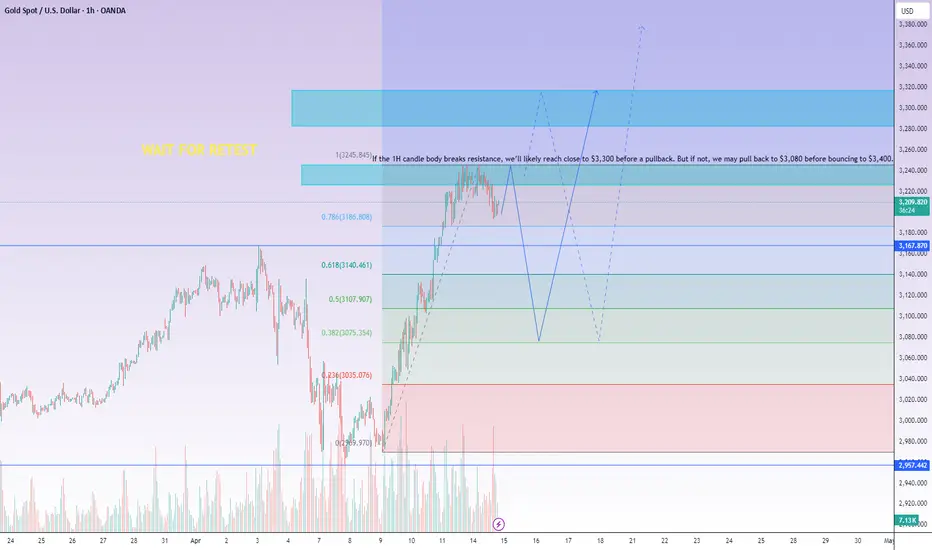
GOLD (XAU/USD) at ATH – Two Key Scenarios to WatchGold has reached ATH, and we're currently testing a critical resistance zone. Look at my previous published post, perfectly played out and we're just getting started.
📈 Scenario 1: If the 1H candle body breaks above resistance with a confirmed close, we’re likely to see a push toward the $3,300 level before a potential pullback toward $3100
📉 Scenario 2: If we fail to break resistance, a pullback toward the $3,100 zone is expected before a bounce back to $3,350.
Wait for a retest confirmation on the 1H candle body closure before taking any position.
Updates will be published!
ANALYSE GOLD SHORT POSSITIONscalping possition now on gold short posiition
like and follow our profile for more analyse crypto forex stocks future for free

Daily Analysis- XAUUSD (Monday, 21st April 2024)Bias: Bullish
USD News(Red Folder):
-None
Analysis:
-Strong bullish momentum on market open
-Looking for pullback for BUY
-Potential BUY if there's confirmation on lower timeframe
-Pivot point: 3300
Disclaimer:
This analysis is from a personal point of view, always conduct on your own research before making any trading decisions as the analysis do not guarantee complete accuracy.

GOLD: What happened?Hello friends
The trend is very bullish and given the recent events in the world, the possibility of a decline is decreasing, so we can buy in pullbacks that the price is making in steps and with capital management and risk, price targets have also been specified.
*Trade safely with us*

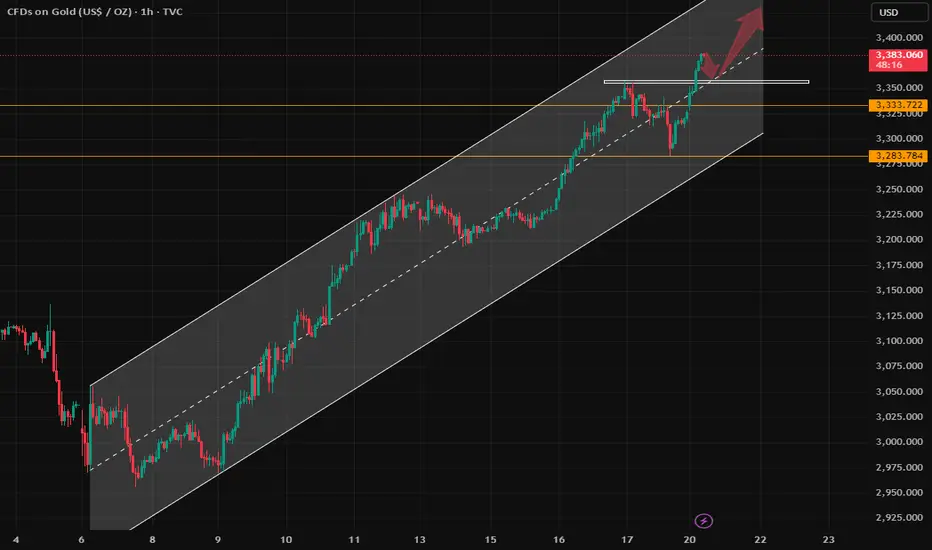
Gold Prediction!Current Price: ~$3,326
Trend: Strong bullish breakout of ascending channel
Moving Averages: Price is far above the 50 EMA (white)
Still bullishly distanced from the 200 EMA (orange)
Structure: Clean breakout of rising channel and key horizontal resistance zones
-Strong daily candle closed above trendline resistance → this is a confirmed breakout
-No upper wick rejections or bearish engulfing candles
-Buyers remain in control until signs of exhaustion show
Plan: Only look for a Buy position setup for safer trade.

GOLD'S CRITICAL DECISION ZONE: The $100+ Swing Play of the Week!The Golden Opportunity That Elite Traders Are Watching NOW 💰
The 4-hour Gold chart reveals a masterfully developing technical setup that demands immediate attention. This isn't just another gold analysis—it's the precise roadmap for what could be the most significant price swing of April 2025.
🔍 TECHNICAL PRECISION POINTS:
⚜️ Expanding Channel Perfection
- Gold trapped within pristine ascending channel (purple boundaries)
- Current price ($3,320.925) testing first support zone
- Channel width expanding—signaling increased volatility ahead
⚜️ Two Critical Consolidation Zones
* Historical accumulation zone ($3,220-$3,245) provided springboard for recent rally
* Current decision zone ($3,300-$3,330) serving as near-term battleground
* Both zones perfectly align with channel support tests
⚜️ Predictive Blue Path Analysis
* Forecasting tactical pullback to $3,225 (channel support confluence)
* Subsequent powerful reversal targeting $3,320+ retest of highs
* Final move potentially challenging the $3,357.775 all-time high
The STRATEGIC ADVANTAGE Most Traders Will Miss
This pattern isn't just about direction—it's about precision timing. The blue forecast line reveals a classic "shake-and-bake" pattern that institutional traders use to accumulate before significant moves.
🔱 Why This Week Is Different:
* April 21-27 window represents peak volatility zone
* Volume profile showing 40.31K contracts with diverging price action
* Bullish bias maintained despite -0.47% daily change (distribution, not weakness)
🔱 The $100+ Opportunity:
Traders positioned at channel support could capture the entire $100+ swing from lower support (~$3,225) to upper resistance (~$3,330), representing a potential 3% move—extraordinary for gold's typical volatility profile.
The EXECUTION BLUEPRINT For Maximum Gain 📊
1. Primary Entry Zone:$3,225-$3,235 (channel support confluence)
2. Conservative Stop: Below $3,210 (channel break invalidation)
3. First Target:$3,275 (mid-channel equilibrium)
4. Final Target: $3,320-$3,330 (upper resistance retest)
{ Risk:Reward = 1:3.5 at minimum } 🚀
The Hidden Geopolitical Catalyst
The technical setup coincides perfectly with next week's critical economic data releases and geopolitical tensions—creating the perfect storm for gold's next explosive move. FOLLOW ME 🔥

Gold Intraday Trading Plan 4/17/2025Gold is in strong bullish trend and can rise more than 1k pips within one day. This is crazy and poses great opportunity as well. I will look for buying opportunity from 3320 level and target 3415 today.

GOLD ( XAU/USD) likely to move up from here Take this with a grain of salt. I am no expert, and this is not financial advice.
Technical Analysis (TA):
As we look at the hourly (1hr) timeframe, we can see a strong upward movement followed by a temporary consolidation creating a bullish pennant pattern suggesting a trend continuation. A conservative target puts us at around $3,350 per troy ounce of gold, but we could go as high as $3,494.63 to be exact.
Fundamentals Analysis (FA):
Macroeconomic Uncertainty: I can go into great detail about what is happening, but I would be writing an essay the size of 10 pages, and I don't want to do that now, so here is a quick and simple overview:
Tarrif War between the United States of America and China (as well as other countries) could lead to economic slow downs as well as poor revenue's for companies.
Start-ups are dead. As of today, there has been an alarming rate of start-ups which has been failing and unable to secure funding, and yes I am aware start ups fail all the time and funding dries up, just at the current rate it is scary how many are actively failing where a year back they were alive and well with bright futures and investment potential, investors are running to safe havens such as GOLD to keep their funds safe.
Central banks are expected to pause or even cut rates, which is typically bullish for gold, as lower rates reduce the opportunity cost of holding non-yielding assets.
Geopolitical Tensions: War War War :(

XAU/ USD) bullish trend analysis Read The ChaptianSMC Trading point update
analysis for XAUUSD (Gold vs. USD) on the 2-hour timeframe appears to suggest a bullish continuation setup after a correction. Here's a breakdown of the idea:
Key Points from the Chart:
1. Rising Channel:
The price is moving within an ascending channel.
After a breakout and strong rally, it is currently in a flag or wedge-like correction pattern.
2. Correction Zone:
The price is consolidating downward inside a small descending wedge (a bullish pattern), potentially forming a bull flag.
This is typically a sign of continuation after a strong upward impulse.
3. Support Zone:
A 4H support level is marked around 3,301.416, which aligns with the lower boundary of the flag pattern.
This is a potential buy zone for price to react and bounce.
4. Target Point:
The target is projected at 3,404.254, implying a breakout to the upside if the support holds.
5. RSI Indicator:
RSI is currently around 65, with previous values near 80, suggesting a slight cooldown but still in bullish territory.
A slight drop in RSI might occur before the next bounce.
6. EMA 200:
The EMA 200 is well below current price (around 3,137), indicating a strong bullish trend.
Mr SMC Trading point
Possible Trade Idea:
Entry: Around the 3,301–3,305 support area.
Confirmation: Wait for a bullish reversal pattern (engulfing candle or strong bounce).
Target: Around 3,404 (as per the marked target zone).
Stop Loss: Below the support zone (e.g., below 3,295), depending on risk tolerance.
Pales support boost 🚀 analysis follow)
