Updated Structure & Trend (April 17 – Pre-Weekend Trading)🧠 Updated Structure & Trend (April 17 – Pre-Weekend Trading)
✅ HTF (D1, H4): Price has made a new all-time high at 3357, extending the bullish run — but we're now deep in premium exhaustion territory.
🟠 M30–H1: First signs of distribution and internal CHoCH on M15 are showing. No follow-through above ATH. Price is stalling, likely waiting for NY volume.
⚠️ Volatility is low, and Friday is a market holiday, so any manipulation or rejection will likely happen today.
🔼 New ATH: 3357
This makes previous zones like 3333–3340 less relevant for traps.
Focus shifts to the true inducement zone:
🔻 3355–3365 → Main sniper short zone, valid only with clear M5 structure (BOS or reversal FVG).
🔻 Key Sell Zones (Updated):
3355–3365 → Final inducement / exhaustion zone near new ATH
3342–3345 → OB retest below weak high, valid only if confirmed with bearish PA on M5
🟢 Key Buy Zones (Same):
3284–3288 → OB + FVG + discount zone
3260–3265 → H1 equilibrium and last clean demand
3230–3235 → Deeper reentry zone if we get a flash crash before NY
📊 Trading Logic:
If NY session spikes again into 3355–3365, we're ready to snipe with precision.
If price fails to reclaim 3345 and breaks M5 structure, we target early shorts.
On a clean dump, we look for longs in the 3280–3260 range, with confirmation.
USCGC trade ideas

Gold bull cycle continues, 3390
Hello brothers, let's comment on the gold price next week from April 21, 2025 to April 25, 2025
💥 World Situation:
Gold prices are expected to end the year on a strong note, rising more than 2.79%, with the precious metal surging nearly $90 amid continued weakness in the U.S. dollar (USD) due to ongoing global trade uncertainties. At the time of writing, XAU/USD is trading around $3,326.
Despite hitting an all-time high of $3,358, the rally cooled slightly as both European and U.S. markets were closed as traders locked in profits ahead of the extended Easter weekend. Meanwhile, real yields edged higher, offering mild resistance. On the policy front, San Francisco Fed President Mary Daly noted that the U.S. economy remains resilient, even though some areas are showing signs of slowing. She stressed that monetary policy remains tight enough to keep inflation in check, while also hinting that the neutral rate could rise.
✡Summary:
Gold prices are still in a big uptrend, and short-term corrections will only allow gold prices to accumulate further and continue to hit new highs. Tariff tensions continue to cause gold prices to rise strongly: 3382, 3400
🔥 Technical:
According to the resistance and support levels of gold prices on the 4-hour chart, important key areas can be identified as follows:
Resistance: $3357, $3382, $3390
Support: $3284, $3260, $3155
⭐️ Note: Labaron hopes that traders can properly manage their funds
- Choose a lot size that matches your funds
- Profit is 4-7% of the fund account
- Stop loss is 1-3% of the fund account

"Imminent Correction in Gold – Strategic Plan to Capture Wave 4"📌 General Context
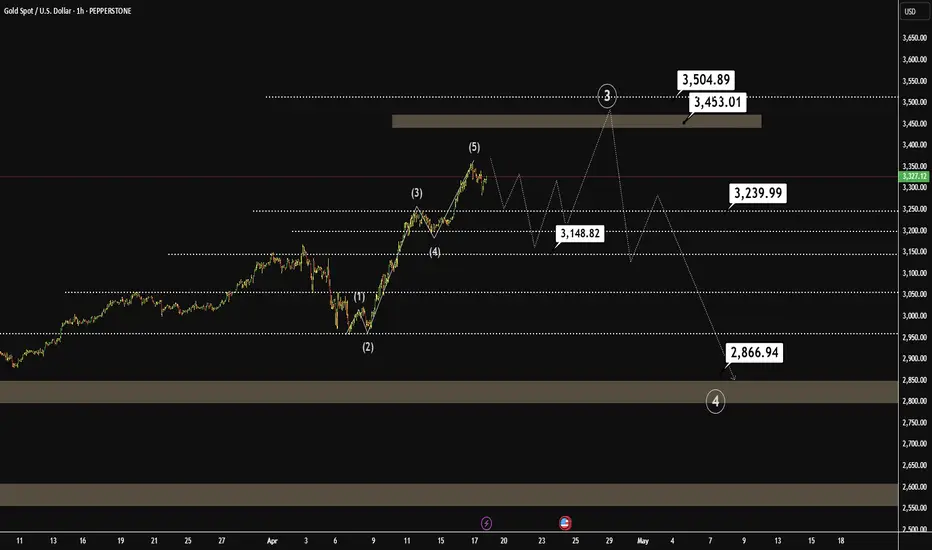
Gold (XAU/USD) is currently at a pivotal moment after completing a 5-wave impulsive sequence, suggesting that we may be about to enter a major corrective phase. The structure observed is an impulsive wave (1)-(2)-(3)-(4)-(5), which is typically followed by an ABC correction or a complex correction, depending on the larger context.
📈 Wave Structure and Technical Projection
Wave (5) Completed:
The end of wave (5) has clearly been marked, suggesting short-term buyer exhaustion.
This paves the way for a corrective movement that, based on wave projections, could seek much lower levels.
Critical Supply Zone:
Between $3,453.01 and $3,504.89, there is an important supply zone.
This area could act as resistance in a potential final bullish impulse to form an expanded "Flat" or "Running Flat" corrective structure.
Downside Projection (Wave 4 of Major Degree):
First support levels:
$3,239.99 (intermediate validation level)
$3,147.28 (previous structure)
Final projected correction target:
$2,866.94, coinciding with a strong demand zone and relevant technical support.
🧠 Technical Narrative
The price has been in a strongly bullish trend, but after completing a clear impulsive structure and approaching a significant supply zone, a significant correction is anticipated. This analysis is based on Elliott Wave Theory, complemented by Fibonacci levels and institutional supply/demand zones.
The projection suggests that gold could make a final rally to $3,450-$3,500, and from there initiate a deep correction toward the $2,866 area, where there is a technical support confluence.
🚨 Key Levels to Watch
Type Level
3,504.89 Supply Zone (maximum resistance)
3,453.01 Supply Zone (start)
3,239.99 Bearish Validation Level
3,147.28 Intermediate Support
2,866.94 Correction Target (potential buy zone)
🔔 Conclusion
The current structure suggests a high probability of a correction in gold after this strong bullish momentum. The most likely scenario is a correction toward $2,866, an area that could offer a new medium-term buying opportunity if validated by price action.
🕰️ Recommended follow-up to confirm reversal patterns and manage risk in case of trading this potential correction.
🧾 Trade Plan (Short)
🔹 Ideal Sell Zone:
Between $3,453.01 and $3,504.89 (institutional supply zone)
Look for reversal patterns (bearish engulfing candles, pin bars, M-patterns, RSI/MACD divergences)
🔹 Suggested Entry:
Step-level entry between $3,460 and $3,500
🔹 Stop Loss:
Above $3,550 (last previous high + protection)
🔹 Take Profits:
TP1: $3,239.99
TP2: $3,147.28
TPF: $2,866.94
🔹 Estimated Risk/Reward:
R:B from 1:4 to 1:6, depending on management and execution
💡 Strategy Alternative (Conservative)
Wait for confirmation of a bearish structure (such as a double top or a breakout of the previous low) before entering, with a tighter stop but less exposure.
🔔 Trading Summary
Value Element
Entry $3,460 – $3,500 (supply zone)
Stop Loss > $3,550
TP1 $3,239.99
TP2 $3,147.28
TP Final $2,866.94
💬 Do you like this approach? Do you have a different count? Share it in the comments!
#XAUUSD #Gold #TradingPlan #Wave4 #ShortSetup #ElliottWave #Fibonacci #SupplyZone #SwingTrade #TechnicalAnalysis #TradingIdeas
Gold Intraday Buy Setup from Key Support Zone| Targeting 3333 48This 15-minute chart for XAUUSD shows price reacting from a support zone after a bearish structure break. The market formed a bullish candle at support, hinting at a potential reversal.
Key levels:
- Key Point: 3333 – a crucial resistance to break for bullish continuation.
- 1st Target: 3333 – aligning with the key point, a breakout here would confirm buyer strength.
- 2nd Target: 3348 – next major resistance level.
- All Time High zone is above this level, signaling a potential longer-term bullish push if broken.
The current price action suggests buyers may step in from this support, aiming first for 3333 and then possibly extending to 3348.
Based on the chart setup and price structure:
🟢 Buy Setup (From Support Zone):
- Entry: Around 3318–3315 (current price area)
- Stop Loss (SL): 3305 (just below the support zone to allow some buffer)
- Take Profits (TPs):
- TP1: 3333 (near key point resistance — secure partials here)
- TP2: 3348 (major resistance zone — potential full target)
---
🔐 Risk Management Suggestion:
- Risk-to-reward ratio: ~1:1 for TP1, ~2:1 for TP2
- Once TP1 is hit, consider moving SL to entry to secure the trade.

When to Sell GOLD?? When will Gold STOP RISING? When will gold stop rising - When to sell gold and start investing in other assets
Hey everyone, Tradevietstock is back again! Today, I’m diving into gold investing after a hot streak in gold prices, with everyone in the media talking about it. There’s even some unofficial info and rumors claiming gold could reach 6,000USD per ounce. But what data shows that gold prices will continue to rise dramatically, maybe even double? And, more importantly, when will gold stop rising? And what is the exact time to sell it and take profit? Let’s break down the data below.
Our view at Tradevietstock is that gold won’t keep climbing like that. Instead, this is the time to look for opportunities to sell at the best price. FOMO (fear of missing out) at this point, chasing gold at its peak, can lead to significant losses, especially if you’re a short-term speculator.
Looking at recent movements, XAUUSD has surged for three consecutive sessions, each by around 3%. To me, this signals strong FOMO in the gold market—not a good sign for new buyers.
i. Gold Price History
1. Historical Data from 1970
Gold has seen significant spikes in the past, similar to the recent surge. Below is a summary of gold price history from 1987 to present, highlighting periods of strong consecutive increases and other key benchmarks.
2. The historical context at key moments
=> As we can see from the events above, gold tends to rise during periods of financial instability and geopolitical tension. However, from 2022 to now, gold prices have almost doubled, and all macroeconomic negative news has been priced in. So, when will gold stop rising and when to sell it?
ii. Probability Data
1. Quantitative Statistics
Below is a statistical comparison of XAUUSD gold prices with similar strong price movements observed in April 2025:
Looking at the data, we can see that gold prices generally decrease from the 30th session onward, after experiencing a 3% increase each session. The 30th session begins on April 9, 2025. Additionally, since 2024, gold has increased by more than 60%.
2. Probability Results
Based on probability calculations from April 9, 2025, the opportunity to buy new positions in XAUUSD is virtually gone. After the 10th and 30th sessions, it's no longer advisable to enter new positions. Instead, it's time to look for sell positions or lock in profits.
=> Since the cycle began, gold has accumulated for 213 consecutive sessions, while the average accumulation period for XAUUSD is about 290 sessions. This is quite close. The longer the accumulation phase, the stronger the price increase afterward. However, we’ve already seen a significant rise in gold prices, meaning most of the potential gains have already been priced in.
3. What Signals Confirm That Gold Prices Will Drop Sharply?
When will gold stop rising and when should we sell it? The answer is simple: we need clear confirmation signals from XAUUSD. In this case, the signal would be a sharp 5% decline in a single session. Based on statistical probability and historical data, such 5% declines have historically confirmed the start of a bear market for gold, meaning prices will either decrease or remain stagnant for an extended period.
A notable 5% drop occurred on May 15, 2006, when gold had previously surged by approximately 55% over a period of about 246 sessions. The outcome was that gold prices dropped by around 14% in the next 30 sessions.
Another example of when to sell occurred on December 4, 2009, when gold experienced a 4% decline after a previous gain of 24% over 144 consecutive sessions. Since the prior gain wasn’t exceptionally strong, XAUUSD only dropped around 6% in the following 50 sessions.
From these examples, we can conclude that gold tends to rise sharply after an accumulation cycle of about 200 sessions or more, with subsequent price increases of 50% or higher. The stronger the previous rise, the larger the drop afterward, typically around 14-15%.
4. Data from Gold Sentiment
When will gold stop rising? When should you sell gold? Based on the Gold Sentiment data from MacroMicro, it’s clear that as the Survey Diffusion Index increases, gold prices tend to rise. Conversely, when this index decreases, gold prices enter a correction phase, leading to a period of stagnation.
Currently, the Survey Diffusion Index has been declining since around March 2025. So when will gold stop rising? This suggests that the gold price may soon reach the end of its upward cycle. However, since this is a lagging indicator, selling or locking in profits requires considering additional factors.
iii. Conclusion
So, when will gold stop rising and when should you sell it? Will the price reach 6,000USD per ounce? According to our analysis, the right time to sell or lock in profits is when a 5% drop occurs in a single session. This conclusion is based on data, not speculation. Gold prices are unlikely to hit 6,000USD per ounce in the near future and will likely need to go through another cycle with an average accumulation period of 200 sessions. The price target to take profit could be around 3,600USD
I hope that the information in this When will gold stop rising article will help you begin your investment journey smoothly and with more confidence. Wishing everyone successful investments and profits!

XAUUSD 15minutes Forecast Hello guys I hope you're well hopefully, you have made a good profit from our prediction, so let us tell you that today, in our 15-minute time frame, our candle has become bearish/mean 3345, where our target will be bullish mean 3310

XAUUSD 4Hr. Timeframe Shorting opportunity 4Hr. Timeframe chart suggests Selling opportunity till buying zone. What do you think? Please comment. ❤️🙏👍

I know, gold bulls don't want to read this right now...I know, gold bulls don't want to read this right now...
But even during bull markets, gold had these corrections:
Dec 1974 to Aug 1976, drop over 48%.
Mar 2008 to Oct 2008, drop over 33%.
Aug 2020 to Sep 2022, drop over 22%.
Same setup now with price historically stretched.

#XAUUSD: Last Four Analysis Helped US Gain Over 4000+ Pips!Next?Our previous four analysis has yielded a substantial gain of over 4,000 pips. Analysing the current market situation, we anticipate that the price may either experience a significant drop or continue its upward trajectory.
Should a resolution be achieved between the trade tariffs imposed by China and the United States, we anticipate a substantial decline in gold prices. Conversely, if the situation remains unchanged, which is the more probable outcome at present, we will have two potential trading opportunities.
The first entry involves the assumption that the price will remain unchanged and continue its upward trend. The second entry is contingent upon a correction in the price.
We extend our best wishes and express our gratitude for your unwavering support throughout our endeavours. We sincerely hope that this analysis will serve as a valuable guide for your own trading endeavours.
Much Love
Team Setupsfx_

Lingrid | GOLD Weekly ANALYSIS: UNPRECEDENTED Rally ContinuesOANDA:XAUUSD market continues pushing to higher and higher levels. The market went up approximately 7% in a single week. This was a big upward move, if not the biggest upward move in one week this year. As the market approaches the 3250 level, we can see some price deceleration. This may lead to a corrective move. After such an impulse move, the market usually consolidates. Therefore Monday and Tuesday might be sideways move days.
On the daily timeframe, the price is creating an ABC move which potentially completes around the 3300 level. If Monday's candle opens with a gap up, this suggests the price may surge again. However, if we get a pullback, then we can look for buying opportunities below the 3200 support level or the previous day's low.
Traders, if you liked this idea or if you have your own opinion about it, write in the comments. I will be glad 👩💻

Don't miss this Golden opportunity of a GOLD SHORT!Gold’s been on a solid uptrend for a while now, and it recently broke through all the previous highs. But yesterday’s move was crazy — it shot up in a parabolic way, which isn’t typical at all. Usually after a move like that, you can expect a strong pullback. Honestly, this might be the short-term top for gold. I’m starting to see an A-shaped reversal forming, and it looks like it’s heading back down to grab the liquidity sitting below.
Let me know if you agree or disagree

XAUUSD - MONTHLY FIBS - A STORY TO TELL?Confluences:
-Monthly Fib Ratios have all been tested, priced has reached the -1.3618 FIB TP range. (Strong indicator of a reversal since it's a peak of the entire move since Sept 2022 (3 years)
-RSI is in overbought territory if we compare it to the left side of the historical moves which happened (Look at the blue line)
-Fundamentals maybe in favor of profit taking and tariffs issues cooling down in the weeks to come which could signify that we are at the top of the bullish move.
-Wait for confirmations and engulfing candle to paint on the chart which indicates strong selling pressure before taking any trades.
-Buying at ATH prices, will not be recommended for now since late buyers clouded in FOMO often end up losing their money if this sells off aggressively
Cheers

Gold will hit $3400!!Gold has successfully broken above its resistance zone and the top of the ascending channel, indicating strong bullish momentum.
Two support zones have been identified below the current price. A correction toward one of these levels is expected before the next bullish leg begins.
After a pullback to one of these support areas, we expect gold to resume its uptrend and push toward higher levels and new highs.
Among the two, the second support zone is considered a safer entry point for long positions, as it may offer stronger support and a better risk-reward setup.

XAU/USD "The Gold" Metal Market Heist Plan (Swing/Day Trade)🌟Hi! Hola! Ola! Bonjour! Hallo! Marhaba!🌟
Dear Money Makers & Robbers, 🤑💰✈️
Based on 🔥Thief Trading style technical and fundamental analysis🔥, here is our master plan to heist the XAU/USD "The Gold" Metal market. Please adhere to the strategy I've outlined in the chart, which emphasizes long entry and short entry. 🏆💸"Take profit and treat yourself, traders. You deserve it!"💪🏆🎉
Entry 📈 :
"The loot's within reach! Wait for the breakout, then grab your share - whether you're a Bullish thief or a Bearish bandit!"
🏁Buy entry above 3070
🏁Sell Entry below 2950
📌However, I recommended to place buy stop for bullish side and sell stop for bearish side.
Stop Loss 🛑: "🔊 Yo, listen up! 🗣️ If you're lookin' to get in on a buy (or) sell stop order, don't even think about settin' that stop loss till after the breakout 🚀. You feel me? Now, if you're smart, you'll place that stop loss where I told you to 📍, but if you're a rebel, you can put it wherever you like 🤪 - just don't say I didn't warn you ⚠️. You're playin' with fire 🔥, and it's your risk, not mine 👊."
🚩Thief SL placed at 2960 (swing Trade Basis) for Bullish Trade
🚩Thief SL placed at 3050 (swing Trade Basis) for Bearish Trade
Using the 4H period, the recent / swing low or high level.
SL is based on your risk of the trade, lot size and how many multiple orders you have to take.
Target 🎯:
🏴☠️Bullish Robbers : TP 3260 (or) Escape Before the Target
🏴☠️Bearish Robbers : TP 2800 (or) Escape Before the Target
⚒💰XAU/USD "The Gold" Metal Market Heist Plan is currently experiencing a neutral to bullish trend,., driven by several key factors.... 👇👇👇
📰🗞️Get & Read the Fundamental, Macro, COT Report, Geopolitical and News Analysis, Sentimental Outlook, Intermarket Analysis, Index-Specific Analysis, Positioning and future trend targets.. go ahead to check 👉👉👉🔗🔗
📌Keep in mind that these factors can change rapidly, and it's essential to stay up-to-date with market developments and adjust your analysis accordingly.
⚠️Trading Alert : News Releases and Position Management 📰 🗞️ 🚫🚏
As a reminder, news releases can have a significant impact on market prices and volatility. To minimize potential losses and protect your running positions,
we recommend the following:
Avoid taking new trades during news releases
Use trailing stop-loss orders to protect your running positions and lock in profits
💖Supporting our robbery plan 💥Hit the Boost Button💥 will enable us to effortlessly make and steal money 💰💵. Boost the strength of our robbery team. Every day in this market make money with ease by using the Thief Trading Style.🏆💪🤝❤️🎉🚀
I'll see you soon with another heist plan, so stay tuned 🤑🐱👤🤗🤩

#XAUUSD #ForexThis chart shows the price action of Gold Spot against the U.S. Dollar (XAU/USD) on the 1-hour timeframe. Here's a quick breakdown:
- **Price Channel**: The price has been moving within an ascending channel (blue lines), indicating a strong uptrend.
- **Breakout**: The current price ($3,343.10) has broken above the upper boundary of the channel with strong momentum.
- **Bullish Bias**: A bullish
continuation is anticipated, as shown by the large blue arrow pointing upward.
- **Target & Stop-Loss**:
- **Target**: Around $3,401.25 (marked in green).
- **Stop-Loss**: Around $3,302.95 (marked in red).
- **Risk-Reward**: The setup appears to offer a favorable risk-reward ratio for a long position.
Do you want an analysis of potential reversal points or a deeper dive into entry/exit strategies?


check the trendThe price is expected to fluctuate between the two resistance and support ranges. Then, with the completion of the triangle pattern, it is expected that the start of an upward trend will form.

Global Market Overview. Part 3 — Commodities / GoldPrevious context and analysis in the article:
Gold isn’t rising — it’s holding its breath
Gold has always served as a shock-absorbing safe haven.
It’s not a profit-driven asset — it’s a refuge. Every time the market starts humming with anxiety, gold silently braces.
Pandemics, geopolitical tension, trade wars, Fed rhetoric, or a poorly timed phrase from the President — they all trigger the same pattern: capital flows into the metal.
And 2025 is no exception.
With trade escalation between the U.S. and China, demand for gold has surged to new local highs.
The panic — skillfully inflated by headlines and press conferences — has done its job. We see gold near its peak, and it might not be done yet.
The real question is: why is gold here at all?
The answer is simple: gold didn’t climb on its own — it was lifted by a wave of fundamental instability, primarily fueled by U.S. policy.
Not a “safe haven” — a forced alternative
Investors didn’t move into gold because they suddenly believe in the metal.
They moved because they no longer believe in the market. Because what they see on screen is chaos — tariffs, threats, vague statements, disinformation, political pressure on the Fed — and no clear path forward.
And when the path disappears, they turn to what isn’t politically tied — or at least appears not to be.
Everyone knows gold doesn’t create value. It produces nothing, pays no dividends, funds no innovation.
It just sits. And waits.
But in uncertain times — that’s exactly what investors want: time and silence.
Bitcoin once again out of play
Yes, crypto enthusiasts still dream of the day when capital fleeing panic will head not for gold, but for Bitcoin.
But in today’s reality — it’s the same old pattern:
Big money moves to metal, not blockchain.
Institutions still choose an asset with thousands of years of trust, not a volatile instrument that could collapse after one regulatory hearing.
Gold at $3,000 — then what?
The target zone for gold in this panic cycle could well be $3,000 per ounce. And yes, it’s possible.
But only as long as fear lives.
The moment clarity returns — especially in the Washington–Beijing storyline — gold will lose its appeal.
And it will fall just as fast as it rose.
The market isn’t driven by fundamentals — it’s driven by perception.
And perception is fickle.
Today, everyone runs for shelter.
Tomorrow, there’s “positive progress in negotiations” — and capital runs from gold to equities, risk assets, buybacks, and tech.
Gold is not a goal. It’s a pit stop.
The financial theater under Trump’s direction
In my view, we’re not just witnessing a volatile phase.
We’re watching a deliberate manipulation.
The media noise rose in just a few weeks. The panic feels artificially inflated. Too many coincidences.
The stock market crashes. Assets depreciate.
And then, just days later, the very same voices behind the headlines begin buying the dip.
This isn’t a conspiracy theory.
It’s an obvious scheme:
Panic. Crash. Accumulate. Recovery. Profit. Repeat.
Trump and his inner circle aren’t conducting policy — they’re executing a financial operation.
And if anyone believes this market will fall forever — they don’t understand how cycles work in the hands of skilled manipulators.
Growth is fast. So is the illusion of control.
Understand one more thing:
As fast as the market rose — it can collapse just as quickly.
Especially when that growth is built not on fundamentals, but on fear-fueled liquidity.
Once tension breaks, gold will fall first.
Followed by stocks — particularly those overpriced during the rush into “safe” alternatives.
A market fueled by panic cannot grow for long.
It burns like paper.
Final thought
A deal between the U.S. and China is near.
The information noise is too loud to be real.
The stock market will again show how chaos can create opportunity.
And gold… gold will fade into the background.
Because safe havens are only needed while the sirens are sounding.
And in this theater — the sirens are already nearing their final act.

XAU/USD - Potential TargetsDear Fellow Traders,
How I see it:
Gold has the potential for a small correction
My "BULLISH" targets in case "Confluence of Support" holds -
* TP1; TP2 & TP3 as indicated.
My "BEARISH" target in case "Confluence of Support" are breached -
* TP1 as indicated.
Feel free to ask if anything is unclear.
Thank you for taking the time to study my analysis.

Lingrid | GOLD new All-Time HIGHS with Potential PULLBACK TradeThe price has perfectly fulfilled my previous forecast . OANDA:XAUUSD market has established another new all-time high and continues pushing toward higher levels. The price has now reached a resistance zone at 3300, potentially marking an area where we might see a rollback—creating an opportunity to go long. The price has formed a range zone around the 3225 level, and this support might serve as an optimal area to look for buy signals. Furthermore, an upward trendline sits below this range, having previously acted as both support and resistance. Given today's scheduled high-impact news, we should anticipate increased market volatility. My goal is resistance zone around 3390
Traders, if you liked this idea or if you have your own opinion about it, write in the comments. I will be glad 👩💻

XAUUSD Analysis todayHello traders, this is a complete multiple timeframe analysis of this pair. We see could find significant trading opportunities as per analysis upon price action confirmation we may take this trade. Smash the like button if you find value in this analysis and drop a comment if you have any questions or let me know which pair to cover in my next analysis.

Gold Hits Another All-Time High Amid Market JittersHello,
XAUUSD has once again surged to a record high of 3245.515 this Friday, driven by a weakening dollar and renewed U.S.-China tensions. As uncertainty grows, gold continues to shine as a safe haven asset—bolstered by fears of a potential recession and lingering inflation concerns.
The rally is further supported by rising expectations that the Federal Reserve may soon begin cutting interest rates. While some analysts anticipate a short-term pullback, the broader trend remains bullish, fueled by rate cut hopes, global instability, and ongoing strong demand.
Currently, gold is hovering around a key resistance level at 3272.103 . This area could mark the final push—designed to trap overly optimistic buyers—before a potential bearish reversal. If this resistance holds, it could trigger a significant downside move, possibly targeting the 1-year pivot point (PP) at 2466.313 . Although current conditions may not seem to support such a drop, these are exactly the kind of unexpected moves market manipulators might orchestrate.
Remember what happened when Trump posted bullish comments followed by a 90-day tariff break? Stocks temporarily soared. The takeaway? Anything is possible. One could argue there's an effort to stabilize the USD, masked by public optimism that doesn’t always reflect economic reality.
This all points to a potential bigger play unfolding—a move that temporarily strengthens the dollar, possibly as part of a broader long-term strategy. We’re likely to see sharp bursts of USD strength followed by weakness, creating a rollercoaster pattern as the U.S. works to rebuild and gradually reinforce its currency.
Trump’s current leverage comes from the power of the U.S. consumer—arguably among the most valuable in the world. Over time, more countries may be compelled to strike favorable deals with the U.S. to avoid economic fallout from imposed tariffs. It’s like a trial period for a premium service: first, you get a taste of the benefits without tariffs, and once you're accustomed to it, the terms change—creating a stark contrast that acts as a negotiation tool.
This “shock factor” strategy—swinging from favorable to harsh conditions—puts other nations in a position of urgency and increases the likelihood of deal-making. While technicals and fundamentals still play a role in the market, tariffs are currently the main catalyst behind the scenes.
In summary:
📊 XAUUSD Market Overview – April 2025
🟡 Current Status
Latest High: 3245.515 🔺 (Record-breaking)
Key Resistance: 3272.103
Trend: Bullish momentum fueled by:
Weaker USD 💵
Fed rate cut expectations 📉
Recession & inflation fears 😟
Geopolitical tension (U.S.–China) 🌏⚠️
🔮 Potential Scenarios
Condition Market Reaction
🔼 Break above 3272.103 More upside likely – bull trend continuation 🐂📈
🔽 Rejection at 3272.103 Bearish reversal – trap for late buyers 🐻📉
🎯 Bearish Target: 1Y Pivot Point @ 2466.313
📌 Underlying Narrative
USD Stabilization Strategy: Behind-the-scenes moves to strengthen dollar temporarily.
Tariff Manipulation: Market shocks used as leverage in international trade talks.
Trump Factor: Tariffs → Shock value → Deals → Strengthen USD via negotiation.
Psychology: "Free trial" tactic – benefits removed to push for favorable deals.
📈 Key Takeaway
If 3272.103 holds as resistance → Bearish move ahead
If broken → Expect continued bullish momentum
Good luck out there!
The Support and Resistance outlined in green and red are the respective support/resistance for this pair currently for 1D-1Y timeframes!
No Nonsense. Just Really Good Market Insights. Leave a Boost
TradeWithTheTrend3344

Bullish continuation?The Gold (XAU/USD) has bounced off the pivot and could rise to the 1st resistance.
Pivot: 3,300.14
1st Support: 3,245.08
1st Resistance: 3,376.40
Risk Warning:
Trading Forex and CFDs carries a high level of risk to your capital and you should only trade with money you can afford to lose. Trading Forex and CFDs may not be suitable for all investors, so please ensure that you fully understand the risks involved and seek independent advice if necessary.
Disclaimer:
The above opinions given constitute general market commentary, and do not constitute the opinion or advice of IC Markets or any form of personal or investment advice.
Any opinions, news, research, analyses, prices, other information, or links to third-party sites contained on this website are provided on an "as-is" basis, are intended only to be informative, is not an advice nor a recommendation, nor research, or a record of our trading prices, or an offer of, or solicitation for a transaction in any financial instrument and thus should not be treated as such. The information provided does not involve any specific investment objectives, financial situation and needs of any specific person who may receive it. Please be aware, that past performance is not a reliable indicator of future performance and/or results. Past Performance or Forward-looking scenarios based upon the reasonable beliefs of the third-party provider are not a guarantee of future performance. Actual results may differ materially from those anticipated in forward-looking or past performance statements. IC Markets makes no representation or warranty and assumes no liability as to the accuracy or completeness of the information provided, nor any loss arising from any investment based on a recommendation, forecast or any information supplied by any third-party.
