#XAUUSD: Last Four Analysis Helped US Gain Over 4000+ Pips!Next?Our previous four analysis has yielded a substantial gain of over 4,000 pips. Analysing the current market situation, we anticipate that the price may either experience a significant drop or continue its upward trajectory.
Should a resolution be achieved between the trade tariffs imposed by China and the United States, we anticipate a substantial decline in gold prices. Conversely, if the situation remains unchanged, which is the more probable outcome at present, we will have two potential trading opportunities.
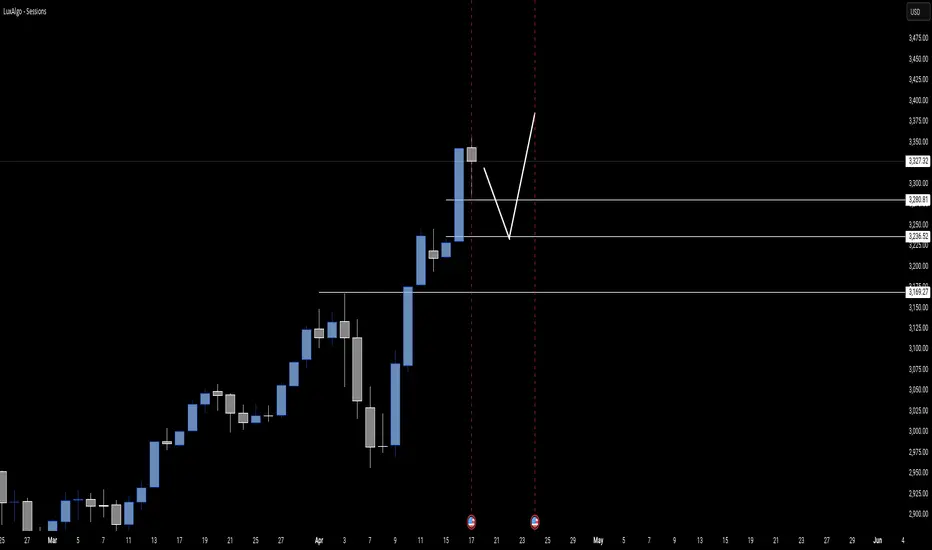
The first entry involves the assumption that the price will remain unchanged and continue its upward trend. The second entry is contingent upon a correction in the price.
We extend our best wishes and express our gratitude for your unwavering support throughout our endeavours. We sincerely hope that this analysis will serve as a valuable guide for your own trading endeavours.
Much Love
Team Setupsfx_
USCGC trade ideas

check the trendThe price is expected to fluctuate between the two resistance and support ranges. Then, with the completion of the triangle pattern, it is expected that the start of an upward trend will form.

Global Market Overview. Part 3 — Commodities / GoldPrevious context and analysis in the article:
Gold isn’t rising — it’s holding its breath
Gold has always served as a shock-absorbing safe haven.
It’s not a profit-driven asset — it’s a refuge. Every time the market starts humming with anxiety, gold silently braces.
Pandemics, geopolitical tension, trade wars, Fed rhetoric, or a poorly timed phrase from the President — they all trigger the same pattern: capital flows into the metal.
And 2025 is no exception.
With trade escalation between the U.S. and China, demand for gold has surged to new local highs.
The panic — skillfully inflated by headlines and press conferences — has done its job. We see gold near its peak, and it might not be done yet.
The real question is: why is gold here at all?
The answer is simple: gold didn’t climb on its own — it was lifted by a wave of fundamental instability, primarily fueled by U.S. policy.
Not a “safe haven” — a forced alternative
Investors didn’t move into gold because they suddenly believe in the metal.
They moved because they no longer believe in the market. Because what they see on screen is chaos — tariffs, threats, vague statements, disinformation, political pressure on the Fed — and no clear path forward.
And when the path disappears, they turn to what isn’t politically tied — or at least appears not to be.
Everyone knows gold doesn’t create value. It produces nothing, pays no dividends, funds no innovation.
It just sits. And waits.
But in uncertain times — that’s exactly what investors want: time and silence.
Bitcoin once again out of play
Yes, crypto enthusiasts still dream of the day when capital fleeing panic will head not for gold, but for Bitcoin.
But in today’s reality — it’s the same old pattern:
Big money moves to metal, not blockchain.
Institutions still choose an asset with thousands of years of trust, not a volatile instrument that could collapse after one regulatory hearing.
Gold at $3,000 — then what?
The target zone for gold in this panic cycle could well be $3,000 per ounce. And yes, it’s possible.
But only as long as fear lives.
The moment clarity returns — especially in the Washington–Beijing storyline — gold will lose its appeal.
And it will fall just as fast as it rose.
The market isn’t driven by fundamentals — it’s driven by perception.
And perception is fickle.
Today, everyone runs for shelter.
Tomorrow, there’s “positive progress in negotiations” — and capital runs from gold to equities, risk assets, buybacks, and tech.
Gold is not a goal. It’s a pit stop.
The financial theater under Trump’s direction
In my view, we’re not just witnessing a volatile phase.
We’re watching a deliberate manipulation.
The media noise rose in just a few weeks. The panic feels artificially inflated. Too many coincidences.
The stock market crashes. Assets depreciate.
And then, just days later, the very same voices behind the headlines begin buying the dip.
This isn’t a conspiracy theory.
It’s an obvious scheme:
Panic. Crash. Accumulate. Recovery. Profit. Repeat.
Trump and his inner circle aren’t conducting policy — they’re executing a financial operation.
And if anyone believes this market will fall forever — they don’t understand how cycles work in the hands of skilled manipulators.
Growth is fast. So is the illusion of control.
Understand one more thing:
As fast as the market rose — it can collapse just as quickly.
Especially when that growth is built not on fundamentals, but on fear-fueled liquidity.
Once tension breaks, gold will fall first.
Followed by stocks — particularly those overpriced during the rush into “safe” alternatives.
A market fueled by panic cannot grow for long.
It burns like paper.
Final thought
A deal between the U.S. and China is near.
The information noise is too loud to be real.
The stock market will again show how chaos can create opportunity.
And gold… gold will fade into the background.
Because safe havens are only needed while the sirens are sounding.
And in this theater — the sirens are already nearing their final act.

Gold Intraday Buy Setup from Key Support Zone| Targeting 3333 48This 15-minute chart for XAUUSD shows price reacting from a support zone after a bearish structure break. The market formed a bullish candle at support, hinting at a potential reversal.
Key levels:
- Key Point: 3333 – a crucial resistance to break for bullish continuation.
- 1st Target: 3333 – aligning with the key point, a breakout here would confirm buyer strength.
- 2nd Target: 3348 – next major resistance level.
- All Time High zone is above this level, signaling a potential longer-term bullish push if broken.
The current price action suggests buyers may step in from this support, aiming first for 3333 and then possibly extending to 3348.
Based on the chart setup and price structure:
🟢 Buy Setup (From Support Zone):
- Entry: Around 3318–3315 (current price area)
- Stop Loss (SL): 3305 (just below the support zone to allow some buffer)
- Take Profits (TPs):
- TP1: 3333 (near key point resistance — secure partials here)
- TP2: 3348 (major resistance zone — potential full target)
---
🔐 Risk Management Suggestion:
- Risk-to-reward ratio: ~1:1 for TP1, ~2:1 for TP2
- Once TP1 is hit, consider moving SL to entry to secure the trade.

#XAUUSD #ForexThis chart shows the price action of Gold Spot against the U.S. Dollar (XAU/USD) on the 1-hour timeframe. Here's a quick breakdown:
- **Price Channel**: The price has been moving within an ascending channel (blue lines), indicating a strong uptrend.
- **Breakout**: The current price ($3,343.10) has broken above the upper boundary of the channel with strong momentum.
- **Bullish Bias**: A bullish
continuation is anticipated, as shown by the large blue arrow pointing upward.
- **Target & Stop-Loss**:
- **Target**: Around $3,401.25 (marked in green).
- **Stop-Loss**: Around $3,302.95 (marked in red).
- **Risk-Reward**: The setup appears to offer a favorable risk-reward ratio for a long position.
Do you want an analysis of potential reversal points or a deeper dive into entry/exit strategies?

XAU/USD) Flag Analysis Read The ChaptianSMC Trading point update
Analysis presents a bullish outlook for XAU/USD (Gold vs USD) on the 1-hour timeframe, based on Smart Money Concepts (SMC). Here’s a breakdown of the key elements:
---
Key Analysis Points:
1. Order Block + Key Support Zone:
Price recently tapped into a bullish order block around the $3,166.74–$3,208.62 zone.
This area is also marked as a "key support level", suggesting a strong demand zone.
The confluence of the Fair Value Gap (FVG) and order block gives this zone higher validity for potential reversal.
2. Bullish Market Structure:
The chart shows higher highs and higher lows, indicating a bullish trend.
Price action broke above a small consolidation, showing bullish momentum is resuming.
3. Projected Target:
The target point is set at $3,283.01, suggesting about a 55-point upside from the current price.
This target sits above a previous high, indicating anticipation of a liquidity grab or breakout.
4. RSI (Relative Strength Index):
RSI is at 57.94, which is a neutral-to-bullish zone. It supports the idea that there's still room for price to move up before being overbought.
5. EMA 200 (Exponential Moving Average):
The price is well above the 200 EMA, confirming a bullish bias in the higher timeframe.
Mr SMC Trading point
---
Possible Strategy:
Long (Buy) Entry Zone: Between $3,166–$3,208 (ideal near the order block/FVG).
Target: $3,283
Stop Loss: Below the order block, ideally below $3,166 to avoid getting wicked out.
---
Final Thoughts:
This is a well-structured bullish setup based on institutional concepts like order blocks and FVGs. The price is aligned with the trend, and RSI supports more upside. However, watch for any major news catalysts (especially with those economic event icons shown).
Pales support boost 🚀 analysis follow)

Gold M30 Technically OverviewGold is trading around 500 to 700 pips daily as we can see Gold market too volatile so trade safe stay safe don't gamble follow the instructions for learning something new gold will go up more so trade safe stay smart with Albert and Happy Trading

Gold price should retrace to its liquidity zone of 3200Gold is hyperbullish. Price should retrace to its liquidity zone of 3200

Gold Hits Another All-Time High Amid Market JittersHello,
XAUUSD has once again surged to a record high of 3245.515 this Friday, driven by a weakening dollar and renewed U.S.-China tensions. As uncertainty grows, gold continues to shine as a safe haven asset—bolstered by fears of a potential recession and lingering inflation concerns.
The rally is further supported by rising expectations that the Federal Reserve may soon begin cutting interest rates. While some analysts anticipate a short-term pullback, the broader trend remains bullish, fueled by rate cut hopes, global instability, and ongoing strong demand.
Currently, gold is hovering around a key resistance level at 3272.103 . This area could mark the final push—designed to trap overly optimistic buyers—before a potential bearish reversal. If this resistance holds, it could trigger a significant downside move, possibly targeting the 1-year pivot point (PP) at 2466.313 . Although current conditions may not seem to support such a drop, these are exactly the kind of unexpected moves market manipulators might orchestrate.
Remember what happened when Trump posted bullish comments followed by a 90-day tariff break? Stocks temporarily soared. The takeaway? Anything is possible. One could argue there's an effort to stabilize the USD, masked by public optimism that doesn’t always reflect economic reality.
This all points to a potential bigger play unfolding—a move that temporarily strengthens the dollar, possibly as part of a broader long-term strategy. We’re likely to see sharp bursts of USD strength followed by weakness, creating a rollercoaster pattern as the U.S. works to rebuild and gradually reinforce its currency.
Trump’s current leverage comes from the power of the U.S. consumer—arguably among the most valuable in the world. Over time, more countries may be compelled to strike favorable deals with the U.S. to avoid economic fallout from imposed tariffs. It’s like a trial period for a premium service: first, you get a taste of the benefits without tariffs, and once you're accustomed to it, the terms change—creating a stark contrast that acts as a negotiation tool.
This “shock factor” strategy—swinging from favorable to harsh conditions—puts other nations in a position of urgency and increases the likelihood of deal-making. While technicals and fundamentals still play a role in the market, tariffs are currently the main catalyst behind the scenes.
In summary:
📊 XAUUSD Market Overview – April 2025
🟡 Current Status
Latest High: 3245.515 🔺 (Record-breaking)
Key Resistance: 3272.103
Trend: Bullish momentum fueled by:
Weaker USD 💵
Fed rate cut expectations 📉
Recession & inflation fears 😟
Geopolitical tension (U.S.–China) 🌏⚠️
🔮 Potential Scenarios
Condition Market Reaction
🔼 Break above 3272.103 More upside likely – bull trend continuation 🐂📈
🔽 Rejection at 3272.103 Bearish reversal – trap for late buyers 🐻📉
🎯 Bearish Target: 1Y Pivot Point @ 2466.313
📌 Underlying Narrative
USD Stabilization Strategy: Behind-the-scenes moves to strengthen dollar temporarily.
Tariff Manipulation: Market shocks used as leverage in international trade talks.
Trump Factor: Tariffs → Shock value → Deals → Strengthen USD via negotiation.
Psychology: "Free trial" tactic – benefits removed to push for favorable deals.
📈 Key Takeaway
If 3272.103 holds as resistance → Bearish move ahead
If broken → Expect continued bullish momentum
Good luck out there!
The Support and Resistance outlined in green and red are the respective support/resistance for this pair currently for 1D-1Y timeframes!
No Nonsense. Just Really Good Market Insights. Leave a Boost
TradeWithTheTrend3344

#XAUUSD UP TREND Thanks for sharing the updated chart.
Here’s a breakdown of what’s going on now:
### **Current Context (Gold Spot/USD - 1H)**:
- **Price**: $3,327.38 (down 0.47%).
- **Trend Channel**: Still in play, though the price briefly broke below the lower boundary and quickly re-entered — a potential **fakeout**.
- **Corrective Structure**: The “(W)-(X)” label suggests an **Elliott Wave corrective pattern** (likely a W-X-Y correction). The price may still be in the “X” leg moving upward before completing “Y.”
- **Key Levels**:
- **Support**: Around $3,302 (same as the previous chart’s stop-loss).
- **Resistance/Target**: $3,380 — matching the top of the previous breakout attempt.
### **Trade Setup**:
- A long position is being considered with a bounce off the lower trendline.
- Entry around $3,327–$3,331 with target near $3,380.
- Stop-loss again around $3,303 — maintaining tight risk management.
### **Interpretation**:
- The market may have completed a short-term correction and is possibly forming a higher low (if “W” holds).
- A break above point “X” would confirm bullish continuation to $3,380 or higher.
- If price breaks below “W” ($3,302), the bullish structure might fail, and deeper retracement becomes likely.
Do you want to explore a possible short scenario if the lower boundary breaks again, or are you planning to ride the bullish continuation? NASDAQ:NVDA OANDA:XAUUSD OANDA:XAUUSD

Gold XAUUSD Intrady Move 17/04/2025🟨 XAU/USD Technical Analysis – April 17, 2025
Timeframe: Intraday (M15/H1)
🔍 Overview:
The gold shows a bullish structure overall, with price currently in a corrective phase. Two key demand zones are marked, which align with prior structure and order block formations. The projection shows two potential bullish scenarios — both suggesting high reward-to-risk trades.
🔹 Key Zones to Watch:
First Buy Zone: 3311–3315 (Upper Grey Box)
Reason: Previous demand zone + minor structure support + potential higher low.
Buy Signal: Look for bullish engulfing or break of descending trendline from current correction.
Target: 3354
Stop Loss: Below 3304
Second Buy Zone: 3292–3296 (Lower Grey Box)
Reason: Stronger support from previous consolidation + demand zone.
Buy Signal: Reversal candlestick (e.g., pin bar / engulfing) or divergence on RSI/MACD.
Target: 3354
Stop Loss: Below 3285
🔔 Note for Confirmation:
If price reverses before entering the first zone, wait for a break of structure (BoS) above 3328 to confirm bullish momentum.
If price drops to second zone, wait for a reversal signal (e.g., hammer, morning star) before buying.
Avoid FOMO entries; let price confirm demand reaction.
Hit follow, like and comment.

Gold could potentially retrace back into this identified fvgGold could potentially retrace back into this identified fair value gap (FVG), and if it respects this zone as a point of interest, we may see a bullish reaction. This reaction could serve as a catalyst for the market to resume its upward trend and possibly form a new higher high in the process.

Gold will hit $3400!!Gold has successfully broken above its resistance zone and the top of the ascending channel, indicating strong bullish momentum.
Two support zones have been identified below the current price. A correction toward one of these levels is expected before the next bullish leg begins.
After a pullback to one of these support areas, we expect gold to resume its uptrend and push toward higher levels and new highs.
Among the two, the second support zone is considered a safer entry point for long positions, as it may offer stronger support and a better risk-reward setup.

Shieldsmine Vlog Alright, mate, let’s break down this EUR/USD H4 setup across these platforms—TradingView and MetaTrader—like we’re sittin’ at the desk, charts up, coffee in hand. We’ve got a solid uptrend from early April, but the pair’s hittin’ a wall around that 1.14200–1.14290 zone as of April 16-18, 2025. Let’s dive in.
Price action’s been clean on both charts. We’ve rallied hard from 1.09480 on April 4, smashed through resistance levels like a hot knife through butter, and now we’re at 1.14039 on TradingView with a tight 0.03 pip spread—sell at 1.14039, buy at 1.14172. MetaTrader’s showin’ a similar story, sell at 1.14039, buy at 1.14204. That 1.14200 area’s a proper battleground—price peaked at 1.14216 on TradingView and 1.14204 on MetaTrader, but the bulls couldn’t hold it. Now we’re consolidating with those tight, choppy candles. Classic indecision.
Lookin’ at the levels, that 1.14290 on TradingView and 1.14204 on MetaTrader is the key resistance to watch. MetaTrader’s got some extra juice with those 30-minute order blocks marked—there’s a supply zone right at that 1.14204 high, where sellers are likely steppin’ in, and a demand zone down at 1.13800–1.13900 where buyers might pile in if we drop. They’re also flaggin’ a 65% probability on a move—could be a breakout or a reversal, but the market’s coiled up tight for somethin’ big.
Trend-wise, we’re still bullish overall, but this consolidation’s got me on edge. If we break above 1.14290, I’m lookin’ at 1.14660 as the next target—plenty of room to run. But if we get rejected here, I wouldn’t be surprised to see a pullback to that 1.13800 demand zone, maybe even 1.13550 if things get ugly. MetaTrader’s showin’ a small open position on EUR/USD, up 0.175 pips—nice little profit, but it’s a tiny lot size, so not much conviction there yet.
Bottom line: we’re at a proper inflection point. I’d be watchin’ for a clean break above 1.14290 with volume to confirm the bulls are back in control, or a hard rejection with a bearish candle to signal a drop. Either way, keep your stops tight—this market’s about to make a move, and I don’t wanna be caught on the wrong side of it. What’s your next play?

3382 , next ATH number today, GOLD⭐️GOLDEN INFORMATION:
Gold price (XAU/USD) enters a phase of consolidation on Thursday, trading within a narrow range near its all-time high reached during the Asian session, as investors digest conflicting market signals. Stronger-than-expected US Retail Sales figures and hawkish remarks from Federal Reserve (Fed) Chair Jerome Powell have lent support to the US Dollar (USD), curbing some of gold’s upside momentum. Meanwhile, the upbeat sentiment across equity markets and mildly overbought technical conditions are prompting traders to remain cautious, limiting fresh buying interest in the precious metal for now.
⭐️Personal comments NOVA:
Gold price continues to increase today, the fomo still has no end, pay attention to the new ATH price zone 3382
⭐️SET UP GOLD PRICE:
🔥SELL GOLD zone : 3381- 3383 SL 3388
TP1: $3370
TP2: $3355
TP3: $3333
🔥BUY GOLD zone: $3302 - $3300 SL $3295
TP1: $3310
TP2: $3320
TP3: $3330
⭐️Technical analysis:
Based on technical indicators EMA 34, EMA89 and support resistance areas to set up a reasonable BUY order.
⭐️NOTE:
Note: Nova wishes traders to manage their capital well
- take the number of lots that match your capital
- Takeprofit equal to 4-6% of capital account
- Stoplose equal to 2-3% of capital account


On April 21st, gold bottomed out and rebounded, making a deep diIn the short-term trend, the pullback on Thursday halted at 3,284 and did not reach the vicinity of the support level of 3,245, which was converted from the previous high as we had predicted. Thus, the support level can be shifted upwards to 3,285. Regarding the upper resistance, attention should be paid to the suppression situation of the historical high at 3,357. If the news over the weekend, especially the statements regarding the trade conflicts and those from Trump, continue to prompt the Federal Reserve to cut interest rates, it will significantly increase the probability of a rise in the price of gold.
From a comprehensive analysis perspective, it is still recommended to focus on going long on pullbacks for the trading operations next week. As for the entry points, the first one is at 3,310. This level serves as a stepped support level for the high-level pullback and also as a retracement point during the rebound. Therefore, it can be used as an entry point to bet on an upward movement. Mainly focus on the suppression at the high point of 3,357 above. If the price continues to break through this level, it is expected that the price can reach up to 3,509.
If your current gold trading performance is not satisfactory and you hope to avoid detours in your investment, you are welcome to communicate and exchange ideas with us!

XAU/USD "The Gold" Metal Market Heist Plan (Swing/Day Trade)🌟Hi! Hola! Ola! Bonjour! Hallo! Marhaba!🌟
Dear Money Makers & Robbers, 🤑💰✈️
Based on 🔥Thief Trading style technical and fundamental analysis🔥, here is our master plan to heist the XAU/USD "The Gold" Metal market. Please adhere to the strategy I've outlined in the chart, which emphasizes long entry and short entry. 🏆💸"Take profit and treat yourself, traders. You deserve it!"💪🏆🎉
Entry 📈 :
"The loot's within reach! Wait for the breakout, then grab your share - whether you're a Bullish thief or a Bearish bandit!"
🏁Buy entry above 3070
🏁Sell Entry below 2950
📌However, I recommended to place buy stop for bullish side and sell stop for bearish side.
Stop Loss 🛑: "🔊 Yo, listen up! 🗣️ If you're lookin' to get in on a buy (or) sell stop order, don't even think about settin' that stop loss till after the breakout 🚀. You feel me? Now, if you're smart, you'll place that stop loss where I told you to 📍, but if you're a rebel, you can put it wherever you like 🤪 - just don't say I didn't warn you ⚠️. You're playin' with fire 🔥, and it's your risk, not mine 👊."
🚩Thief SL placed at 2960 (swing Trade Basis) for Bullish Trade
🚩Thief SL placed at 3050 (swing Trade Basis) for Bearish Trade
Using the 4H period, the recent / swing low or high level.
SL is based on your risk of the trade, lot size and how many multiple orders you have to take.
Target 🎯:
🏴☠️Bullish Robbers : TP 3260 (or) Escape Before the Target
🏴☠️Bearish Robbers : TP 2800 (or) Escape Before the Target
⚒💰XAU/USD "The Gold" Metal Market Heist Plan is currently experiencing a neutral to bullish trend,., driven by several key factors.... 👇👇👇
📰🗞️Get & Read the Fundamental, Macro, COT Report, Geopolitical and News Analysis, Sentimental Outlook, Intermarket Analysis, Index-Specific Analysis, Positioning and future trend targets.. go ahead to check 👉👉👉🔗🔗
📌Keep in mind that these factors can change rapidly, and it's essential to stay up-to-date with market developments and adjust your analysis accordingly.
⚠️Trading Alert : News Releases and Position Management 📰 🗞️ 🚫🚏
As a reminder, news releases can have a significant impact on market prices and volatility. To minimize potential losses and protect your running positions,
we recommend the following:
Avoid taking new trades during news releases
Use trailing stop-loss orders to protect your running positions and lock in profits
💖Supporting our robbery plan 💥Hit the Boost Button💥 will enable us to effortlessly make and steal money 💰💵. Boost the strength of our robbery team. Every day in this market make money with ease by using the Thief Trading Style.🏆💪🤝❤️🎉🚀
I'll see you soon with another heist plan, so stay tuned 🤑🐱👤🤗🤩

Lingrid | GOLD new All-Time HIGHS with Potential PULLBACK TradeThe price has perfectly fulfilled my previous forecast . OANDA:XAUUSD market has established another new all-time high and continues pushing toward higher levels. The price has now reached a resistance zone at 3300, potentially marking an area where we might see a rollback—creating an opportunity to go long. The price has formed a range zone around the 3225 level, and this support might serve as an optimal area to look for buy signals. Furthermore, an upward trendline sits below this range, having previously acted as both support and resistance. Given today's scheduled high-impact news, we should anticipate increased market volatility. My goal is resistance zone around 3390
Traders, if you liked this idea or if you have your own opinion about it, write in the comments. I will be glad 👩💻

XAUUSD Analysis todayHello traders, this is a complete multiple timeframe analysis of this pair. We see could find significant trading opportunities as per analysis upon price action confirmation we may take this trade. Smash the like button if you find value in this analysis and drop a comment if you have any questions or let me know which pair to cover in my next analysis.

Gold is Powering Through the Termination ChannelGold is right now in a very strong extended 5th wave.
It has finished what I believe to be the third wave of that 5th wave, so now we are entering the 4th wave of the 5th wave.
I believe it will be a very shallow 4th wave, and considering the speed of things, it will not retrace further than around the 3,000 level. and here on after continue up with the 5th wave.
Normally we would anticipate retracement back to the 38.6% fib level, which is at the 2,766 level, but gold is storming and not looking back right now.
When Gold has retraced a little, I would not be surprised if it is heading for the 4,000 level.

XAUUSD: 17/4 Today's Market Analysis and StrategyTechnical analysis of gold
Daily chart resistance 3400, support below 3193
Four-hour chart resistance 3358, support below 3292
One-hour chart resistance 3326, support below 3300
Analysis of gold news: On Wednesday, as US President Trump ordered an investigation into import tariffs on key minerals, market risk aversion quickly heated up, and gold prices broke through the $3,300 per ounce mark for the first time. Spot gold rose 2.76% after hitting an all-time high of $3,357 during the session. The dollar index fell 0.5%, making gold cheaper for overseas buyers, further pushing up gold prices. In this tariff war, various favorable factors continue to "escort" gold. With this rally, gold has risen 26% so far this year and is on the verge of surpassing its full-year 2024 performance.
Gold operation suggestions: Yesterday's single-day increase reached 120 $, and the overall technical pattern has completely entered the bullish rhythm. At present, all technical aspects are overbought, and short-term technical indicators have lost their effect. The overall logic of the rise is greatly affected by the external risk aversion sentiment, and the bullish momentum still exists.
From the current trend analysis, today's upper short-term resistance focuses on the vicinity of the 3326 mark, and the lower support focuses on the four-hour level 3292 first-line support. In terms of operation, continue to buy and trade with the trend when stepping back to this position. At the same time, gold is currently in a serious overbought pattern and beware of a sharp correction.
Selling is suitable for quick entry and exit, and the stop loss risk is relatively high! Buying with the trend is the right approach!
Sell: 3326near SL: 3330
Buy: 3292near SL: 3288
Buy: 3250near SL: 3245
