(XAU/USD) Bearish Trade Setup – Targeting $3,222 with 1:6 Risk/REntry Point: Around 3,409.33 - 3,408.41 USD.
Stop Loss: 3,437.87 USD.
Target (Take Profit): 3,222.53 USD.
Risk/Reward Ratio: Approximately 1:6, which is favorable.
📉 Price Action & Trend Analysis:
A rising wedge (or channel) appears to have formed and broken to the downside — a bearish signal.
The current price at 3,341.47 has broken below a minor support zone (highlighted in purple), indicating bearish momentum.
Price is now approaching the 200 EMA, which is acting as potential dynamic support.
📌 Key Levels Highlighted:
Support Zones: Near 3,347.47 (previous minor support) and 3,222.53 (main target zone).
Resistance Zones: At the entry level and above, near 3,437.87 (Stop Loss zone).
🔄 Indicators:
Moving Averages (Red and Blue Lines): Shorter-term moving average (red) is below the longer-term (blue), indicating downward pressure.
Momentum Shift: The sharp drop suggests a likely continuation of the bearish trend.
USCGC trade ideas

XAUUSD: Gold Once Again Back To $3270 Region, What Next ? Gold has once again backed to the 3270 region and rejected it, currently trading at 3280$. The main question is whether gold will hold on to this level. If not, we could see a strong sell-off taking the price to 3130. This is because the sellers’ presence has increased, and the price has been volatile due to mixed news and economic data, further strengthening the bears’ position in the market.
Despite this, we remain optimistic that gold will continue its bullish move upwards. There’s a strong reason for this: we may see all-out war happening in Asia, although this is purely speculative. For now, you may decide to continue monitoring the price or even take a swing buy, which could be risky.
Given the volatility of gold, we recommend trading cautiously and taking extra precautions while trading gold.
Wishing you good luck and safe trading!
Thank you for your support! 😊
If you’d like to contribute, here are a few ways you can help us:
- Like our ideas
- Comment on our ideas
- Share our ideas
Team Setupsfx_
❤️🚀

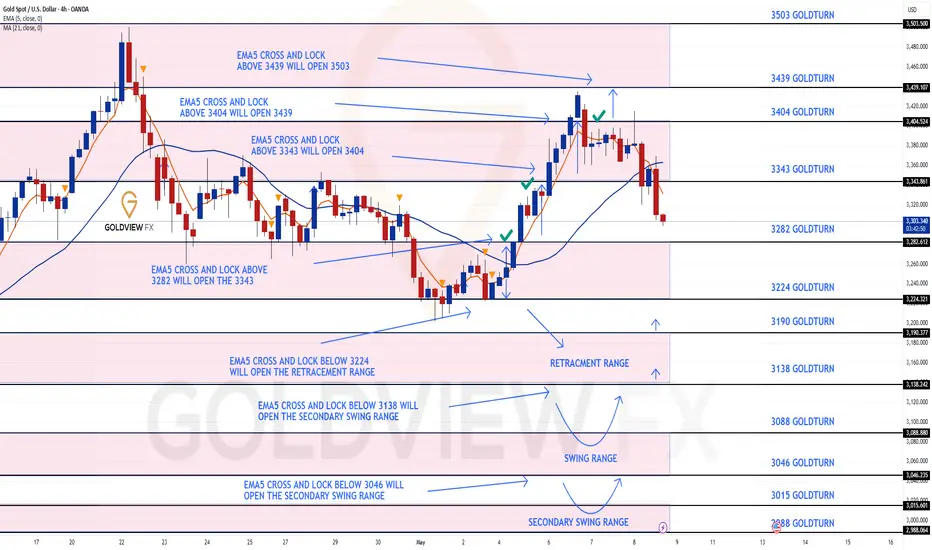
GOLD 4H CHART ROUTE MAP UPDATEHey Everyone,
Once again another smashing day on the charts today. After sharing updates and completing targets on our 1h chart idea; please now see update on our 4H chart idea, which is also playing out as analysed.
We started with our Bullish target hit at 3282, followed with ema5 cross and lock opening 3343, which was hit perfectly. We then got ema5 cross and lock above 3342 opening 3404, also got completed. The cross and lock confirmation gave plenty of time to get in for the action.
No further cross and lock with ema5 above 3404 confirmed the perfect rejection, which we are seeing now, with price testing the lower Goldturns for support.
We will continue to buy dips using our support levels taking 30 to 40 pips. As stated before each of our level structures give 20 to 40 pip bounces, which is enough for a nice entry and exit. If you back test the levels we shared every week for the past 24 months, you can see how effectively they were used to trade with or against short/mid term swings and trends.
The swing range give bigger bounces then our weighted levels that's the difference between weighted levels and swing ranges.
BULLISH TARGET
3282 - DONE
EMA5 CROSS AND LOCK ABOVE 3282 WILL OPEN THE FOLLOWING BULLISH TARGET
3343 - DONE
EMA5 CROSS AND LOCK ABOVE 3343 WILL OPEN THE FOLLOWING BULLISH TARGET
3404 - DONE
EMA5 CROSS AND LOCK ABOVE 3404 WILL OPEN THE FOLLOWING BULLISH TARGET
3439
EMA5 CROSS AND LOCK ABOVE 3439 WILL OPEN THE FOLLOWING BULLISH TARGET
3503
BEARISH TARGETS
3224
EMA5 CROSS AND LOCK BELOW 3224 WILL OPEN THE FOLLOWING RETRACEMENT RANGE
3190
3138
EMA5 CROSS AND LOCK BELOW 3138 WILL OPEN THE SWING RANGE
SWING RANGE
3088 - 3046
EMA5 CROSS AND LOCK BELOW 3046 WILL OPEN THE SECONDARY SWING RANGE
SECONDARY SWING RANGE
3015 - 2988
As always, we will keep you all updated with regular updates throughout the week and how we manage the active ideas and setups. Thank you all for your likes, comments and follows, we really appreciate it!
Mr Gold
GoldViewFX
#XAUUSD: Major Update 01/05/2025, Read Description! Gold has dropped over 700 pips since yesterday evening, suggesting further price correction. This is primarily due to strong US dollar data indicating potential correction in DXY Index prices. Additionally, there are speculations that the US has reached out to China for trade talks, although this has not been confirmed. Today and tomorrow are major trading days, with significant news expected to shape gold prices.
For now, you can monitor the prices or take entry if they reach your chosen risk management area. The decision to enter or exit is entirely up to your analysis.
Good luck and trade safely!
Thank you for your unwavering support! 😊
If you’d like to contribute, here are a few ways you can help us:
- Like our ideas
- Comment on our ideas
- Share our ideas
Team Setupsfx_
❤️🚀

Gold's Symmetrical Triangle Near Break – Support Test Imminent!Gold ( OANDA:XAUUSD ) moved as I expected in my previous post and attacked the Support zone($3,282-$3,245) and Support lines for the second time . The question is, can Gold break the Support zone($3,282-$3,245) and Support lines or not!?
Please stay with me .
Gold is moving between Support zone($3,282-$3,245) and Resistance zone($3,386-$3,357) again . In fact, it can be said that Gold has been moving in a range for the past 5-6 days .
From a Classical Technical Analysis perspective, Gold appears to be forming a Symmetrical Triangle Pattern. A break of either line could indicate the next direction for Gold, but since the Symmetrical Triangle Pattern is a Continuation Pattern , the lower line is more likely to break .
In terms of Elliott Wave Theory analysis , it seems that we still have to wait for the next five downwaves .
------------------------------------------
Today, important U.S. data — JOLTS Job Openings and CB Consumer Confidence — will be released.
Let’s quickly review their potential impact on Gold:
JOLTS Job Openings :
If the number comes lower than expected , it signals a weakening labor market, increasing the chances of a dovish Fed → Bullish for Gold .
If the number is stronger than expected , it indicates a robust labor market, pushing the Fed to stay hawkish → Bearish for Gold .
CB Consumer Confidence :
A drop in consumer confidence reflects economic worries , driving demand for safe-haven assets like Gold → Bullish .
A rise in consumer confidence shows economic strength, reducing the appeal of Gold → Bearish .
Historical Impact :
Both indices have caused strong intraday moves in Gold recently, especially if the figures surprise the market.
Summary :
Weak JOLTS and low Confidence → Gold bullish
Strong JOLTS and high Confidence → Gold bearish
Be prepared for high volatility during the releases. Always manage your risk carefully!
------------------------------------------
I expect Gold to attack the Support zone($3,282-$3,245) and Support lines for at least the third time , and if it breaks, the next target could be $3,223 .
Note: If Gold can move above $3,393, we can expect more pumps and maybe make a new All-Time High(ATH).
Gold Analyze ( XAUUSD ), 1-hour time frame.
Be sure to follow the updated ideas.
Do not forget to put a Stop loss for your positions (For every position you want to open).
Please follow your strategy; this is just my idea, and I will gladly see your ideas in this post.
Please do not forget the ✅' like '✅ button 🙏😊 & Share it with your friends; thanks, and Trade safe.

HelenP. I Gold will drop to trend line, breaking support levelHi folks today I'm prepared for you Gold analytics. Looking at the chart, we can see how the price has recently formed a narrowing wedge structure after a strong impulsive rally. The price reached a significant peak and then started consolidating, forming lower highs with fading bullish pressure. What we now see is a classic sign of price compression within a pennant pattern. Currently, the market is testing the key resistance zone between 3360 - 3380 points. This area aligns with the upper boundary of the wedge, and the price has already reacted to it multiple times. Buyers were unable to break through convincingly, indicating a potential exhaustion of momentum. Meanwhile, the lower boundary is represented by a dynamic trend line. Given this structure, I expect Gold can decline toward the support trend line and possibly reach 3300 points, my goal. The combination of horizontal resistance, trend weakening, and pattern tightening supports a short bias. Given the recent lower high, the rejection near resistance, and the wedge formation, I remain bearish and anticipate further decline. If you like my analytics you may support me with your like/comment ❤️

Gold latest market analysisAt present, the gold 1-hour moving average crosses downwards and the short positions are arranged. Now it is under pressure at 3270 and is suppressed and falls back. 3270 is still the key turning point for gold bulls and bears. Although there is a rebound, the magnitude of the decline is not large. If the pressure at 3270 is not broken, the gold bulls will not reverse easily for the time being. After the rebound, it will continue to fall, which means that the strength of gold bears is still there, and the gold reversal will naturally not reach a new low, so that the gold bulls will usher in a new turn. Gold operation strategy reference: Short (buy short) two-tenths of the position in batches near the rebound of gold at 3260-3265, stop loss 6 points, target near 3230-3210, break to see the 3200 line.

THE KOG REPORT - Update End of day update from us here at KOG:
We can honestly say, even though the KOG Report plan didn't work out as we intended this week, it's been a phenomenal week on gold in Camelot. We've managed to capture the top (AGAIN), then bounced the low, then produced the FOMC KOG Report which gave us another level to level short with a pip perfect bounce for the long.
Early we published the play stating 3370 needs to break to go higher which it didn't giving the move downside that we're seeing now. Support here is below on this move if they manage to break through the 3300 level. No point attempting a long or short here as it's late session so the levels to watch are:
Support 3301 / 3296 and below that 3276
Resistance 3310 and above that 3320 which will need to break
As always, trade safe.
KOG

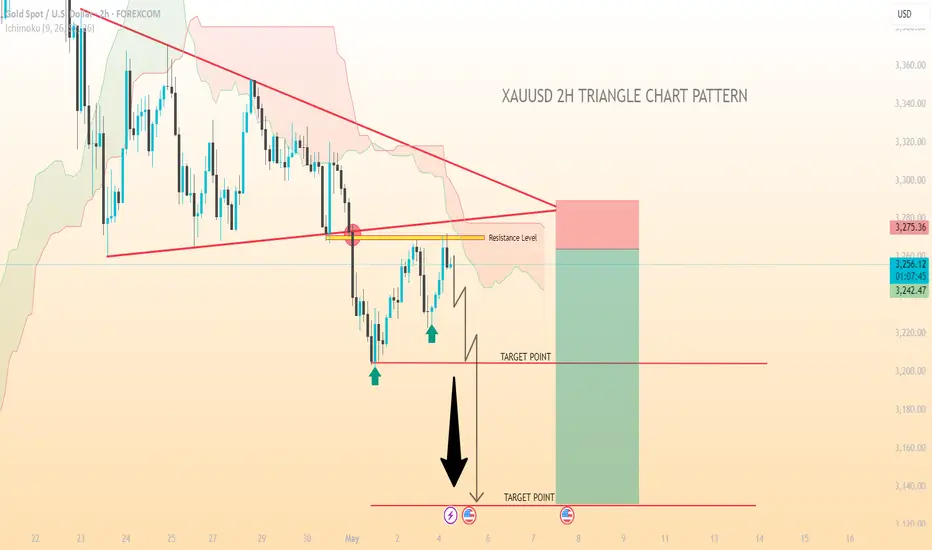
XAU/USD..2h triangle chart pattern*XAU/USD (Gold vs. US Dollar) sell trade** based on the details you provided:
### **Trade Summary**
- **Action:** Sell
- **Entry Price:** 3256
- **Resistance Level:** 3270
- **Stop Loss (SL):** 3288 (320 pips above entry)
- **Take Profit Targets (TP):**
- **TP1:** 3204 (-520 pips)
- **TP2:** 3130 (-1260 pips)
### **Risk-Reward Ratio (RRR)**
- **Risk (SL to Entry):** 320 pips
- **Reward (Entry to TP2):** 1260 pips
- **RRR:** **1:3.9** (Favorable if TP2 is reached)
### **Key Considerations**
1. **Resistance at 3270** – A bounce from this level could confirm bearish momentum.
2. **Stop Loss Placement (3288)** – Protects against a breakout above resistance.
3. **Targets:**
- **TP1 (3204)** – Partial profit-taking level.
- **TP2 (3130)** – Larger downtrend target if momentum continues.
### **Trade Management Tips**
- Monitor price action near **3270**—if it breaks higher, consider early exit.
- Adjust stop loss to **breakeven** if price reaches **3200-3210** (support zone).
- Watch for **Fed policy, US Dollar strength, or geopolitical risks** that could impact gold.
Would you like additional analysis on technical indicators (RSI, MACD, etc.) to confirm the trade setup?
GOLD What Next? SELL!
My dear friends,
Please, find my technical outlook for GOLD below:
The price is coiling around a solid key level - 3263.7
Bias - Bearish
Technical Indicators: Pivot Points Low anticipates a potential price reversal.
Super trend shows a clear sell, giving a perfect indicators' convergence.
Goal - 3249.1
Safe Stop Loss - 3271.6
About Used Indicators:
The pivot point itself is simply the average of the high, low and closing prices from the previous trading day.
Disclosure: I am part of Trade Nation's Influencer program and receive a monthly fee for using their TradingView charts in my analysis.
———————————
WISH YOU ALL LUCK

DeGRAM | GOLD has reached the channel boundary📊 Technical Analysis
● Chart shows a bullish breakout from the falling wedge into a rising channel. Support near $3,300 held firm, and price is now above the $3,360 pivot, eyeing the $3,430–$3,500 resistance zone. Oscillators on daily chart remain positive, reinforcing the upward bias.
💡 Fundamental Analysis
● Global uncertainty is fueling safe-haven demand: tensions in Ukraine, the Middle East and renewed US-China trade fears are supporting gold.
● A softer US dollar and policy uncertainty also boost bullion; analysts note continued demand keeping prices elevated above $3,000.
● Bank of America highlights that US trade-policy uncertainty will “lend support” to gold prices.
✨ Summary
Upside momentum remains strong, with key support around $3,300–$3,360. Gold’s long bias points toward ~$3,500 in the short term, underpinned by geopolitical risks and a weak dollar.
-------------------
Share your opinion in the comments and support the idea with a like. Thanks for your support!

Lack of bullish momentum, gold price waits, slight decrease✍️ NOVA hello everyone, Let's comment on gold price next week from 05/05/2025 - 05/09/2025
🔥 World situation:
Gold (XAU/USD) slipped by more than 0.35% on Friday and is on track to close the week with a decline exceeding 2.5%, as easing trade tensions and upbeat US labor market data boosted investor risk appetite. This shift in sentiment encouraged profit-taking ahead of the weekend, weighing on the safe-haven asset. At last check, XAU/USD was trading around $3,226, pulling back from an intraday peak of $3,269.
Adding to the improved market mood, China’s Commerce Ministry confirmed that the US has shown a willingness to resume discussions on tariffs, while reiterating that Beijing remains open to dialogue.
🔥 Identify:
Gold price continues to adjust down, lacking momentum to increase price. around price range 3200 - 3350
🔥 Technically:
Based on the resistance and support areas of the gold price according to the H4 frame, NOVA identifies the important key areas as follows:
Resistance: $3285, $3316, $3355
Support : $3202, $3155
🔥 NOTE:
Note: Nova wishes traders to manage their capital well
- take the number of lots that match your capital
- Takeprofit equal to 4-6% of capital account
- Stoplose equal to 2-3% of capital account
- The winner is the one who sticks with the market the longest
Easing market risks put pressure on GOLDOANDA:XAUUSD fell to a two-week low on Thursday (May 1), mainly due to signs of easing trade tensions and a long holiday in China, the world's largest gold consumer. Investors will be looking ahead to the US non-farm payrolls report due today (Friday), which is expected to cause major market movements.
Easing trade tensions between the US and other countries have kept investors optimistic throughout the week. In addition, easing US-China trade tensions have also added to the pressure on gold as there are no additional risks to stimulate safe-haven demand.
US President Donald Trump has decided to exempt some tariffs on the auto industry and made progress on deals with India, South Korea and Japan. On Wednesday local time, Trump said there was a great chance of reaching a trade deal with China and that there were "potential" trade deals with India, South Korea and Japan, and that he was working to reach agreements with the three countries.
The Trump administration hopes to reach preliminary trade agreements with several trading partners within weeks, U.S. Trade Representative Greer said Wednesday. U.S. Commerce Secretary Mattis Lutnick said at least one trade deal is close to being announced, several others are close to being finalized, and Trump may be waiting for an opportunity to announce them all at once.
Data released on Wednesday showed the US economy contracted in the first quarter and the personal consumption expenditures (PCE) price index was flat in March, turning investors' attention to the non-farm payrolls report due out today (Friday). The US non-farm payrolls report for April will be released on May 2 (8:30 a.m. ET). Expectations for the non-farm report are that traders and economists expect the report to show 133,000 new jobs in the US, average hourly earnings increased 0.3% month-on-month (up 3.9% year-on-year), and the U3 unemployment rate remained unchanged at 4.2%.
Fed policymakers said they would keep interest rates on hold until there are clear signs that inflation is falling toward the 2% target or there is a possibility that the job market is deteriorating.
Technical Outlook Analysis OANDA:XAUUSD
Technically, gold remains in the best position for bullish expectations with support from the EMA21 and the 0.50% Fibonacci retracement. Meanwhile, the Relative Strength Index (RSI) is also reacting to the 50 level, which is considered the closest support in terms of momentum.
In the short term, if gold returns to trade above $3,270, it will be considered the best condition for a bullish recovery to end the broad-based correction.
However, if gold is sold below $3,228 and maintains its price action below this level, it will likely continue to decline with a subsequent target of around $3,163 in the short term.
In the day, considering the current position, gold still has conditions for a bullish outlook technically and the notable price levels will be listed as follows.
Support: $3,228 – $3,163
Resistance: $3,267 – $3,270
SELL XAUUSD PRICE 3270 - 3268⚡️
↠↠ Stop Loss 3275
→Take Profit 1 3262
↨
→Take Profit 2 3256
BUY XAUUSD PRICE 3174 - 3176⚡️
↠↠ Stop Loss 3170
→Take Profit 1 3182
↨
→Take Profit 2 3188

GOLD (XAUUSD): Retest of ATH Soon!Gold broke through a daily significant horizontal resistance level yesterday and closed above it.
It appears that the bullish trend is likely to continue, with the price expected to retest its all-time high soon.
After reaching this level, be prepared for a potential breakout that could drive prices even higher.

Gold's Bearish Momentum Builds from PRZ-Short SetupGold ( OANDA:XAUUSD ) started to decline exactly from PRZ (previous idea) as I expected in my previous idea . And with the loss of the Support zone($3,387-$3,357) we can expect further decline.
Gold is currently moving near the Resistance zone($3,387-$3,357 ) and the Potential Reversal Zone(PRZ) .
From the Elliott Wave theory , Gold appears to have completed a five-wave impuls e and we should expect corrective waves . Since the momentum of the second decline that broke the Support zone($3,387-$3,357) is high , the correction is expected to continue and Gold appears to be completing a pullback .
---------------------------------------------
The US Unemployment Claims Index was also released a few minutes ago, and let's take a look and examine the possible impact on Gold .
This better-than-expected data confirms a stronger U.S. labor market , reducing the urgency for the Fed to cut rates anytime soon .
Impact on Gold :
A resilient job market supports the hawkish stance of the Fed , which could keep downward pressure on Gold in the short term as yields and the dollar remain firm.
However, traders should remain cautious and watch for upcoming data and Fed commentary, which could shift the tone.
---------------------------------------------
I expect Gold to start falling from Potential Reversal Zone(PRZ) to the targets I have indicated on the chart. The first target could be around $3,319 .
Note: If Gold touches $3,401(the worst Stop Loss(SL)), we can expect the resistance lines to break and gold to rise further.
Gold Analyze ( XAUUSD ), 1-hour time frame.
Be sure to follow the updated ideas.
Do not forget to put a Stop loss for your positions (For every position you want to open).
Please follow your strategy; this is just my idea, and I will gladly see your ideas in this post.
Please do not forget the ✅' like '✅ button 🙏😊 & Share it with your friends; thanks, and Trade safe.

Gold (XAU/USD) Intraday Buy Setup with High Reward-to-Risk Ratio1. Entry Point Zone: Around 3,271.79 USD
This is identified as a potential buy entry area, marked in purple.
2. Stop Loss: Below the entry point at 3,257.71 USD
Risk management level in case the trade moves against the setup.
3. Target Point One: Between 3,313.75 and 3,317.07 USD
A short-term take-profit level, likely based on previous resistance.
4. Final Target (EA Target Point): Around 3,373.04 USD
A more ambitious take-profit, possibly based on a major resistance level or Fibonacci extension.
5. Trade Range:
Risk: 3,271.79 - 3,257.71 = 14.08 USD
Reward to First Target: ~42 USD

Gold bulls are coming on strongFrom the 4-hour analysis, gold bulls are making another strong impact. On the top, we pay attention to the short-term suppression at 3385-90 and the suppression at 3400. On the bottom, we pay attention to the short-term support at 3350 and the important support at 3336-40. In terms of operation, we mainly go long on pullbacks. In the middle position, we should watch more and do less, chase orders cautiously, and wait patiently for key points to enter the market.

XAU/USD (Gold) Analysis 2/5/20251. XAU/USD recently recorded an all-time high (ATH) at the 3150 level.
2. Following a healthy retracement, we are now eyeing potential long opportunities near the 3100 zone.
3. The 3100 level presents a favorable risk-reward entry point, aligned with historical support.
4. Market sentiment remains bullish, supported by strong fundamentals and ongoing geopolitical tensions.
5. A breakout above the previous ATH could open the door for a continued rally toward higher resistance levels.
6. Our upside targets for this move are in the range of 3450 to 3500, offering considerable profit potential.
7. Price consolidation near 3100 indicates accumulation, reinforcing the long bias.
8. We anticipate renewed buying pressure as the market tests key psychological and technical levels.
9. Risk management will be crucial, with stops ideally placed just below the 3050 support region.
10. Overall, this setup offers a compelling long trade backed by technical structure and market momentum.

Gold Trade Plan 5/5/2025Dear Traders,
If we take a look at the gold chart, it is currently in a descending channel, and the price is trying to reach the top of that channel. Given these conditions, I believe the price will reach the target zone around 3285–3290 by midweek. If we observe a rejection at that level, we can enter a sell position, with the first target being the midline of the channel and the final target being the bottom of the channel. If the descending channel is strongly broken and the price stabilizes above it, a new update will be necessary.
Trend-base Fibo Extension AB=CD 3290
Fibo Retracement(1.618)= 3298
Top Of Descending Channel : 3290-3300
So we Are looking for Reversal 3290-3300 Area !
If you enjoyed this forecast, please show your support with a like and comment. Your feedback is what drives me to keep creating valuable content."
Regards,
Alireza

XAU/USD Market Outlook – Key Levels & Scenarios (May 2025)📊 Market Overview
Asset: XAU/USD (Gold vs. USD) – likely
Timeframe: 🕒 4H or Daily
EMAs:
🔴 50 EMA = 3,281 (short-term trend)
🔵 200 EMA = 3,179 (long-term trend)
🧱 Key Zones
🔺 Main Resistance Zone (🚫 Supply Area)
📍 ~3,320–3,400
🔍 Observation: Strong rejection zone with multiple failed attempts. 🚧 Price struggles to break and hold above here.
⚖️ Mid Support & Resistance Zone
📍 ~3,200–3,250
🧭 Current Action: Price is consolidating here. This is a key decision zone. A bounce or breakdown will likely decide the next big move. 🤔
🟦 Main Support Zone
📍 ~2,980–3,030
🛑 Observation: Major demand zone. If price falls here, it might attract buyers 👥 for a potential rebound.
📉 EMA Analysis
🔴 50 EMA is above 🔵 200 EMA → Trend still technically bullish ✅
🟡 BUT: Price is currently below 50 EMA, showing short-term weakness ⚠️
⚡️ 200 EMA is nearby (~3,179): Acting as dynamic support — a critical bounce zone! 🛡️
🔮 Scenarios
🐂 Bullish Path
✅ If price bounces from 3,200 support zone and reclaims 🔴 50 EMA:
🎯 Target: Retest of 3,320–3,400 🔺 zone
📈 Confirmation: Strong candle closing above 3,281 🔴 EMA
🐻 Bearish Path
🚨 If price breaks below 3,200 & 200 EMA:
🕳️ Expect drop towards 2,980–3,030 🟦 zone
📉 Confirmation: Candle closes below 3,179 with weak retest
✅ Conclusion
📍 Key Level to Watch: 3,200
⚖️ Market Sentiment: Neutral → Bearish bias unless price reclaims 50 EMA
🔒 Risk Tip: Avoid longs until price confirms bullish structure again 🔐

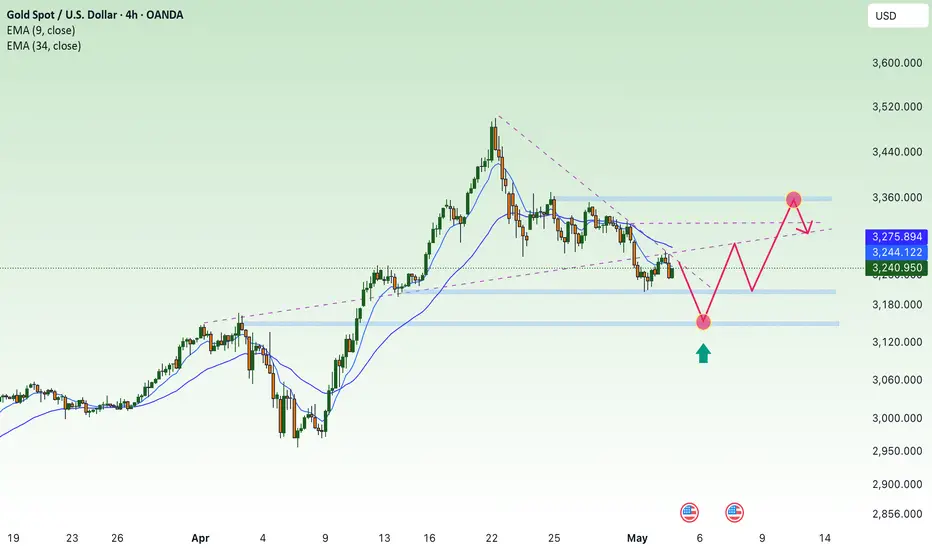
XAU/USD: Bullish Momentum Builds Near Breakout Zone, Key SupportGold (XAU/USD) is gaining strength after rebounding from trendline support, forming a sharp impulsive move and now hovering near a potential breakout zone. Momentum remains bullish, as the price reclaims previous highs and eyes the upper resistance boundary around 3,495.000.
The structure favors trend continuation as long as price remains above the key support zone at 3,345.000, where trendline and previous day’s high converge. A sustained move above 3,400 could confirm a breakout, but the risk of a false breakout remains.
Currently, the price is consolidating above a critical intersection of trendline and horizontal support near 3,300. This level must hold for bulls to retain control. A bounce from this zone would support a move toward the upper resistance, with the next target at 3,495.000. However, a break below 3,345.000 may invalidate the setup and lead to deeper correction

THE KOG REPORT - UpdateEnd of day update from us here at KOG:
BOOMING! We said we would stick with the plan, we did, and BOOM, straight into the level we wanted. What we did want from there however is a bounce, but instead, we got just over 100pips long and then back into the lower level where we are now ranging.
Unless there is a late session move and 3210 holds us up to target the 3250-55 level initially, we'll wait lower now which is where the Asia session may take it.
With NFP tomorrow, we can expect that typical pre-event price action to begin soon, so maybe best practice now is to wait for them to do what they want, and come back next week to capture better set ups.
DOW, NAS, BTC, GOLD, EU and Oil all performing for us today, well done team. Another day in the office.
We'll be back tomorrow with the NFP KOG Report and our view.
As always, trade safe.
KOG

XAUUSD DETAILED ANALYSIS TECHNICAL AND FUNDAMENTALS XAUUSD is currently trading around the 3256 level and is clearly respecting a descending channel on the 1-hour timeframe. The price is now pushing higher from the lower boundary of the channel, suggesting short-term bullish momentum. Based on the current technical structure, I am anticipating a clean breakout above the channel resistance, with the next key target at 3300. The marked purple resistance zone around 3310–3320 also acts as a magnet for price once the breakout is confirmed.
On the fundamental side, gold remains supported by ongoing geopolitical uncertainty and speculation around the Fed's next rate decision. With recent U.S. economic data showing mixed signals—strong labor market figures but slowing inflation momentum—the market is pricing in fewer rate hikes, which weakens the USD and favors upside in XAUUSD. Additionally, central bank gold demand remains strong globally, acting as a long-term support for bullion.
Traders are currently reacting to a softening dollar index and treasury yields, which further underpins bullish sentiment in gold. A clear break above the upper boundary of this channel, ideally with strong volume confirmation, could set the stage for a swift move to retest the 3300 psychological level. From a risk-reward perspective, the breakout trade setup here aligns well with institutional strategies that favor trend continuation post-consolidation.
In summary, XAUUSD is trading inside a clean descending channel, with buyers stepping in aggressively near the support zone. A breakout above the structure could trigger a bullish continuation move toward 3300, backed by strong macro tailwinds and technical confirmation. This setup offers an excellent opportunity for swing traders to capitalize on short-term momentum. Are you also tracking gold fundamentals this week?
