USCGC trade ideas

GOLD Bullish Bias! Buy!
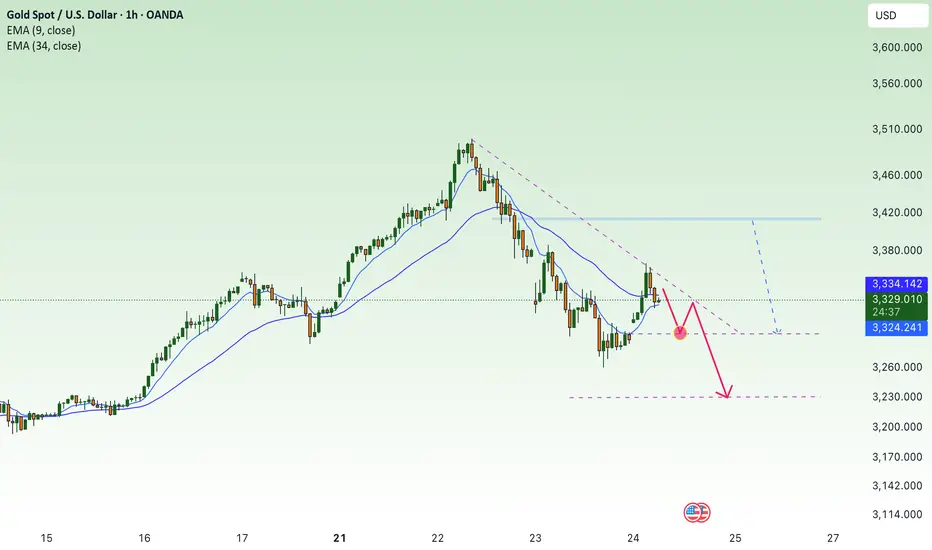
Hello,Traders!
GOLD is trading in a strong
Uptrend and the price is
Making a local bearish correction
So after it retests the horizontal
Support level below around 3344$
We will be expecting a rebound
And a further bullish move up
Buy!
Comment and subscribe to help us grow!
Check out other forecasts below too!
Disclosure: I am part of Trade Nation's Influencer program and receive a monthly fee for using their TradingView charts in my analysis.

XAU/USD) orderblok key Support Analysis Read The ChaptianSMC Trading point update
technical analysis of Gold Spot against USD (XAUUSD) on the 1-hour timeframe. Here's a breakdown of the key ideas presented:
Chart Analysis Summary:
1. Price Zones:
Supply Zone (Resistance): Around the 3,355–3,365 level.
Demand/Support Zone (Doer Block Support Level): Around 3,282–3,291.
2. Current Price Action:
Price is currently at $3,331.96, close to the supply zone, and bouncing between the zones.
There’s a sharp downtrend, which seems to be slowing down near the support level.
3. Projected Move:
The chart suggests a short-term dip back into the demand/support zone, followed by a bullish reversal.
Target Point: A move back up toward $3,498.36, which is marked as a significant resistance.
4. Technical Indicators:
RSI (Relative Strength Index): Currently around 36.64 and recovering, suggesting potential bullish divergence or an oversold condition.
200 EMA: Around $3,291.52, providing dynamic support — aligning with the lower demand zone.
Mr SMC Trading point
Trade Idea:
Buy Setup (Long Trade):
Entry: Near 3,282–3,291 (support zone).
Target: 3,498.36.
Stop Loss: Below the support zone (~3,270).
Overall Idea:
This is a reversal-based setup. The price is expected to retest the support before launching a bullish leg toward the target. The confluence of the EMA, support zone, and RSI near oversold adds weight to the potential for a bounce.
Pelas support boost 🚀 analysis follow)

XAU/USD Gold Trade Plan 24/4/2025XAUUSD (Gold) Trading Outlook:
Buy Entry: $3,325
Key Support Zones: $3,260 and $3,200
Market Scenarios:
Bullish Scenario:
If XAUUSD sustains above the $3,260–$3,200 support zone, the bullish structure remains intact. A rebound from this zone may offer a buying opportunity with an upside target of $3,500.
Bearish Scenario:
If the price breaks below the $3,200 support level and falls through the channel, it may signal a bearish trend continuation, suggesting potential downside movement.

Gold's short-term decline continues⭐️GOLDEN INFORMATION:
Gold price (XAU/USD) regained strong upward momentum during the Asian session on Thursday, rebounding sharply from the previous day’s steep decline and ending a two-day losing streak near the $3,260 weekly low. The renewed buying interest comes amid lingering concerns over the protracted trade impasse between the US and China, following US Treasury Secretary Scott Bessent’s comments indicating that the standoff could drag on.
Compounding market anxiety is the persistent uncertainty surrounding President Donald Trump’s tariff policies and their broader implications for global growth. These factors have fueled a fresh wave of safe-haven demand, driving investors back toward gold.
⭐️Personal comments NOVA:
Still under selling pressure, gold price is consolidating below the downtrend line. Trading around 3300 and lower.
⭐️SET UP GOLD PRICE:
🔥SELL GOLD zone : 3412- 3414 SL 3419
TP1: $3390
TP2: $3380
TP3: $3370
🔥BUY GOLD zone: $3228 - $3230 SL $3223
TP1: $3240
TP2: $3250
TP3: $3260
⭐️Technical analysis:
Based on technical indicators EMA 34, EMA89 and support resistance areas to set up a reasonable SELL order.
⭐️NOTE:
Note: Nova wishes traders to manage their capital well
- take the number of lots that match your capital
- Takeprofit equal to 4-6% of capital account
- Stoplose equal to 2-3% of capital account
GOLD: A Complex Market OutlookGOLD: A Complex Market Outlook
Gold may continue rising with the dominant trend, but the situation isn’t straightforward—it’s more intricate than it appears.
So far, gold has found strong support around 3284.50. If this level holds, the price could climb further, as discussed in the video. However, if gold breaks below 3284.50, it could signal further downside.
With multiple possibilities in play, it’s up to you to decide how to position yourself. The market is presenting a more complex picture than it seems at first glance.
You may watch the analysis for further details!
Thank you!
Previous analysis:

xauusd what is happening?Gold (XAU/USD) Market Overview – April 22, 2025
🧨 Geopolitical & Trade Tensions
Ongoing US-China trade disputes and President Trump’s tariff policies continue to amplify uncertainty.
Market chatter on platforms like X (formerly Twitter) reflects investor anxiety over potential global trade disruptions, increasing gold’s appeal as a safe-haven asset.
💵 US Dollar Dynamics
The US dollar remains weak, partly due to Trump’s continued criticism of Fed Chair Jerome Powell and his calls for rate cuts.
A weaker dollar supports gold by making it more attractive to international investors.
🏦 Institutional & Central Bank Demand
Strong ETF inflows: Over 23 tonnes added in a single session, suggesting large-scale accumulation.
Central banks, particularly China, continue adding gold to reserves—contributing to bullish long-term sentiment.
🧯 Macro Environment
Persistent inflation concerns and dovish central bank policies are reinforcing gold's status as an inflation hedge.
Markets await US retail sales data and Fed Chair Powell’s speech, which could introduce volatility or direction.
📊 Technical Analysis of XAU/USD @ $3,424
📈 Trend & Chart Structure
Gold is trading in a well-defined ascending channel, with a recent breakout above $3,400 confirming bullish structure.
However, the presence of a rising wedge pattern and overbought conditions warns of a potential short-term correction.
🔐 Key Support & Resistance Levels
Type
Level
Notes
Support 1
$3,400
Psychological level & prior breakout point
Support 2
$3,320–$3,325
Fibonacci zone and fair value gap
Support 3
$3,296–$3,284
April 18 low; deeper support
Resistance 1
$3,445
Immediate resistance
Resistance 2
$3,500
All-time high; psychological milestone
Long-term
$3,550–$3,637
Medium-term upside targets
📟 Indicators & Volume Analysis
RSI: >70 on short-term charts → Overbought, suggesting risk of pullback.
MACD: Bullish crossover intact, but declining momentum is a caution flag.
Moving Averages:
Price is well above the 30-EMA ($3,265) and 200-EMA ($3,163) — strongly bullish.
Volume: Recent rally on declining volume = possible divergence, implying weakening buying strength.
📌 Trading Scenarios
✅ Bullish Case
If XAU/USD holds above $3,400 and breaks $3,445, next targets = $3,500 → $3,550 → $3,600.
Entry: Wait for a pullback to $3,400–$3,405 or bullish confirmation (e.g., bullish engulfing candle, rising volume).
Stop Loss: Below $3,390
Rationale: Strong uptrend + safe-haven flows + USD weakness = sustained bullish bias.
🚫 Bearish Case
If price breaks below $3,400 with momentum, correction toward $3,325 or $3,296 is likely.
Entry: Below $3,400 after confirmation (e.g., high-volume bearish candle)
Stop Loss: Above $3,430
Rationale: Overbought RSI + volume divergence → short-term profit-taking or macro catalyst risk.
📈 Volatility Note
Recent daily swings around 2.25% — use tight stop-losses and risk/reward ≥ 1:2.
📅 Key Events to Watch
US Retail Sales Data
Fed Chair Powell’s Speech
US-China trade news
Dollar index (DXY) movement
📅 Medium-Term Outlook (1–3 Months)
Projected move toward $3,600+ remains valid due to:
Global uncertainty
Persistent inflation
Central bank buying
Key swing support: $3,137
Upside resistance: $3,500 → $3,600
⚠️ Risks & Reversals
Risk Factor
Impact on Gold
US-China Trade Deal
↓ Demand (safe-haven outflows)
Strong US Economic Data
↑ Dollar → ↓ Gold
Hawkish Fed Comments
↓ Gold
Continued Overbought Status
Pullback/Cool-off likely
🎯 Conclusion
Gold (XAU/USD) is in a strong long-term uptrend, currently consolidating near $3,424. While bullish fundamentals support a move toward $3,500–$3,600, technical overbought signals and volume divergence suggest caution in the short term.
#xauusd #gold #usd #tariff #tradingview

XAUUSD – Weekly Outlook (April 28 – May 3)XAUUSD – Weekly Outlook (April 28 – May 3)
Current Structure:
Massive bullish momentum intact — we are still climbing into extreme premium territory.
Price has broken all previous structure highs and is trading well above the last known CHoCH (confirmed weekly bullish flow).
Current Weekly candle is showing minor exhaustion but no clear reversal confirmation yet.
Key Weekly Observations:
Premium Zone: 3350–3500 → extreme overbought territory, where distribution/reversal could begin forming.
Immediate Support: 3110–3150 → previous major liquidity grab + breakout area (could act as reaccumulation if retested).
Unmitigated Zones Below:
~2900–2950 → old FVG left behind (possible bounce if deeper correction happens).
Strong demand clusters still much lower, around 2050–2100 (only relevant if a major cycle shift occurs).
Liquidity and Flow:
Liquidity has been swept above all major highs — now hunting for fresh liquidity pools either at extreme highs (above 3350) or deeper below (below 3200).
Strong liquidity vacuum between 3280 and 3150 zones if a weekly rejection happens.
Bias:
Still bullish but hyper-extended — smart money will likely start hunting liquidity pockets on both sides soon.
Watching for early signs of weekly exhaustion or topping (large wicks, strong engulfing candle).
✅ Weekly Bias: Cautious bullish, watching for early topping patterns
✅ Key Levels to Watch: 3350–3500 (resistance), 3150–3110 (support)
🌟 Final Note for the Community:
We’re flying at premium altitudes — but don’t get drunk on heights! 🛫 Stay sharp, stay humble. Gold doesn’t ask, it takes. Let’s keep mastering the game, one sniper move at a time.
👉 Follow, like, and comment your outlook — let’s grow this smart community together! 🚀✨
#Gold #XAUUSD #SmartMoney #WeeklyOutlook

DeGRAM | GOLD Anchored Above the Channel📊 Technical Analysis
GOLD trades within an ascending channel, holding above $3 285 support.
A breakout from a triangle confirms bullish momentum. Key targets are $3 360 - $3 380.
💡 Fundamental Analysis
Demand is rising amid safe-haven flows, Chinese insurer interest, and central bank buying. A weaker USD and US - China tensions support gold.
✨ Summary
Technical breakout and strong fundamentals favor XAUUSD growth. Holding above $3 285 keeps the path open to $3 360.
-------------------
Share your opinion in the comments and support the idea with a like. Thanks for your support!

GOLD Starting To Go Up Again , Are You Ready To Get 1000 Pips ?Here is my opinion on gold for the next move , after we enter a lot of sell trades and got more than 3000 pips , now the time for looking for buy this pair if we have a 4H Closure in bullish , then we have 2 places to buy from it , show on the chart , but first we need a 4H Closure to confirm , and we will targeting 1000 pips target .

Gold 1H Bearish Setup – Targeting 3,290 and 3,240 Support ZoneGold (XAUUSD) on the 1-hour chart has formed a bearish structure after rejecting the 1st Resistance zone, showing a clear break of structure (BoS) and change of character (ChoCh). Price is currently pushing lower, aligning with the bearish momentum and sitting just above the 1st Support Zone.
If price breaks below the 1st Support Zone, the next target would be the 2nd Support Zone, around the 3,240 area. Both zones are potential areas for a bullish reaction, but momentum favors further downside for now unless a strong reversal or consolidation forms.
- 1st TP (Take Profit): Around 3,290, which aligns with the 1st Support Zone. This is your initial target where you may expect partial profit-taking or a possible bounce.
- 2nd TP (Final Target): Around 3,240, located at the 2nd Support Zone. This is a stronger support area where price may either reverse or consolidate.
So for a sell setup from the current price (~3,330):
- TP1: 3,290
- TP2: 3,240

(XAU/USD) Bullish Setup: Demand Zone Bounce with 5.89% Trgt Ptnl🔵 Current Price: $3,451.03
🟡 EMA (9): $3,457.20
🔻 Price is just below EMA — short-term pressure.
Zones & Key Levels:
🟦 Demand Zone:
🔽 Price bounced here before — strong buyer interest!
📍 Zone Range:
* Top: $3,442.38
* Bottom (Stop Loss): $3,395.87
* 🔴 Stop Loss set here to limit risk.
🟨 Entry Point:
* Entry suggested at $3,457.20
* Just above the current price and EMA — needs confirmation
* ⚠️ Wait for bullish candle or price action signal above EMA
🟩 Target Point:
🎯 Target: $3,645
* 📈 Potential gain: +202.78 pts (5.89% upside)
* 🚀 Aiming to break previous ATH (All-Time High)
Visual Trade Plan Summary:
* ✅ Buy Entry: $3,457.20
* ❌ Stop Loss: $3,395.87
* 🎯 Target: $3,645.00
* ⚖️ Risk-to-Reward: Solid, over 3:1
Sentiment:
* If price respects demand zone and reclaims EMA — bullish setup
* 🕵️♂️ Watch for volume or confirmation candle near entry

Possible H&S Forming – It’s All About the News NowOANDA:XAUUSD
📉 Watching closely: Possible Head and Shoulders formation developing on the 4H and 1H charts
As of April 24, 2025, Gold (XAU/USD) is forming a potential Head and Shoulders pattern on the shorter timeframes (4H and 1H), which could indicate a reversal setup. While multiple scenarios are still in play, the price action around the $3368 level will be crucial.
If price fails to break above this resistance in the near term, it could suggest weak bullish momentum and open the door for a pullback toward and possibly below the neckline around $3250 .
🔔 Key Economic Events – April 24
08:30 EDT – Durable Goods Orders MoM
Forecast: +2.0%
Personal outlook: Numbers might come in weaker than forecasted.
Durable goods orders are a solid gauge of industrial demand. Weaker-than-expected numbers would likely weaken the USD and could offer some upside pressure on Gold.
10:00 EDT – Existing Home Sales
Forecast: Lower than previous.
As a key barometer of consumer confidence and economic stability, lower-than-expected figures could also put pressure on the USD, potentially providing Gold a short-term bullish impulse.
📊 Potential Scenarios
Scenario 1 – Bullish Breakout
Weak economic data → USD weakens → Gold spikes above $3400
If both data points disappoint, we could see a rally in Gold, possibly breaking the resistance and invalidating the H&S pattern.
Scenario 2 – Bearish Breakdown (Preferred H&S Scenario)
Strong data → USD strengthens → Gold falls below $3200
While less likely, if economic data comes in stronger than forecasted, Gold could see a significant drop, forming the right shoulder and breaking the neckline – confirming the Head & Shoulders reversal.
Scenario 3 – Sideways Movement
Neutral data + Tariff talks in focus
In the absence of impactful data or if figures come in as expected, Gold might consolidate sideways. Ongoing developments around US-China tariff negotiations could dominate sentiment, delaying or nullifying the H&S pattern entirely.
📉 Market Sentiment Snapshot
US stocks are rallying on optimism around tariff reductions
Trump administration signaling potential easing of China tariffs
➡️ Gold under pressure as risk-on sentiment rises
📍 Conclusion
Keep an eye on the $3368 level and $3250 neckline. Short-term moves will likely be dictated by today’s economic releases and the evolving trade narrative. A confirmed break below the neckline would validate the bearish H&S scenario with potential downside toward $3200 and below.
👉 Stay nimble and trade the reaction, not just the forecast.
-------------------------------------------------------------------------
This is just my personal market idea and not financial advice! 📢 Trading gold and other financial instruments carries risks – only invest what you can afford to lose. Always do your own analysis, use solid risk management, and trade responsibly.
Good luck and safe trading! 🚀📊

GOLD WEEKLY - Key Events to Watch: ADP, Core PCE, Non-Farm📌 Weekly Gold Outlook – Key Events to Watch: ADP, Core PCE, Non-Farm Payrolls 📉📈
🌍 Fundamental Overview
Last week, gold faced heavy selling pressure after failing to sustain its rally above the $3,450 level. Easing concerns over the US–China trade tensions and a stronger US Dollar — supported by stronger-than-expected Durable Goods Orders — triggered a sharp correction in Price.
The US Federal Reserve (Fed) continues to adopt a cautious stance, awaiting clearer economic data before adjusting its monetary policy. Meanwhile, recent figures from both the US and China show signs of economic resilience, reducing safe-haven demand for gold in the short term.
Key Events This Week:
ADP Non-Farm Employment Change
Core PCE Price Index m/m
Non-Farm Payrolls (NFP)
Volatility is expected to rise sharply as these major economic indicators are released.
📊 Technical Analysis – XAU/USD 2H Chart
Gold is currently undergoing a corrective phase after its strong rally earlier this month. Price is forming a descending channel and consolidating around critical support and resistance zones.
Immediate Resistance: 3,325 – 3,377
Immediate Support: 3,275 – 3,235
As long as Price remains capped below 3,325, the bearish bias will remain dominant.
🧩 Main Scenarios for This Week
Short-Term Rebound:
Price may retest the 3,275–3,277 area before sellers regain control.
Medium-Term Bearish Pressure:
If Price fails to reclaim the 3,325 resistance zone, it could break lower toward 3,235, 3,197, and potentially deeper into the 3,108 or 3,066 liquidity zones.
Bullish Reversal Scenario:
A sustained breakout and close above 3,377 would invalidate the bearish outlook and suggest a move toward the 3,420 target.
🔍 Key Price Zones for This Week
Resistance: 3,325 → 3,377 → 3,420
Support: 3,275 → 3,235 → 3,197 → 3,108 → 3,066
🧠 Suggested Trading Strategy
Prefer short positions when Price retraces toward the 3,275 – 3,325 resistance zone, aiming for downside targets at 3,235 and 3,197.
Be cautious with long positions: only consider buying if Price drops deeply into 3,108 or 3,066 and shows strong support reaction.
⚡ Note:
Given the upcoming releases of ADP, Core PCE, and Non-Farm Payrolls, the market is expected to experience significant volatility.
Stay disciplined and await detailed intra-week updates around key event times.

Gold fluctuates and tends to be bearishGold fell by $240 in two trading days, but then rebounded strongly. The 1-hour moving average formed a dead cross. The moving average has no upward or downward momentum. Shorting can still be continued after the rebound. Therefore, it is recommended to short on rebounds and long on pullbacks. Pay attention to 3368-3370 on the top and 3260-3285 on the bottom.

Gold may hit a second bottom today!From the perspective of the daily line, yesterday's rebound relied on the short-term moving average to close positive, but the rebound was not very strong and the continuity was poor. If it can continue to close positive today, it will lay the foundation for an upward trend, and then it can be seen to gradually strengthen. If it closes negative today, or even falls below the short-term moving average, then gold may fall again.
From the previous round of bottom support 2790, there is a triple bottom, and there is a bottoming process. Therefore, gold cannot be too optimistic about returning to a strong bull market at present, and still has this psychological expectation.
As for gold today, the trend of gold rising and falling shows fatigue. If the trend line breaks, it will continue to be bearish. In the European session, it will rebound to 3336 and short. The support below is 3306. If there is no rebound but it goes sideways at a low level and continues to go down, then the first touch of 3306 can be seen as a small rebound. If 3306 breaks, then the rebound in the evening will continue to be short, and it is expected to test the lower level again.

Gold Daily Outlook Short-Term Pullback Before Trend Continuation📌 Gold Daily Outlook – Short-Term Pullback Before Trend Continuation? 💡📉
📊 Technical Overview
Gold (XAU/USD) is currently testing a key resistance zone around 3412 – 3414, where we could see short-term selling pressure emerge after recent bullish momentum. Following a strong rally, the market may be preparing for a healthy retracement to collect liquidity before resuming the trend.
The chart shows signs of a potential intraday distribution pattern forming near highs, especially as price struggles to break above resistance during the early Asian session. Today’s outlook leans toward a short-term dip into support zones before buyers potentially step back in.
🔴 SELL ZONE (Short-term Reversal Opportunity)
Entry: 3412 – 3414
Stop Loss: 3420
Take Profit: 3409 → 3400 → 3390 → 3380 → 3370
This is a high-probability reversal zone. If price prints bearish confirmation (e.g., pin bar or engulfing candle), short entries may offer favourable risk-reward setups.
🟢 BUY ZONE 1 – Minor Pullback Area
Entry: 3355 – 3353
Stop Loss: 3348
Take Profit: 3358 → 3370 → 3380 → 3390 → 3400
Ideal for quick buy setups if price reacts cleanly to this mid-structure level.
🟢 BUY ZONE 2 – Deeper Support for Trend Re-entry
Entry: 3335 – 3333
Stop Loss: 3328
Take Profit: 3338 → 3350 → 3360 → 3370 → 3380
If a deeper pullback occurs, this zone may act as a key demand area and offer clean trend continuation opportunities.
🌍 Fundamental Insight
No major economic events are scheduled today, so market direction will likely follow technical structure.
USD is showing mild intraday strength, adding some pressure on gold in the short term.
Overall sentiment still supports gold as a safe-haven, but short-term profit-taking near highs is expected after recent aggressive buying.
⚠️ Strategy Notes
Focus on trading within defined structure: Sell from resistance with confirmation; buy dips at clean support zones.
Avoid FOMO entries – let the market give you confirmation.
Always use clear TP/SL levels – especially in a sensitive market environment like this.
💬 How are you approaching gold today? Looking to fade highs or waiting for dip-buy setups? Drop your thoughts below! 👇👇👇

GOLD: $3,000 | Key Levels for LONG & SHORT entriesparabolic in progress with intense upward correction
smart money waits
active players churn
late comers increase leverage
Fundamentals 6 months late
MOMENTUM in play

GOLD OUTLOOKThis chart is a technical analysis setup for Gold Spot (XAU/USD) on the 1-hour timeframe, showing a potential sell (short) trade idea. Here's a breakdown of the chart elements:
🔍 Key Zones Identified
Entry Zone:
Around 3380$-3394$
This is the suggested area where the trader plans to enter a short position (sell), expecting price to reverse downward from here.
Stop-Loss Area:
Ends near 3,415.80 USD
This zone is above the entry area and marks the risk level — if the price reaches here, the setup becomes invalid and the trade would be exited at a loss.
Target / Reversal Zone:
This is the take-profit area where the trader expects the price to potentially reverse or where they will close the short trade with profit.
📉 Trade Idea Visualization
Price is expected to move up slightly into the entry zone.
Then reverse downwards, hitting the target near the reversal zone.
✅ Summary of the Setup
Bias: Bearish
Strategy: Wait for price to hit entry zone (~3,380.00), then sell
Stop-Loss: Above 3,415.80
Take-Profit: Near 3,246.35
Risk-Reward Ratio: Favorable (large potential reward vs. smaller risk)....

Strong buying in gold?Sentiments mixed for gold, we will see buying and selling both today, but you have to be carefull before taking any trade.
Setup gold price :-
BUY GOLD ZONE 3320-18
SL 3314
TP 3335
TP 3345
SELL GOLD ZONE 3410-13
TP 3390
TP 3370
SL 3417

XAUUSD H1 Many Pattern
Rising wedge,
Inverse head and shoulders,
Double Top,
Expanding triangle
maybe Expanding triangle is active
price will go to close fair value gap @ 3409
to make QML
good luck

XAUUSD - Support & ResistancePrice is currently respecting the 4-hour ascending/descending channel (depending on trend direction).
We've seen a clear support and resistance structure forming within the channel.
The next key support level is at 3228 — watch for price action around this zone.
Also lining up with the 50% Fibonacci retracement level from the recent move.

breakdown of chart analysis for XAU/USD (Gold Chart Analysis Summary
Pair: XAU/USD
Timeframe: 2H (2-Hour)
Trend: Recently broken bullish trendline (trendline break to the downside)
---
Entry Point:
Sell Entry: Around 3,336.235
---
Support & Resistance Levels:
Resistance Levels:
1. 3,336.235 – Previous structure, acting as immediate resistance after the trendline break
2. 3,354.275 – Recent high before the drop
Support Levels:
1. 3,280.059 – First major support zone (TP1)
2. 3,240.000 – Intermediate structure level
3. 3,201.285 – Final target (strong support zone)
---
Take Profit Targets:
TP1: 3,280.059
Final TP: 3,201.285
---
Trendline Break:
The ascending trendline was broken strongly, signaling potential shift to bearish momentum.
---
Trading Plan to Share:
> Gold (XAU/USD) 2H Bearish Setup
Sell Entry: 3,336.235
TP1: 3,280.059
Final Target (TP2): 3,201.285
Resistance: 3,336.235 / 3,354.275
Support: 3,280.059 / 3,240.000 / 3,201.285
Price broke below the ascending trendline indicating potential bearish continuation. I’m targeting support zones below for a short-term and mid-term drop
