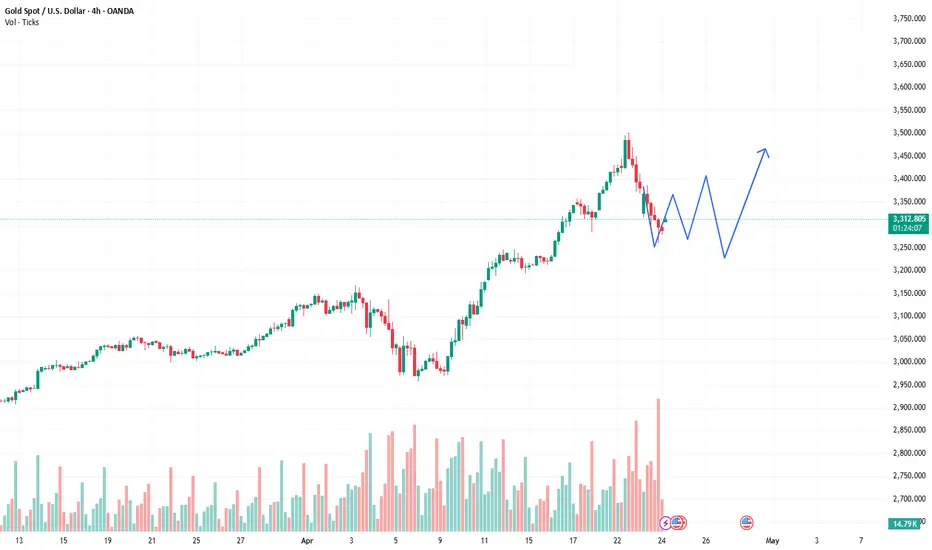
XAUUSD is moving within the 3,195.00 -3,495.00 range 👀 Possible scenario:
Gold prices fell 2.74% on April 23 after hitting a record high of $3,261, as President Trump softened his stance on trade tariffs, reducing demand for safe-haven assets. Markets also reacted to U.S. Finance Minister Bessent’s call for reciprocal tariff cuts with China to resume trade talks.
Looking ahead, traders await the U.S. Existing Home Sales report on April 24, which could impact gold—strong data may lift the dollar and pressure gold, while weak figures may boost it.
✅Support and Resistance Levels
Support level is now located at 3,195.00 .
Now, the resistance level is located at 3,495,00
USCGC trade ideas

Today's market closing of Gold is very important ! XAUUSDToday's market closing of Gold is very important. If it is closed above the 3405 level then we can it further above 3500 level. If it closes below 3385 level, then it can find support near 3260 level.
Lets see and be patient.

Sell Limit GOLD SCALP Trade IdeaAccording to My Stratg and My Plan I am they Need to Move Down From This Limit. Let's See
DYOR,
Focus On Risk TO Reward And Think About 100 Trades.. Thanks

XAUUSD 15mint ForecatHello guys, I hope you are well here let me tell you that the bearish order block has been touched, it is heading towards gold sale, our target will continue till FVG.

Gold is set to experience another significant decline!Hello, traders
After analyzing the 2-hour chart, we can see that price has been bouncing around like a pinball between 3374 and 3264 — rejected twice at the top, supported twice at the bottom.
Currently, price is chilling at 3309, smack in the middle of the range, probably wondering what to do with its life.
Now, 3345 is standing tall as a strong resistance. If price finds the courage to break above 3345, it might speed its way up to 3419 like it’s late for a meeting.
But if it gets shy and turns back down, don’t be surprised to see it sliding toward 3148 instead — much easier, much faster, and with way less drama.

Gold continues to rise within butterfly patternHello, guys
Long time price rising near the support line, but later it made a correction movement, breaking this line.
Then price had a sharp impulse that confirmed bullish structure and started to grow inside a rising channel.
After reaching the top boundary, the price reversed and started a pullback to the support area near $3265.
This zone also aligns with the channel base and acted as a bounce point before, making it a strong technical level.
Now the price is consolidating above this support, forming a higher low, which may confirm continuation.
As long as price holds, and I expect it to bounce from support line and push toward $3480 channel resistance.

XAUUSD BEARISH Major bearish sentiment detected by my quantitative analysis mechanisms. Price should drop to 1800. This outcome is extremely likely.

Gold and Chart Patterns I’m dropping this XAU/USD M30 insight because my system’s a damn executioner, and you need to see how I hunt the market. This chart is a textbook of bearish patterns—first a bearish three drives showing smart money exhausting buyers with three weakening upward pushes, then a head and shoulders with the neckline break confirming the reversal, and now a bearish shark forming to seal the deal, all playing out within my descending trendlines. Smart money’s been in control from the start, distributing at the peaks, grabbing liquidity, and dumping price to hunt stop-losses below key levels. Supply and demand zones are my edge—supply at the right shoulder of the head and shoulders where sellers stacked orders before the break, demand near the lower trendline where buyers might step in, my target for this bearish move. My checklist operations are a predator’s playbook. I start with harmonic patterns, hunting XABCD structures like the bearish shark I’m seeing now, signaling smart money’s reversal zones. I confirm market structure, looking for breaks of structure to show trend shifts—here, the neckline break confirms bearish continuation. I identify order blocks, those consolidation zones where smart money stacks orders, like the bearish order block at the right shoulder where sellers distributed. Volume profile is key—I check for high volume nodes where price stalls, like the neckline where sellers defended, and low volume nodes that act as magnets, like gaps below the neckline. Top-down analysis keeps me sharp—four-hour timeframe sets the bearish trend, one-hour confirms the break, thirty-minute narrows the setup, fifteen-minute is my strike zone, waiting for a neckline retest. I use Heikin Ashi for confirmation—red candles mean sell, waiting for red on the fifteen-minute at the retest. Fibonacci levels mark my targets—I focus on key extensions to set exits, like targeting the lower trendline of the channel. Gann theory adds confluence—I look for angles or retracements to align with my setups, like a Gann angle pointing to the lower trendline. MACD and RSI measure momentum—MACD’s bearish crossover and negative histogram confirm the downtrend, RSI below fifty with bearish divergence at the right shoulder seals it. Risk management is my law—I risk small to win big, stop-loss above the right shoulder, take-profit at the lower trendline, aiming for a high reward ratio. I monitor news and liquidity traps—fake spikes above the neckline are smart money’s tricks, so I stay sharp. I wait for confirmation—every piece aligns, or I walk, then I document to keep my edge razor-sharp. I’m rating this system a ten out of ten—harmonic patterns, Smart Money Concepts, volume profile, top-down analysis, and now MACD and RSI for momentum make it untouchable. I’ve fine-tuned this over six months, backtesting until it’s a weapon. I need two of you to join me at Academia—let’s hunt together.DYOR
Shieldsmine Diaries

GOLD BUY NOW!!!!Gold took out the buyside liquidity with a retest am looking forward to see price maintain stability and clear all the liquidity above 3,363 is my measure target........

XAUUSD Profit signalLast Friday, gold hit the bottom again, with a big negative line all the way to around 3270. Of course, this position is also an obvious double bottom pattern, and it is also an obvious temperature. At present, the bullish form is still there, and the support level is still strong.
The gold four-hour line continues to maintain the bottom signal. The two big positive lines at the bottom support it, and it is also an obvious double bottom rhythm. The two big positive lines start to exert force directly from below the moving average, directly breaking through the rhythm of the sky, and the positive line crushes the moving average, stepping on the moving average to pull up. This is an obvious bullish strength. The K line just falls back, and it is definitely not a U-turn. Therefore, continue to go long in the 3270 area

TP hit TP hit for today. As previously predicted, price was able to fall to my target. Now I will leave it alone and monitor it's move by the end of the day

XAUUSD: Latest Analysis Strategy SignalsThe gold market was volatile last week, with the sharp moves catching many traders off guard. After hitting an all-time high of 3,500, gold prices fell by more than 2,000 points in less than 24 hours!
After the plunge, the market stabilized slightly and towards the end of the weekend, gold prices established strong support around 3,370 points - as we discussed in last week's analysis.
At the same time, we can clearly see a bottom around 3,270 points, and at the time of writing, gold prices are testing this level again.
- Price action remains vulnerable below the 3,370 resistance level.
- The 3,270 support level looks fragile and pressure to break through is increasing.
Trading plan:
I plan to sell on rallies above 3,300 points with a target price around 3,200 points.

XAUUSD Correction is OverXAUUSD created a new HL today. Correction is over. The continuation of the trend will continue until it creates a new LH if it chooses. Otherwise, I am going to remain bullish with XAUUSD.

Gold price has stopped falling, can we buy higher?The short-term 4-hour middle track 3380 has been lost and has become a key counter-pressure point. As long as it does not stand above it again, it will maintain a downward correction. After breaking 3292 below, it will be the 66-day moving average of 3260. The 1-hour K-line is under pressure, After last night's consolidation and pull-up,plus MACD has a golden cross below the zero axis. This wave of $200 rapid decline has almost corrected most of it. If it continues downward for another wave, or with the help of bottom divergence, it will slowly brew a short-term bottom; today's gold rebound focuses on the resistance below 3340, below the extreme middle track 3356, it is still bearish if it cannot withstand the pressure, and it will start to consider bottom-fishing if the strong support 3260 or 3245 is stable;
XAUUSD A Bullish market structure with a beautiful RBR which had been respected now a liquidity which has a Demand zone just below it.

The relationship between gold, copper and the US10YFirst, can you tell me what you think the relationship between these two curves is? Clearly, these two curves have a strong negative correlation, meaning they move exactly opposite to each other. You can see in the image that their behavior is like a mirror image (from 2007 to before 2022).
You are familiar with the gold-to-copper ratio, right? Now, when this gold-to-copper ratio curve rises, it means that gold is giving better returns compared to copper. This indicates that the global economy is moving away from growth and heading toward a recession. Investors, instead of investing in production (where copper symbolizes production), choose to invest in a safe haven like gold. The opposite happens when this curve goes down.
The lower curve represents the yield on long-term U.S. bonds. When this curve is rising, it means that the supply of bonds is greater than the demand. People are selling bonds, which causes the bond yield to rise. When the curve is falling, it means people are buying bonds, which causes the bond yield to drop.
Why do these two curves move in opposite directions?
Now, let’s get to the main question. The answer to this question is simple: bonds, like gold, serve as a safe haven for investors. When the economy moves toward a recession (when gold offers better returns than copper, and the gold-to-copper ratio is rising), some investors shift towards bonds, and the yield curve drops. That’s why these two curves move in opposite directions.
To summarize the entire story: Movement toward recession = investors moving toward gold and bonds = rise in the gold-to-copper ratio and drop in bond yield curve.
Now it’s clear why these two curves move opposite to each other. The big surprise is coming👇
Since the beginning of 2022, the historical trend has changed. These two curves have started to show a positive correlation! Meaning, everything I mentioned above has gone out the window! Now, the question is: What suddenly happened? There are several analyses, but I believe what changed is that U.S. bonds are no longer a safe haven for investors, as they once were (the same fear signal I mentioned earlier). In fact, after the pandemic, the world has never been the same. This is an important development and it affects many things. I’ve addressed this topic from various perspectives before, and here’s a new angle on it.
For the past two to three years, contrary to the historical trend, investors have been buying gold but selling bonds, and these two curves have been rising together.
As you can see, the analytical situation has changed drastically compared to, say, 10 years ago, and many fundamental facts have shifted. For instance, many people expect the Federal Reserve to lower interest rates and gold to go up again, but after an initial short shock, the story will probably reverse.
#Gold #XAUUSD #HG1!

Gold 1H Bullish Setup”There was a downtrend shown with a steep blue channel where price kept falling.
• After the downtrend, price reversed and moved sideways (consolidation).
• Resistance Line: A horizontal blue line on top of the consolidation shows resistance — price touched it twice but couldn’t break higher.
• Pattern:
• After failing at resistance, price fell again.
• It seems to have found support (around the lower blue dashed lines near 3236-3227).
• Prediction/Arrow:
• The blue arrow suggests that the price is expected to move up from the current area.
• Target could be a retest of the previous resistance near 3360.
In short:
This chart shows Gold has fallen into a support zone after a previous bullish setup, and the expectation is for a bullish move (uptrend) to begin soon.

GOLD Next Movement Very Clear , Are You Ready To Got This ?Here is my new place if i will sell gold after daily closure below 3400.00 m it will be a great chance to sell it with the retest if we have a good daily closure , gold gave me today more than 1000 pips if you checked my last updates , just wait for closure and then we can sell it again .

GOLD Moving Perfectly , The Same Res Can Give Extra 500 Pips !Here is the gold chart and the price follow my analysis 100% and moving very good, the new entry +200 pips now , and the same entry point valid for re enter again tomorrow , if the price go back to retest the same place around 3400.00 it will be a good chance to re sell and targeting 500 pips .

GOLD Support Ahead! Buy!
Hello,Traders!
GOLD is making a local
Bearish correction but
It is trading in a long
Term uptrend so we
Are bullish biased and
We will be expecting
A local bullish rebound
Buy!
Comment and subscribe to help us grow!
Check out other forecasts below too!
Disclosure: I am part of Trade Nation's Influencer program and receive a monthly fee for using their TradingView charts in my analysis.

Gold’s Next Trap? Don't Blink“Gold’s Next Trap? Don't Blink. 👀💣”
📅 Daily XAUUSD Sniper Plan – April 25, 2025
Clean structure. No noise. Just logic.
🧭 MARKET CONTEXT
• Macro: No major USD catalyst. Yesterday's Unemployment Claims were neutral → price action driven by structure & liquidity.
• Sentiment: Gold remains in premium territory but failed to hold above 3355 in NY → suggesting smart money profit-taking.
• HTF Bias: Bullish (D1 trend intact, HLs hold)
• LTF Flow: Bearish intraday – CHoCH & BOS on M30-H1
• Key Event Backdrop: Powell not speaking today, but market still reflects uncertainty from recent Trump vs. Powell tensions.
📐 STRUCTURE & SMC FLOW
• M30–H1: Internal CHoCH formed after price failed to break above 3355
• Liquidity: Sweeps above 3353 and below 3312 → now hovering around internal equilibrium
• SMC Confluence: OBs, FVGs, and EMA alignment used for all entries
• FIB Zones: Discount for buys (3280–3310), Premium for sells (3385+)
🔻 SELL SCENARIOS
Sell #1 – 3385–3392
🧨 Premium retest zone + H1 OB + Gap mitigation
• SL: 3401
• TP1: 3355
• TP2: 3333
• TP3: 3306
🎯 Confluence: H1 OB, NY liquidity above, internal CHoCH
Sell #2 – 3411–3422
💣 Extended premium fill – final imbalance trap
• SL: 3432
• TP1: 3372
• TP2: 3333
• TP3: 3306
🎯 Confluence: Unmitigated FVG + fib extension 1.272 + clean wick rejection zone
🟢 BUY SCENARIOS
Buy #1 – 3333–3338
🔋 HTF OB + H4 structure demand
• SL: 3322
• TP1: 3360
• TP2: 3385
• TP3: 3410
🎯 Confluence: HTF FVG, historical bounce zone, EMA100 support
Buy #2 – 3284–3288
🧱 Sniper reentry zone from structure base
• SL: 3270
• TP1: 3312
• TP2: 3340
• TP3: 3372
🎯 Confluence: Previous sniper entry, structure HL, strong OB zone
📊 TREND RECAP
• HTF Trend: Bullish
• LTF Structure: Currently in retracement mode
• Bias: Neutral to bearish for early London, bullish only on clean 3333 reaction or deeper dip to 3284
🫂 COMMUNITY CALL
"Gold’s Next Trap? Don't Blink. 👀💣"
Will 3450 Hold? Or is Gold Just Getting Started? 🔄🧠
Which setup are you watching tomorrow? Let’s catch these sniper entries together – drop your bias in the comments 💬👇
TradingView's been too quiet lately – if this helped, hit that ❤️ and show some love.
Let’s grow this smart gold tribe together!
Smart plans, no hype. If you’re riding gold with logic, drop a 💡 below and let's connect!

DeGRAM | GOLD Slows Under Resistance📊 Technical Analysis
GOLD failed to break out above the resistance line near $3 400 and is retreating from overbought levels; low volatility signals weakening momentum and a likely pullback toward support around $3 325.
💡 Fundamental Analysis
Short-term macro drivers also tilt bearish. Rising U.S. Treasury yields are making gold less attractive, while hawkish Fed signals fueled by strong U.S. data have strengthened the dollar.
✨ Summary
Technical and fundamental factors point to a short-term bearish correction in XAUUSD.
-------------------
Share your opinion in the comments and support the idea with a like. Thanks for your support!

4/23 Gold Trading StrategyGold saw a sharp decline from 3500 to around 3360 yesterday, and our selling strategy delivered significant returns.
Over the weekend, Trump stated he has no intention to fire Powell and hinted at easing trade tensions. This quickly dampened market risk aversion, causing gold to plunge at the open today to near 3320. The downward momentum remains strong.
In this kind of market, flexibility is key. A sharp drop is usually followed by a rebound, but the strength of that rebound is what matters. Technically, the potential bounce is estimated at around $50, but whether the price continues to rise or resumes its decline will depend on how the market digests the news.
Technical levels (excluding news impact):
Key resistance: 3410–3440
Key support: 3328–3303
Considering the news:
Key resistance: 3346-3372
Key support: 3298–3268
Trading Strategy for Today:
Sell between 3410–3440
Buy between 3297–3267
Trade flexibly within 3386–3332 / 3296–3328
