DeGRAM | GOLD Held Support Level📊 Technical Analysis
Gold’s slide paused at $3 315; holding here keeps $3 500 – 3 520 in play.
💡 Fundamental Analysis
• PBoC has been buying for 5 months in a row.
• WGC expects strong demand from central banks in 2025.
• Trade wars, tensions in the Middle East and South Asia are causing risks that are increasing demand for gold.
• IMF warns new tariffs could slow growth, boosting safe-haven bids.
• Western ETFs had bought ≈240 t by mid-April.
• DXY is at 3-year lows and yields are down.
✨ Summary
Strong central-bank buying, renewed ETF inflows, softer USD yields and rising geopolitical risk align with chart support, favouring a rebound toward $3 500 – 3 520 while $3 315 holds.
-------------------
Share your opinion in the comments and support the idea with a like. Thanks for your support!
USCGC trade ideas

XAU/USD Short Term Pullback is Possible (READ CAPTION)📢As Of April 22, 2025 Gold (XAU/USD) is Exhibiting Strong Bullish movement Having recently Reached a Record high Of 3431.70 per ounce.
📌Key Levels:
✅️Resistance: Immediate resistance is observed around $3452 A breakout above this level could pave the way toward $3,485 and potentially $3,500 in the near term.
✅️Support: Support is established near $3,392. A decline below this point may lead to a correction toward the $33,74 level.
📈Market Outlook:
While the overall trend remains bullish, the overbought RSI suggests caution, as a short-term pullback is possible. So If it's decline below this point it will Drop to 3374-70
🚀Don't Forget to Support me With Your Precious Feedback 💗

How to break through the heavy pressure from above?From the analysis of the 4-hour line, today's support is around 3300-3310. If it falls back during the day, you can buy more once before rebounding. The upper short-term resistance is around 3340-3356, and the focus is on the suppression of 3380-90. The overall support is to maintain a wide range of long and short fluctuations in this range. In the middle position, watch more and move less, and follow orders cautiously, and wait patiently for key points to enter the market.
Gold operation strategy:
Gold rebounds at 3340 and goes short, rebounds at 3360 and covers short positions, stops at 3367, targets 3300-3310, and continues to hold if the position is broken;

One Step Ahead of the MarketHey guys and girls,
Look at this chart, Do you see what I see? (we are heading into a bear market).
(RSI= 86, kiss of Death) a chart is worth a thousand words!
Technical Section (a top is in place- ABC bear market):
Wave 1 = $ 850
Wave 3 = $ 1650
Wave 3 > 1.618 x length of Wave 1----> Wave 5 (Max) = 2.618 x length of Wave 1 (Target = $ 3300)
Fundamental (Bearish):
Let's look at the reasons:
a- Trump's trade war is over; as a result, there is no strong overriding trend.
b- Federal Reserve holds interest rates steady
Conclusion:
The trend is losing momentum and a top is in place.
Target = $ 2700
Invalidation level = $ 4170

XAUUSD: Massive Volatility, Weak Support at 3270!Last week was extremely volatile for Gold, with incredible swings that caught many traders off-guard. After reaching a new all-time high at 3500, the price dropped by more than 2000 pips in less than 24 hours!
After this crash, the market settled somewhat, and towards the end of the week, Gold established a strong ceiling around 3370 – exactly as we discussed in last week's analysis.
The key question now: Is the correction over or is there more downside coming?
At the same time, we can clearly observe a floor around 3270, a level that Gold is testing again at the time of writing.
Here’s why I believe the correction is not over yet:
- Price action remains vulnerable below 3370 resistance.
- The support at 3270 looks fragile, with pressure building for a break.
- Market volatility is still extremely high, favoring continuation moves.
Trading Plan:
I am looking to sell rallies above 3300, aiming for a target around 3200.
Due to the recent wild volatility, I will adjust my stop losses accordingly, allowing enough room for noise without exposing the position to unnecessary risk.
Disclosure: I am part of Trade Nation's Influencer program and receive a monthly fee for using their TradingView charts in my analyses and educational articles.

XAUUSD 1HGold Analysis
Continuing the previous analysis
The market faces a critical test at 3340.
A confirmed break and stabilization above this level would invalidate today's analysis and shift the trend bullish.
However, based on precise mathematical modeling, the expectation is clear:
The market is likely to fail in breaking above 3340, opening the way for a strong bearish move toward:
3235
3170
3130
Stay disciplined, trust the math, and move with confidence.
In a world full of uncertainty, we follow certainty.
Stay with me!

GoldXAUUSD
- Symmetrical Triangle as an corrective pattern in Short Time Frame
- Impulse correction
- Completed " 12345 " Impulsive Waves and " ABC " Corrective Waves
- Break of Structure
- Change of Characteristics

XAU/USD: All-Time High Reached with Pullback Opportunity AheadThe XAU/USD market has set a new all-time high, continuing its strong bullish trajectory toward the 3300 resistance zone. This level may act as a potential reversal point, offering a chance to enter on a pullback.
A range zone has formed around the 3225 level, which, along with the nearby upward trendline, could serve as a key support area for identifying buy signals. With high-impact news scheduled for today, volatility is expected. Should a retracement occur, the support zone around 3225 may provide a launchpad for the next move toward the resistance zone at 3390

UPDATE ON XAUUSD SELL SETUP , GOOD SHORT ENTRIES FROM $3430UPDATE ON XAUUSD SELL SETUP
$3430-$3420 another good points for short entries (SELL)
Targeting $3370-$3365 or DOWN
Its not a Financial advice

Gold - Just Half Way To The Target!Gold ( TVC:GOLD ) still has a lot more upside potential:
Click chart above to see the detailed analysis👆🏻
Over the past couple of months, we saw an almost incredible breakout rally of about +75% on Gold. However, looking at technicals, there is a quite high chance that Gold will actually rally even more and retest the next upper resistance trendline, which would mean another pump of about +75%.
Levels to watch: $4.000
Keep your long term vision,
Philip (BasicTrading)

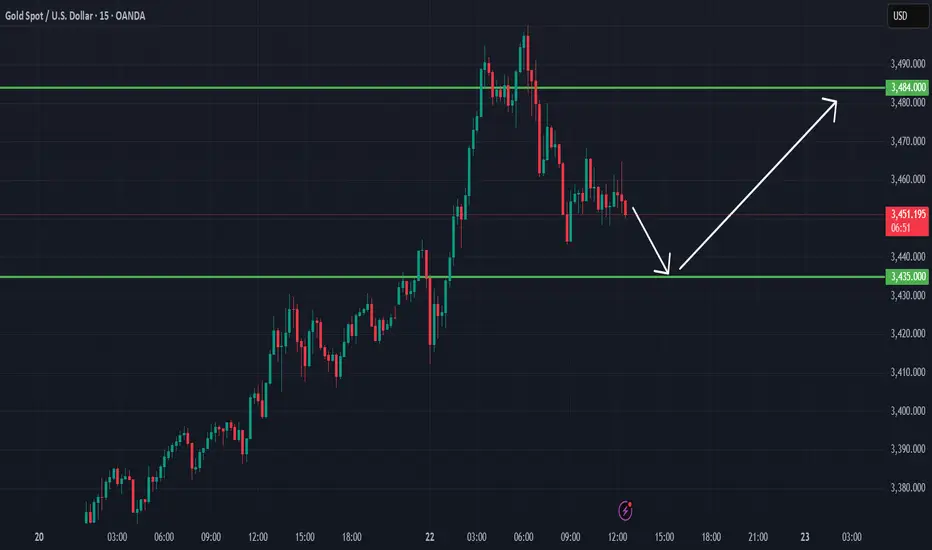
Gold Price Outlook (22nd April 2025) – Short-Term Move Expected 📉 Gold Price Outlook – Short-Term Move Expected
Gold is currently trading around $3452. We're anticipating a dip towards the $3435 area in the short term as part of a corrective move. This zone could act as a potential support level, where buyers may step in.
Following this expected pullback, we’re looking for a bounce back up toward the $3484 area, targeting a short-term bullish recovery.
📊 Key Levels to Watch:
Support Zone: $3435
Resistance Target: $3484
As always, manage your risk accordingly and watch for price action confirmation at these levels.
Gold can exit from wedge and drop to support levelHello traders, I want share with you my opinion about Gold. Price action on Gold has shown strong bullish momentum earlier, as it broke out of the previous upward channel and started forming an upward wedge. The rally gained traction once the price left the buyer zone between 3006 - 3025 points, pushing through multiple resistance levels and creating a new structure of higher highs. After the breakout from the wedge’s support line, the price continued to grow and eventually reached the upper boundary of the wedge pattern. Here, we saw a clear reaction and reversal, signaling potential exhaustion among buyers. Currently, the price is trading just below the upper wedge resistance and has already made a pullback after the latest local high. Given this structure and the fact that the wedge pattern is tightening, I expect gold to reverse again and decline toward 3270, which is my first TP. If pressure continues, the price may drop to the 3210 current support level as TP2. The reaction from the upper wedge boundary, combined with weakening momentum and a strong support area below, supports my bearish outlook for now. Please share this idea with your friends and click Boost 🚀

Gold will form a double top next week and then fall toward 2600.Gold will form a double top next week and then fall toward 2600.Of course, everything is hypothetical. If the correction trades time for space, it may not fall as much. It could consolidate sideways for a long time. In short, I think the uptrend has paused for now. If a double top forms next week, it’s a good opportunity. Let’s wait and see.

XAUUSD Gold Is Surging: Technical / Macro Analysis & Trade IdeaHey traders! Let’s break down the current price action on Gold (XAUUSD) using both Wyckoff and ICT concepts, and tie it all together with the latest macroeconomic context. 🚀✨
Wyckoff Methodology:
Looking at the 4H chart, we see a classic accumulation phase that transitioned into a strong markup. The recent price action shows a clear spring (liquidity sweep) below previous lows, followed by a sharp bullish move—this is textbook Wyckoff manipulation, where smart money grabs liquidity before driving price higher. The current rally suggests we’re in the markup phase, with demand overwhelming supply.
ICT Concepts:
Liquidity Zones: The chart shows a sweep of liquidity below the recent consolidation, trapping late sellers before a powerful bullish displacement. This is a classic ICT move—liquidity engineered and then swept.
Displacement: The large bullish candle breaking above the previous range signals a market structure shift (MSS) to the upside. This is a strong sign of bullish intent.
Fair Value Gaps (FVG): The impulsive move up has likely left a fair value gap (imbalance) between 3335 and 3385.50. Price may retrace to fill this gap before continuing higher.
Market Structure: The break above the previous swing high confirms a bullish market structure. As long as price holds above the 3335-3340 zone (50% retracement), the bullish bias remains intact.
Technical Trade Setups:
Bullish Scenario: Look for a retracement into the 50-61.8% Fibonacci zone (3335-3323) for potential long entries. If price forms a bullish rejection or bullish engulfing pattern here, it could be a high-probability setup targeting the recent high (3385.50) and the next extension at 3436.
Bearish Scenario: If price fails to hold above 3335 and closes below 3320, we could see a deeper retracement toward 3284 (100% retracement) or even lower, but this is less likely given the current momentum.
Market Sentiment:
Bullish 🟢 – The strong displacement, liquidity sweep, and market structure shift all point to bullish sentiment. Buyers are in control, and any pullbacks into the FVG or key fib levels are likely to be bought up.
Macroeconomic & Fundamental Drivers:
Gold’s rally is being fueled by several key factors:
CPI & Inflation: Recent CPI data shows persistent inflation, increasing demand for gold as an inflation hedge.
Interest Rate Expectations: The market is pricing in potential rate cuts by the Fed later this year, weakening the USD and supporting gold.
Geopolitical Tensions: Ongoing global tensions (e.g., Middle East, Ukraine) are driving safe-haven flows into gold.
USD Strength: Any signs of USD weakness further boost gold’s appeal.
Summary & Trade Plan:
Gold is in a strong bullish phase after a classic liquidity sweep and market structure shift. Watch for retracements into the 3335-3320 zone for potential long setups, with targets at 3385 and 3436. Stay alert for any macro news that could impact sentiment, but for now, the bulls are in control! 🏆📈
Disclaimer:
This is not financial advice. Always do your own research before trading.

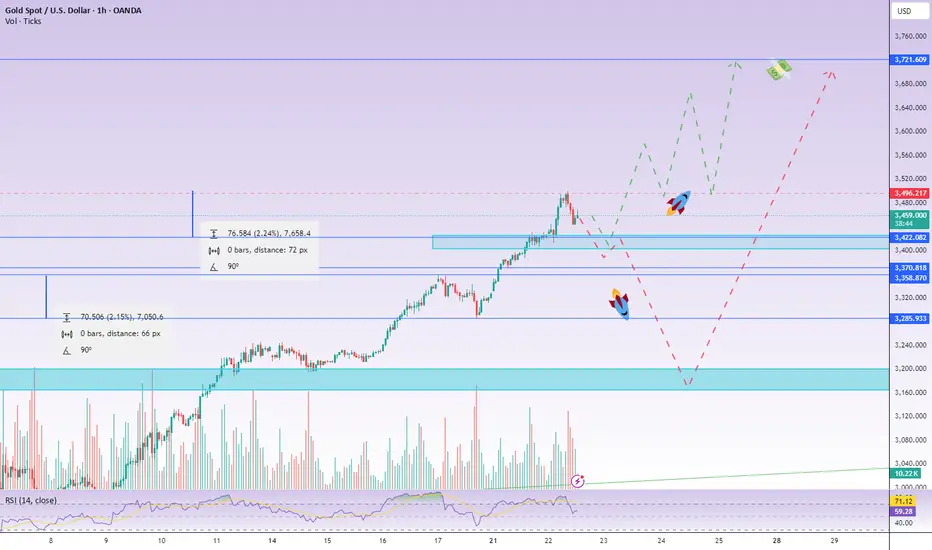
Gold’s Super Bullish Breakout – Eyeing $3700 or $3200?My previous analysis played out very well, except I was concerned that we didn't reach the $3,180 area. With the ongoing trade wars and recent comments from Powell, the USD is weakening significantly, and we’re seeing a gold move unlike any I’ve experienced before—possibly the most bullish pattern yet.
Based on my analysis from the edge of the market, we can identify key breakout levels that must hold to continue pushing toward $3,700.
Watch the 1H and 4H wick and body formations:
1. If the 1H candle body can break above $3,500, we’ll likely continue making higher highs and higher lows toward $3,700.
2. If the 1H candle body fails to hold the $3,400 level, we might see the pullback I’ve been anticipating—possibly down to the $3,200 level >> and pullback towards $3700.
Falling into range oscillation, just get the rhythm pointAnalysis of gold market trend
On Thursday, the gold price remained in the 4H channel, and the middle and lower tracks were in the range of 3370-3260, with overall resistance to decline and correction; this trend is also normal;
1: In the early stage, the market fluctuated rapidly with a hundred points rise and fall, and the kinetic energy consumption was large, so the short-term trend returned to the consolidation trend later;
2: The fundamentals stopped, the technical demand was corrected, and the two resonated, and the gold price could only fluctuate and consolidate in the range; the analysis framework given yesterday was treated according to two intervals; they were 3370-3260 and 3370-3480; the strong and weak dividing point was 3370 above and below;
We can also see that at the position of 3370, the gold price has been under pressure for 2 consecutive times and fell for 2 consecutive times; it can be seen that the strong and weak dividing point of the position above and below 3370!
At present, the market:
1: Trend: There is no trend for the time being, and the range is high, the large range is 3480-3260; the bull trend is stagnant, and the bear trend stops falling. The trend cannot be judged for the time being;
2: Fundamentals, the future fundamentals will focus on the US debt crisis, trade war tariffs, and subsequent war issues, two core things; and uncertain fundamentals
Today's market:
1: 4 hours, the stochastic indicator golden cross, the main long signal; in terms of form, slow bull rise; the current pressure position of the central axis is near 3370, and the probability of breaking upward is relatively high; therefore, the 4-hour can be treated as a shock rise; but the overall situation remains in the large range of 3480-3260!
2: In the daily K-line, the stochastic indicator diverges periodically, and the death cross is downward, which is a bearish signal; however, the high-level sell-off forms a sideways resistance to the decline, and the sideways support is in the range of 3280-3260; the MACD double-line golden cross is glued, and there is no death cross; the indicators in the daily K-line are contradictory, so the long and short trends are difficult to continue, and more range oscillations and high-level consolidation signals are given;
To sum up: Today's short message is still processed according to the 4-hour range; 3370-3260 range and 3370-3480 range; if it stabilizes at 3370, the range processing will be changed; you can take a pullback to do more, and bet on the 4-hour range oscillation upward, and gradually break through the position of 3370;

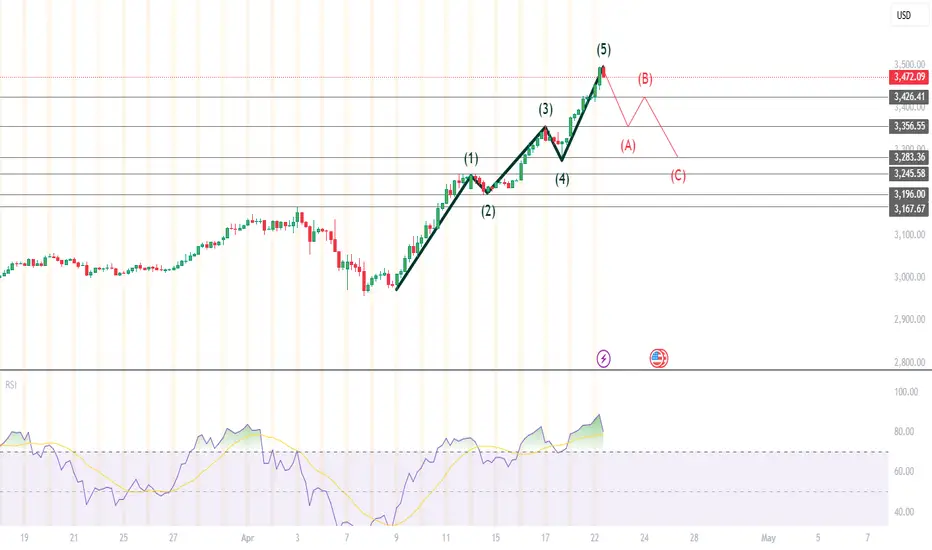
GOLD (XAU/USD) : Finally time for a correction Technical Analysis:
1.) Elliott Wave 5-wave impulse is complete.
2.) RSI is overbought (typically >70 on most platforms) — this often signals a momentum slowdown and coming reversal.
Thus,
The Market is likely about to shift into corrective mode → A-B-C pullback, as you’ve sketched.
Market Psychology:
At Wave (5) + Overbought RSI, the psychology is typically:
Retail traders rush to buy the top.
Smart money prepares to exit or short.
Trigger events (fundamental catalysts) are only needed for acceleration, not for reversal to start.
GOLD (XAUUSD): Strong Bullish Signs?!
Gold strongly corrected from 3500 psychological level.
After a test of the underlined intraday support cluster,
the market started to leave strong bullish clues.
After a false violation of the support, the price accumulated a bit
and broke a resistance line of a falling wedge pattern on an hourly time frame.
With that move, Gold also managed to confirm a local Change of Character CHoCH.
All these bullish signals indicate a highly probable continuation of a growth.
The price may move up at least to 3377 level easily.
❤️Please, support my work with like, thank you!❤️
I am part of Trade Nation's Influencer program and receive a monthly fee for using their TradingView charts in my analysis.

Best Liquidity Grab / Sweep Strategy For Trading Forex & Gold
Learn how to trade liquidity grab / sweep with multiple time frame analysis.
Discover how to combine top-down analysis and smart money concept SMC for trading forex and gold.
You will get a complete step by step trading strategy with entry, stop loss and target.
1. In order to trade liquidity grab / sweep properly, you need to find liquidity zones first.
For this trading strategy, the best liquidity zones will be on a daily time frame.
Check these 2 significant liquidity zones on EURAUD forex pair on a daily.
The zone where the selling activity concentrate will be called a supply zone. While the zone with a strong concentration of a buying activity will be a demand zone.
2. After that, you should look for a liquidity grab / sweep.
For a valid liquidity grab / sweep the daily candle should violate the liquidity zone only with the tail / wick of the candle , while the body should stay within the zone.
Above is the example of a liquidity grab of a demand zone.
While the daily candle closed within the underlined area, the wick went beyond that.
3. After you identified a liquidity grab/sweep, start analyzing lower time frames . For this strategy, the best time frames are 4H and 1H.
On these time frames, you should look for a consolidation and a formation of a horizontal range.
Here is such a range on EURAUD on a 4H.
These ranges will be used for confirmation .
Your bullish signal will be a breakout of the resistance of the range ,
it will confirm a strong buying interest after a liquidity grab.
That is the example of such a confirmation.
4. After that, set a buy limit order on a retest of a broken resistance of the range. Take profit will be the closest strong resistance, stop loss will be below the support of the range.
That is how we trade a liquidity grab/sweep of a demand zone.
With the supply zone liquidity grab trading strategy, you should wait for a bullish liquidity sweep followed by a bearish breakout of a range on a 4H / 1H time frames.
I always say to my students that a single time frame analysis is not sufficient for profitable trading SMC.
A proper combination of multiple time frames is the key to consistent profits.
Following this strategy, you should achieve up to 80% winning rate trading liquidity grabs / sweeps.
❤️Please, support my work with like, thank you!❤️
I am part of Trade Nation's Influencer program and receive a monthly fee for using their TradingView charts in my analysis.

XAUUSD Analysis todayHello traders, this is a complete multiple timeframe analysis of this pair. We see could find significant trading opportunities as per analysis upon price action confirmation we may take this trade. Smash the like button if you find value in this analysis and drop a comment if you have any questions or let me know which pair to cover in my next analysis.

Interpretation of gold short-term operation ideasAfter a surge in the morning, gold was suppressed and fell again in the afternoon and has been in a narrow range of fluctuations!
Evening operation ideas:
If the European session does not continue the Asian session's pull-up and continue to strengthen, the probability of evening fluctuations will increase. After a sharp pullback, it is not easy for gold to turn strong in the short term, so before yesterday's opening is broken, the possibility of continued pullback will increase!
Short-term suppression of the US market: 3330-35, look at a high and then fall
Support below: 3310-3300-3293
Data reference: The Federal Reserve will release the Beige Book of brokerage conditions at 2 a.m.
Trump will sign an executive order at 5 a.m.

XAUUSD 15mintue ForecastHello guys,I hope you are well let me tell you that we will sell from here now and our target will be $3280, after that our target will be $3340.

XAUUSD Gold Analysis | Weekly Update
Timeframes: 4H & Daily
Gold has continued its bullish momentum without significant seller pressure. Based on the geometry of the current move, new targets have been identified:
◾️ The 3670–3750 range is a key area to watch for a potential market reaction or pause.
◾️ The main bullish target for this rally is $4080 &4350
High-precision analysis, extraordinary results!
