Market Analysis: Gold Dips FurtherMarket Analysis: Gold Dips Further
Gold price started a fresh decline below $3,300.
Important Takeaways for Gold Price Analysis Today
- Gold price climbed higher towards the $3,350 zone before there was a sharp decline against the US Dollar.
- A key bearish trend line is forming with resistance near $3,270 on the hourly chart of gold at FXOpen.
Gold Price Technical Analysis
On the hourly chart of Gold at FXOpen, the price climbed above the $3,250 resistance. The price even spiked above $3,300 before the bears appeared.
A high was formed near $3,352 before there was a fresh decline. There was a move below the $3,300 support level. The bears even pushed the price below the $3,250 support and the 50-hour simple moving average.
It tested the $3,200 zone. A low has formed near $3,203 and the price is now showing bearish signs. There was a minor recovery wave above the 23.6% Fib retracement level of the downward move from the $3,352 swing high to the $3,203 low.
However, the bears are active below $3,270. Immediate resistance is near $3,270. There is also a key bearish trend line forming with resistance near $3,270.
The next major resistance is near the $3,295 zone and the 61.8% Fib retracement level of the downward move from the $3,352 swing high to the $3,203 low. The main resistance could be $3,352, above which the price could test the $3,400 resistance. The next major resistance is $3,500.
An upside break above the $3,500 resistance could send Gold price toward $3,550. Any more gains may perhaps set the pace for an increase toward the $3,620 level.
Initial support on the downside is near the $3,240 level. The first major support is near the $3,225 level. If there is a downside break below the $3,225 support, the price might decline further. In the stated case, the price might drop toward the $3,205 support.
This article represents the opinion of the Companies operating under the FXOpen brand only. It is not to be construed as an offer, solicitation, or recommendation with respect to products and services provided by the Companies operating under the FXOpen brand, nor is it to be considered financial advice.
USCGC trade ideas

The bull market ends and gold continues to fallGold is currently trading around $3310, facing strong resistance near the )$3320–$3330) zone after a sharp upward move. I am supporting a SELL bias, anticipating a potential rejection from resistance and a move to the downside.
📈Key Resistance:$3330 A key level where I expect sellers to step in.
📈Major Resistance Zone: $3330–$3340 – If broken, further upside is possible, but this zone remains a strong barrier for now.
📉Bearish Targets:
📉Target 1: $3290 Initial support and short-term profit zone.
📉Target 2: $3264 Deeper pullback level.
📉Target 3: $3242 Final target before reaching major demand.
📉Support Area: $3220 $3210
A high-probability demand zone where buyers may defend the level and sellers could take profit.
📊Outlook: I remain bearish as long as price holds below $3330. A clear rejection from this area would strengthen the bearish case. A break above $3340 would invalidate the setup and shift focus to the bullish side.
I know that many people are losing their accounts or opinions due to the sudden rise and fall of their accounts. If you are a novice or you need some free professional advice, please contact me. I hope to help you.

"Gold Ain’t Done Yet – Snipers Don’t Sleep, They Wait After a clean CHoCH from 3205 and bullish NY session push, Gold is currently hovering around 3239 ahead of major macro catalysts tomorrow (May 2):
💼 News to Watch:
NFP (133K vs. 228K prev)
Unemployment Rate
Average Hourly Earnings All releasing between 15:30–17:00 UTC+2, potentially fueling a volatility storm.
We remain in a broader retracement phase after April highs (ATH 3500), with price still sitting in higher timeframe discount zones and internal bullish signs building. However, supply above is unmitigated and could cap rallies.
🔁 MARKET STRUCTURE
Price is currently at 3239, just above a valid H1–H4 support zone.
Clean CHoCH confirmed from 3205
Liquidity still resting both above 3284 and below 3172
🔽 BUY SCENARIOS (From Discount + Liquidity Areas)
🟢 Buy #1 – 3205–3212
🔹 H1 CHoCH zone + internal FVG
🔹 Sell-side liquidity just swept
🔹 Entry if price retests post-NFP drop
⚠️ Ideal for short-term bounce or reaccumulation into 3260
🟢 Buy #2 – 3172–3185
🔹 H4 OB + sweep zone + EQ
🔹 Heavy stop cluster under 3200
🔹 If broken, becomes invalid → eyes move to 3120
🔸 High-risk/reward reversal zone if NFP panic spikes below
🔼 SELL SCENARIOS (From Premium + Imbalance Zones)
🔴 Sell #1 – 3284–3295
🔹 H1–H4 supply + FVG + internal BOS
🔹 Buy-side liquidity just above 3280
🔹 Classic pre-news pump & dump zone
⚠️ Watch for wicks above 3288 → sniper sell trigger
🔴 Sell #2 – 3325–3333
🔹 HTF OB shelf + imbalance + previous NY rejection
🔹 Final retail breakout trap before larger drop
🔹 Cleanest R:R setup if NFP drives price explosively upward
👀 Eyes On:
Zone Reaction Type What to Watch
3220–3235 Bounce or trap Current zone = fragile intraday demand
3284–3295 Rejection or flip Cleanest NY pump trap zone
3172–3185 Final support Below = invalidates bullish scenario short-term
3325–3333 Bull trap zone If reached = extreme precision sell only
🎯 Bias:
LTF: Bullish retrace valid above 3212
HTF: Still bearish under 3330
Macro: Wait-and-react on NFP → NO prediction
📣 Final Note for GoldMinds:
This is not a prediction plan.
It’s a reaction plan.
We mapped the real zones.
Now let the volatility reveal which liquidity gets hit first.
💬 Drop a 🧠 if you’ve evolved past “buy now / sell now” noise.
Let’s hunt like pros — not guess like rookies.

Gold will close its gapIn coding gold has turned bearish with the formation of Lower Low and rejection of resistance, we predict that the next gold target is to close the gap.
SL: 3280 (245 pips)
TP: 3174
TP Final: 3160

Gold operation strategyFrom the 4-hour analysis, the support below is around 3300-08. If it does not break, continue to be bullish. Pay attention to the short-term suppression of 3360-66 above. If the daily level stabilizes above this position, continue to maintain the low-multiple rhythm.
Gold operation strategy:
1. Go long when gold falls back to 3320-25, and cover long positions when it falls back to 3300-10, stop loss 3297, target 3355-3360, and continue to hold if it breaks;

XAU/USD For Bullishwait for pull-back near by entry point and then go long
general trend is up trend
have fun :)

DXY, BTCUSD, USDJPY, XAGUSD & XAUUSD Daily Trade SetupsIn this update we review the recent price action in the Dollar, Bitcoin, Yen, Silver & Gold and identify the next high probability trading setups and price targets. To review today's video analysis click here!

Latest gold operation analysisFrom the daily level, the current price resistance is in the 3310 area, which is the key watershed of the band trend. If the price is below this position, the subsequent band will be shorted. At the same time, for the short-term four-hour price resistance, it is in the 3253 range. The gains and losses of this position determine the key to the short-term trend. The price will consolidate up and down at this position in the short term. Pay attention to the support of this position and further test the daily resistance area before looking at the pressure.

Has Gold's Rally Ended?In 2025, gold experienced an unprecedented surge, marking its best quarterly performance in history with gains exceeding 17% in Q1. The second quarter of 2025 began with further gains, reaching a new all-time high at $3,500.110 per ounce.
Several economic and political factors contributed to the rise in global demand for gold as a safe haven asset amid fears of a potential economic recession, inflation, and a looming trade war.
The recent pullback in gold prices has been somewhat driven by optimistic expectations regarding U.S.-China negotiations and the U.S. president's decision to reduce some tariffs, including those on automobiles.
Technical Outlook for Gold:
The latest declines in gold prices have brought some bearish signals, suggesting a shift from an uptrend to a downtrend. After rising approximately 14%, gold pulled back and broke below its most recent higher low, closing a daily candle below the $3,260.65 level, an indication of a potential trend reversal from bullish to bearish.
However, the Relative Strength Index (RSI) has not yet broken below the 50 mark, despite the recent price drop, which maintains the possibility for a rebound and suggests that the market hasn't entered full bearish momentum.
The $3,436.042 level serves as a key resistance area where selling pressure may emerge, potentially pushing prices down to target $3,265.100 as the first support level.
On the other hand, if the price breaks above $3,500.110 and posts a daily close above it, the bearish scenario would be invalidated.
From a fundamental perspective, gold’s continued decline is closely tied to developments in U.S.-China trade talks. Any positive signs of reaching an agreement or further tariff reductions could weigh negatively on gold prices.

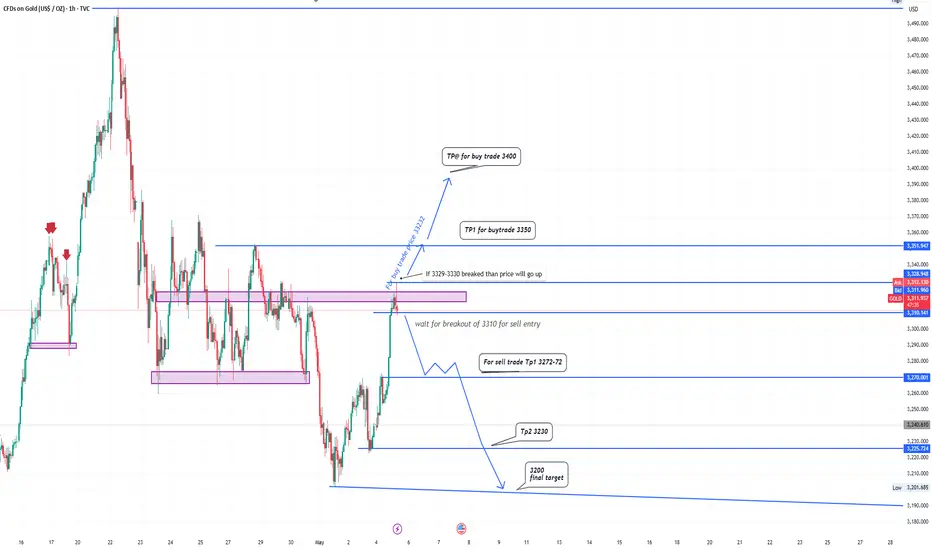
Quick setup on XAUUSD current scenario> The chart shows a consolidation area near 3310–3330, which is a key resistance zone.
> Price recently made a sharp bullish move into that resistance, now testing the zone.
> Several historical rejections (red arrows) align with this level, reinforcing it as a decision point.
:Bullish Scenario (Buy Plan):
Entry Trigger:
If 3329–3330 is broken with confirmation (i.e., retest or strong close above).
Targets:
TP1: 3350
TP2: 3400
Note:
Confirmation might be a retest of 3322, labeled as "buy trap price", which could serve as new support.
Bearish Scenario (Sell Plan):
✅ Entry Trigger:
Wait for a clean break below 3310, which has held as a support.
🎯 Targets:
TP1: 3272–3270
TP2: 3230
Final Target: 3200
🔹 Bearish Flow:
The projected price path is a stair-step decline, suggesting pullbacks before continuation downward.
Summary & Trade Logic:
Bias Condition Entry Level Take Profits
Bullish Break & hold above 3330 Above 3330 (ideally 3329–3330) 3350, 3400
Bearish Break below 3310 Below 3310 3272–70, 3230, 3200
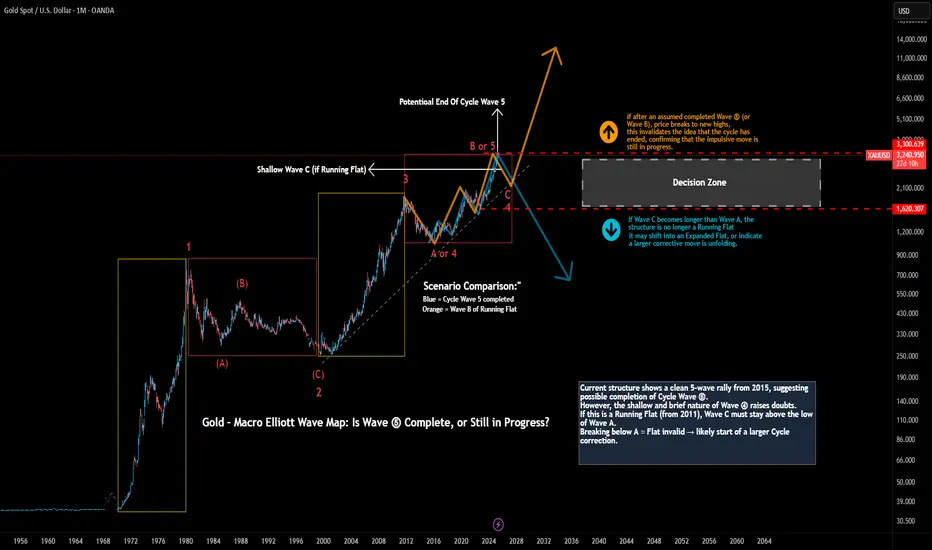
Gold Macro Elliott Wave Analysis – Is Cycle Wave ⑤ Already Done?This analysis presents a long-term Elliott Wave interpretation of gold from the 1970s to the present, focusing on the macro cycle structure.
We are currently facing a major inflection point, where two valid scenarios emerge:
Scenario 1 – Cycle Wave ⑤ Completed:
A clear 5-wave impulse from the 2015 low is visible, with Wave (5) extending to the 2.618 extension of Wave (1). This aligns well with typical Fibonacci proportions.
If this is correct, a multi-year correction may now begin, marking the end of the long-term bullish cycle.
Scenario 2 – Still in a Running Flat:
Alternatively, the entire structure since 2011 may still be part of a Running Flat correction:
Wave A: 2011–2015
Wave B: 2015–2024 (currently near 2.0 × A, which is extreme but still technically possible)
Wave C: Yet to come (expected to be shallow and brief if this scenario holds)
Key Decision Point:
If Wave C drops below the low of Wave A, the Running Flat scenario fails — and we may be seeing the start of a larger degree correction.
On the other hand, if price continues higher and breaks the assumed Wave (5) top, it may indicate the impulsive move is still in progress and the current count must be re-evaluated.
Let me know your thoughts — which scenario do you favor?
Is this the end of a decades-long cycle? Or are we still preparing for the final rally?
#Gold #XAUUSD #ElliottWave #WaveAnalysis #TechnicalAnalysis
#MacroTrends #Commodities #Wave5 #RunningFlat #TradingView
#CycleAnalysis #PriceAction #MarketStructure #GoldForecast
Sideway range, gold price accumulates below 3302⭐️GOLDEN INFORMATION:
Gold price (XAU/USD) kicked off the week on a positive note, rising toward the $3,271 level during Monday’s Asian session as a blend of geopolitical and economic concerns fueled demand for the safe-haven asset. The prolonged Russia-Ukraine conflict, coupled with renewed tensions in the Middle East, continues to elevate global risk sentiment. Meanwhile, lingering uncertainty surrounding US President Donald Trump's tariff agenda has added to investor caution, further supporting the appeal of gold as a hedge in times of instability.
⭐️Personal comments NOVA:
Gold price continues to accumulate, low amplitude at the beginning of the week, waiting for the most important interest rate information this week
⭐️SET UP GOLD PRICE:
🔥SELL GOLD zone : 3302- 3304 SL 3309
TP1: $3290
TP2: $3280
TP3: $3270
🔥BUY GOLD zone: $3204 - $3206 SL $3199
TP1: $3215
TP2: $3224
TP3: $3240
⭐️Technical analysis:
Based on technical indicators EMA 34, EMA89 and support resistance areas to set up a reasonable SELL order.
⭐️NOTE:
Note: Nova wishes traders to manage their capital well
- take the number of lots that match your capital
- Takeprofit equal to 4-6% of capital account
- Stoplose equal to 2-3% of capital account

Downtrend - will gold price return to 3233?⭐️GOLDEN INFORMATION:
Gold price (XAU/USD) rebounded from an early Asian session drop to a multi-day low, reclaiming ground above the $3,300 psychological level in the past hour. The precious metal continues to draw support from persistent geopolitical uncertainties, including the Russia-Ukraine conflict, intensifying tensions in the Middle East, and renewed friction along the India-Pakistan border. That said, the upside appears constrained by improving risk sentiment, driven by renewed optimism surrounding a US-UK trade agreement and the launch of US-China tariff negotiations over the weekend.
⭐️Personal comments NOVA:
Gold prices are under great selling pressure as trade negotiations on tariffs are becoming more active. They may return to the 323x price zone and continue to accumulate.
⭐️SET UP GOLD PRICE:
🔥SELL GOLD zone : 3351- 3353 SL 3358
TP1: $3340
TP2: $3330
TP3: $3320
🔥BUY GOLD zone: $3232 - $3234 SL $3227
TP1: $3245
TP2: $3260
TP3: $3270
⭐️Technical analysis:
Based on technical indicators EMA 34, EMA89 and support resistance areas to set up a reasonable sell order.
⭐️NOTE:
Note: Nova wishes traders to manage their capital well
- take the number of lots that match your capital
- Takeprofit equal to 4-6% of capital account
- Stoplose equal to 2-3% of capital account

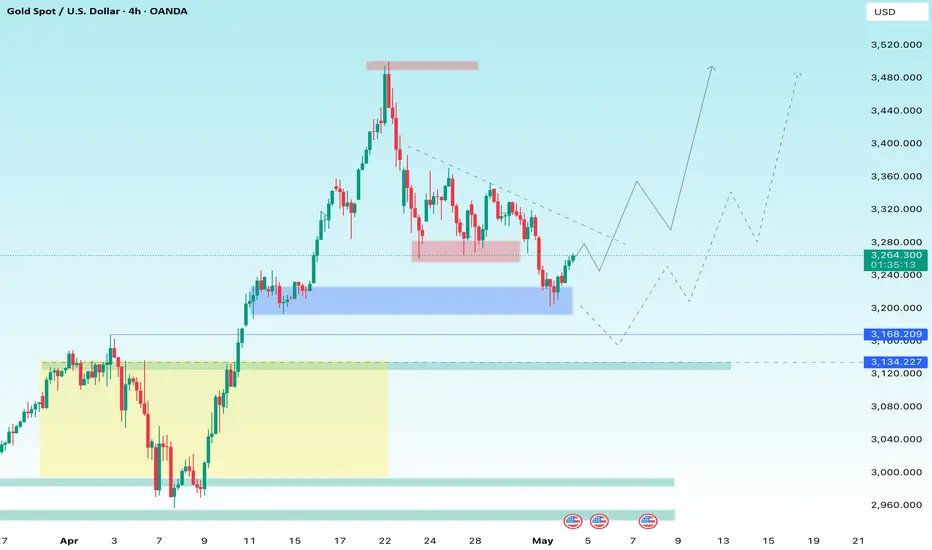
“Gold Poised for a Big Move Ahead of NFP – Reversal or BreakdownGold (XAU/USD) is approaching a major decision zone just before the highly anticipated NFP release. Price is reacting from a strong demand area (3,240–3,200), hinting at potential upside if momentum builds. A break above the descending trendline could fuel a rally toward 3,320 and 3,480.
However, a negative reaction to NFP might push gold down to test the deeper 3,168–3,134 support zone before bouncing.
This setup aligns perfectly with high-impact news – Follow for live updates and smart trade ideas during NFP!
GoldXAUUSD
- Symmetrical Triangle as an corrective pattern in Short Time Frame
- Break of Structure
- S / R Level
- Completed " 123 - abc " Impulsive Waves
- Fibonacci Level - 50.00% / 61.80%

GOLD SELL SETUP
To determine the reason behind selling gold at $3263:$3264, let's examine current market conditions and possible factors influencing this decision.
*Possible Reasons:*
- *Resistance Level*: $3263:$3264 might be acting as a resistance level, where gold prices face selling pressure or struggle to break through. This level could be influenced by historical price movements or technical indicators.
- *Profit-Taking*: Investors might be selling gold at this price range to secure profits, especially after recent gains. This decision could be driven by market volatility or shifts in sentiment.
- *Market Sentiment*: Changes in market sentiment, driven by news or economic data, can impact gold prices. If sentiment is bearish, traders might be more inclined to sell at $3263:$3264.


XAUUSD SIGNAL READ THE CAPTAINXauusd signal technical analysis satup 👇🏼
( Xauusd ) Sell zone
( TRADE SATUP)
ENTRY POINT (3366) to (3368) ✅
FIRST TP (3360)✅
2ND TARGET (3354) ✅
LAST TARGET (3345) ✅
STOP LOOS (3374)❌
FALLOW RISK MANAGEMENT ✅✅

Gold: The Start Of The C Wave (Extreme Danger!)After the FED announces their business Gold (XAUUSD) is likely to crash-down and hard.
I will support my statement with data coming from this chart.
The crash doesn't necessarily need to happen instantly. My idea is that we are witnessing a classic ABC correction in Elliott Wave Theory terminology. Let's dive in.
» Trading volume peaked in early April and has been dropping considerably.
» The ATH session ended as a very strong bearish (reversal) signal.
» There is a strong bearish divergence with the RSI. The RSI peaked February 2025 while Gold (XAU) peaked recently. Here is the chart:
Currently, Gold is showing a bounce until the resumption of the corrective bearish move.
Gold is set to move lower based on my interpretation of this chart. Approach with caution, or, go SHORT. You can't go wrong by shorting the top/resistance. Sell at resistance, buy at support.
Namaste.

GOLD XAUUSDCurrently has shown high support around 3200. we believe it can retest 3200 once again. Best buying opportunity are around 3200 and 3175.
write me any questions in the comment below. I will answer

Gold price analysis May 6Due to the impact of world economic and political tensions. The gold candle has reversed to increase again with the D1 candle increasing by nearly 100 prices.
The gold uptrend has formed and it is easier to trade to find entry zones. Today's beautiful Buy zone is noticed in the price retests to the Break out zone. 3328 is considered a buying opportunity today. Currently, gold is sideways in the 3372 and 3354 range. Watch for a breakout to trade the breakout and wait for the main entry zone. When gold increases, it will encounter barriers or targets for buy orders at 3410. Today is a day without much important news, so the 3410 and 3328 ranges are considered strong. If it breaks through this range, pay attention to the quite far range around 3445 and 3270

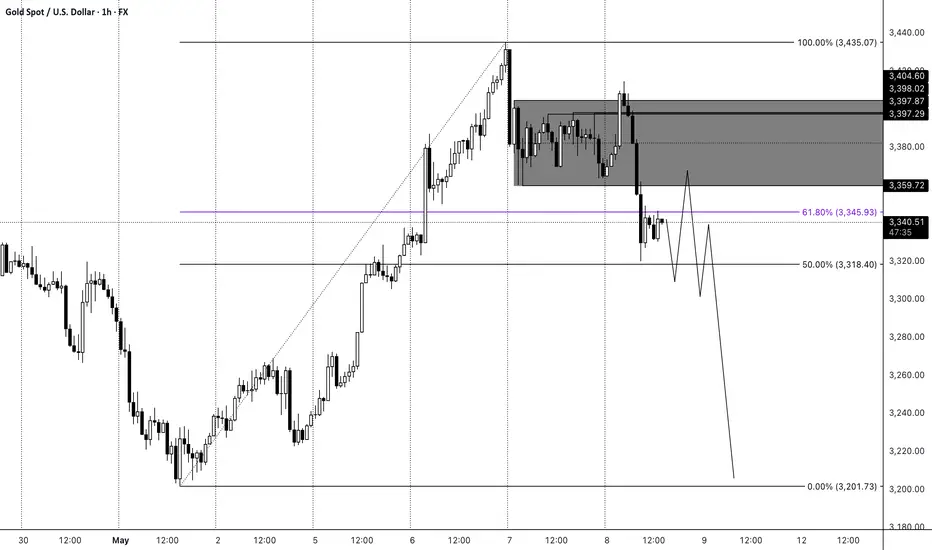
Gold Narrative OverviewGold remains in a long-term and medium-term uptrend, while currently showing signs of a short-term pullback. Given this context, the most logical stance is to continue looking for buying opportunities. However, price has reached rather extreme levels after a sharp and uninterrupted rally in recent weeks. That’s why I lean toward the expectation of at least a temporary pause followed by a downside correction and the formation of a consolidation phase.
On the local timeframe, I anticipate that the price may continue to move lower through a consolidation, targeting the previous support level around 3,201. While short-term bullish impulses are still possible, I expect the broader move to be downward. This bearish setup would be invalidated if the price breaks above 3,380.
Gold another shortShort from 3350$ .
i think gold will keep going down .
It is time for crypto to take the momentum
