IMX ELLIOT Correction Short TermIMX made the elliot 1-2-3-4-5 movement, and now time for the ABC correction. Also its been moving in the channel since 3 november, i think it will follow the channel and go for the resistence now.(A point)
IMXUSDT trade ideas

IMX: Resistance BreakoutTrade setup : After a brief consolidation phase around the $1.25 resistance price has broken above it to signal continuation of uptrend, with upside potential to $1.55 next.
Trend : Uptrend across all time horizons (Short- Medium- and Long-Term).
Momentum is Bullish (MACD Line is above MACD Signal Line and RSI is above 55).
Support and Resistance : Nearest Support Zone is $0.80 (previous resistance), then $0.55. The nearest Resistance Zone is $1.25, which it broke, then $1.55.

IMX/USDTCRYPTOCAP:IMX I am up 38% in this spot trade, I have taken full profits and I will will trade with 50% of my profits on the breakout!
I will give you some alpha when I set my alerts I do not just set it on the green line and wait for the breakout, it can be a little too late then, what I do is I make another trend line under it and put an alert on there, as you can see the orange line I have drawn is my alert ready to see how we react, if we get rejected by resistance or if we flip it, drawing under it gives me enough time to analyse and make my decision accordingly.

Imxusdt ,,, Triangle pattern In this 30-minute time chart, we see a nested triangle pattern, which can either go down or up, but it is more likely to go up because One can see the divergence in ( RSI ), which can grow as soon as the trend line breaks. and continue to climb

Imxusdt , technical analysis In this chart we see a triangle, triangles have very interesting rules and show the exit up or down, now the exit from my hypothetical triangle has been up, it can still go along with the swing.

✴️ Immutable X Double Bottom + Next Target 145%-193% + AltcoinsWe are seeing many double bottom patterns showing up, so this pattern can be used now with good accuracy.
When you see an Altcoin forming a double bottom at a higher or lower low, you know that a bullish breakout comes next.
Immutable X (IMXUSDT) is already moving, quite strong to be honest but many Altcoins are still trading near support.
These other Altcoins are yet to move up but here we can see what is coming to those charts.
These Altcoins produced a low late 2022, November/December.
The next move was a strong bullish wave early 2023 followed by a strong correction.
This correction ends either in a higher low, as is the case here with IMXUSDT, or a lower low; Higher or lower low makes no difference. After the correction prices move up.
We have many Altcoins breaking bullish, growing 2-3 digits daily and many others waiting for their turn.
What we see here will continue to happen for many weeks, the strongest bullish wave of 2023.
Enjoy the profits.
Maximize profits.
After this current bullish wave we get another correction, the pre-halving (Bitcoin) correction, followed by a full blown bull-market, that's 2024.
If you are reading this you have great timing.
Thanks a lot for your continued support.
Namaste.

IMX ANALYSIS (1D)The IMX symbol appears to be inside a large diametric pattern. It is not far to expect that it will be inside a diametric. In the last few years, all altcoins have been in complex correction.
For branch F, it can jump up to the red box and then be rejected downwards
For risk management, please don't forget stop loss and capital management
Comment if you have any questions
Thank You

#IMXThe hourly time is pulling back to the broken resistance, which can continue to grow up to the specified areas and retest the resistance again.

IMX "Unlocking Potential: The Perfect Entry Point for Profits **Short Fundamental:**
Immutable X (IMX) is a layer-2 scaling solution for Ethereum that is designed to enable gas-free trading of NFTs. IMX is built on top of StarkWare's STARK technology, which allows for thousands of transactions to be bundled together and processed off-chain, before being finalized on the Ethereum mainnet. This significantly reduces the cost and transaction time associated with trading NFTs on the Ethereum blockchain.
**Recent News:**
* On November 3, 2023, Immutable X announced that it had raised $200 million in a Series C funding round led by Temasek. This brings the total amount of funding raised by Immutable X to over $450 million.
* On November 2, 2023, Immutable X announced that it had partnered with GameStop to launch a new NFT marketplace for video games. The marketplace is expected to launch in early 2023.
* On October 31, 2023, Immutable X announced that it had integrated with MoonPay, a fiat-to-crypto onramp provider. This allows users to purchase IMX tokens directly with fiat currency, such as USD and EUR.
**Disclaimer:**
This article is not financial advice. Please do your own research before investing in any cryptocurrency.

ImmutableX (IMX) Continued Growth Despite Market Behaviours
Unlike other altcoins, the momentum on the IMX chart hasn't been as pronounced, presenting an opportunity for substantial future growth. Since October 19, the asset has increased by 30%, a relatively modest gain compared to other alternative cryptocurrencies.
At present, the IMX price is caught between a support zone of $0.608 and $0.632. If the uptrend continues, IMX's price could potentially reach $0.725 and $0.766, levels that were hit during ImmutableX’s surge on September 21.
Should the BTC chart depict a downturn, IMX could retest the support zone at $0.560-$0.580, as well as the $0.545 level. These marks may need to be tested as a technical correction before any further increase.


IMXUSDT's Risk-Reward Potential for Sellers⚪IMXUSDT has demonstrated prolonged respect for the supply zone, affirming the endurance of the long-term downtrend.
⚪This suggests a potential continuation of the price decline.
⚪The current upside pullback, though, presents an appealing risk-reward opportunity for sellers. 📉👀
Trade setup already shared in our channel!

IMX/USDT planning for bullish move? 👀 🚀 IMX Today analysis💎Paradisers, IMXUSDT! We've observed a compelling shift as it breaks free from its descending channel, setting the stage for a potential bullish surge.
💎 For quite some time, IMX has been tracing the contours of a descending channel. However, in the shorter time frame (LTF), it has successfully breached this channel.
💎 We're confident in its potential to embark on a bullish trajectory and challenge the overhead bearish OB. Additionally, its current positioning within the demand zone amplifies the bullish outlook.
💎 However, always be prepared: if the price dips below the pivotal support zone, we might see a pronounced bearish downturn.
💎 Remember to employ prudent trading strategies and use proper stop-loss measures! Stay alert to market movements and look forward to more insight

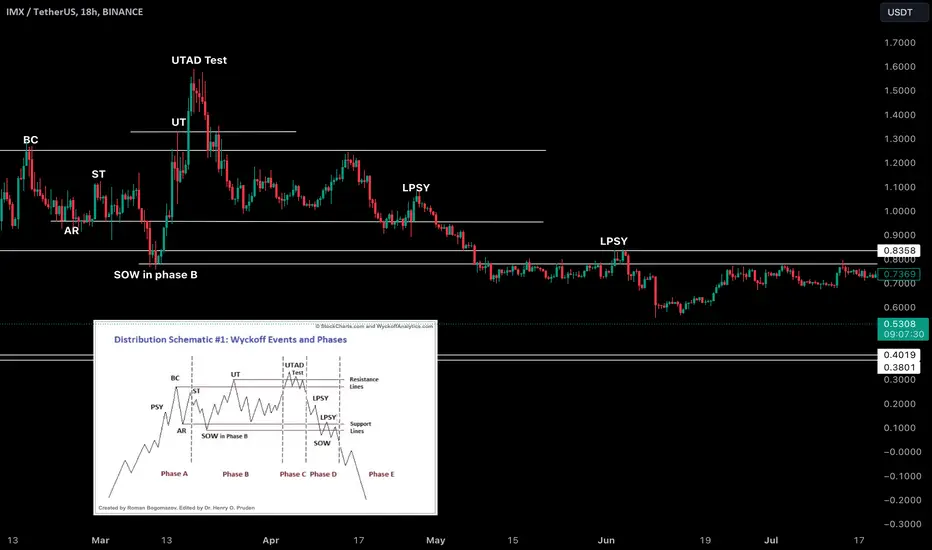
Is IMX in a Wyckoff distributionWas just playing around with IMX and looked to be in a Wyckoff distribution.
This is just some playing around and looking at the Wyckoff schematic.
Personally I think most coins are in distribution just now.
See what you guys think
IMX Next Support & ResistanceIMX Next Support & Resistance
0.436424484
0.557572987
0.669045101
0.744555462
0.845145345
0.957650251

IMXUSDT-IN BULLISH TRENDIMXUSDT is in a bullish trend and is making a series of HHs and HLs, bulls take the price from exact support with a strong upward direction, what do you think about this? let me know.

Wait for a breakout | Long BiasChart 1H TF
After pullback and created accumulating phase then bounce back from 0.56
Now, it's trading at 0.587x
If IMX can break and close above Resistance at 0.59 I expect the new bull run for IMX go up to at least 0.64 and higher
Wait and see

IMXUSDTIMXUSDT is trading in fine bullish trend and maintaining well the bullish trendline.
Whenever the price retest the bullish trendline buyers are attacking aggressively, which can be seen from the chart.
Currently the price is retracing to the inclining trendline and again it is being expected that the bulls are ready to attack.
if bulls take the charge this time too the next target could be 0.6550

IMXUSDTThere is no Divergence Formed.
There is a Bearish Flag Which gives a signal to the continuation of Trend.
Important Support Levels are marked on the Chart.

Brief Analysis——IMXIMX saw a significant rise last week, but the it turned negative in the following days.
IMX is a token developed by the project Immutable X. Immutable X is a Layer-2 solution built on the Ethereum blockchain, aimed at addressing issues such as high transaction fees and transaction speed delays, especially in the NFT (Non-Fungible Token) space. During the rise in September, the project did not release any good news. The rapid rise in price was mainly driven by the exchange Upbit in South Korean.
We can see the same situation on IMX as previously for many other tokens via the WTA indicator. But this time the whale's action was clearer.
First, in the green rectangle, we can see that whales began to flow into IMX while the price remained volatile. Although the blue column representing the whale is not obvious after being compressed, whales have participated in the transaction for four consecutive days. This is a bottom-buying behavior before pulling up. After that, the long green candle appeared and the price increased by almost 35%. On most other tokens, when whales outflow, participation will decline or even disappear, and price will continue to fluctuate to help whales reap profits. But for IMX, we can clearly see that when the long red candle appears, the blue column does not have disappeared, and whales participate in the transaction, which shows that whales are urgent to close long positions. After such a situation occurs, most gains will be given back in the future.
We can see that IMX has rebounded in recent hours, but on the WTA indicator, only retail investors are participating in transactions. Judging from the performance of whales closing long positions last week, the decline may not be over after losing the support of whales.
Disclaimer: Nothing in the script constitutes investment advice. The script objectively expounded the market situation and should not be construed as an offer to sell or an invitation to buy any cryptocurrencies.
Any decisions made based on the information contained in the script are your sole responsibility. Any investments made or to be made shall be with your independent analyses based on your financial situation and objectives.

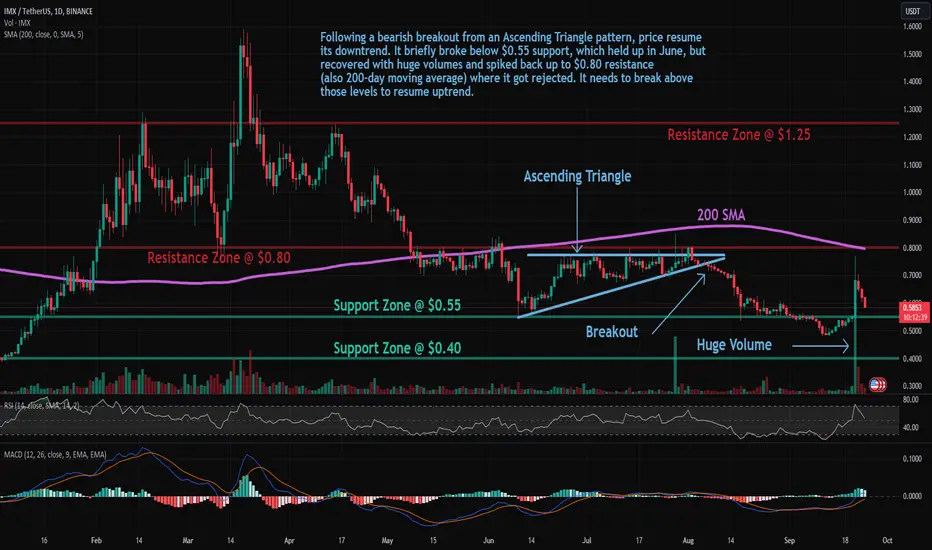
IMX: Approaching SupportTrade setup : Following a bearish breakout from an Ascending Triangle pattern, price resume its downtrend. It briefly broke below $0.55 support, which held up in June, but recovered with huge volumes and spiked back up to $0.80 resistance (also 200-day moving average) where it got rejected. It needs to break above those levels to resume uptrend.
Trend : Uptrend on Short-Term basis and Downtrend on Medium- and Long-Term basis.
Momentum is Mixed as MACD Line is above MACD Signal Line (Bullish) but RSI ~ 50 (Neutral).
Support and Resistance : Nearest Support Zone is $0.55, then $0.40. The nearest Resistance Zone is $0.80, then $1.25.
Wyckoff Accumulation SchematicIdentified this early as it was developing and continued adjusting and watching to see the elements of the schematic get formed. Was able to quickly determine that price would break UP out of this accumulatyion range and able to set purchase orders on the retest of the SOS

$imx potential buy TRADECRYPTOCAP:IMX 🎯 pumped and rejected from daily bearish OB
I will be BUY in green zone ( bullish OB ).
