Brief Analysis——IMXIMX saw a significant rise last week, but the it turned negative in the following days.
IMX is a token developed by the project Immutable X. Immutable X is a Layer-2 solution built on the Ethereum blockchain, aimed at addressing issues such as high transaction fees and transaction speed delays, especially in the NFT (Non-Fungible Token) space. During the rise in September, the project did not release any good news. The rapid rise in price was mainly driven by the exchange Upbit in South Korean.
We can see the same situation on IMX as previously for many other tokens via the WTA indicator. But this time the whale's action was clearer.
First, in the green rectangle, we can see that whales began to flow into IMX while the price remained volatile. Although the blue column representing the whale is not obvious after being compressed, whales have participated in the transaction for four consecutive days. This is a bottom-buying behavior before pulling up. After that, the long green candle appeared and the price increased by almost 35%. On most other tokens, when whales outflow, participation will decline or even disappear, and price will continue to fluctuate to help whales reap profits. But for IMX, we can clearly see that when the long red candle appears, the blue column does not have disappeared, and whales participate in the transaction, which shows that whales are urgent to close long positions. After such a situation occurs, most gains will be given back in the future.
We can see that IMX has rebounded in recent hours, but on the WTA indicator, only retail investors are participating in transactions. Judging from the performance of whales closing long positions last week, the decline may not be over after losing the support of whales.
Disclaimer: Nothing in the script constitutes investment advice. The script objectively expounded the market situation and should not be construed as an offer to sell or an invitation to buy any cryptocurrencies.
Any decisions made based on the information contained in the script are your sole responsibility. Any investments made or to be made shall be with your independent analyses based on your financial situation and objectives.
IMXUSDT trade ideas

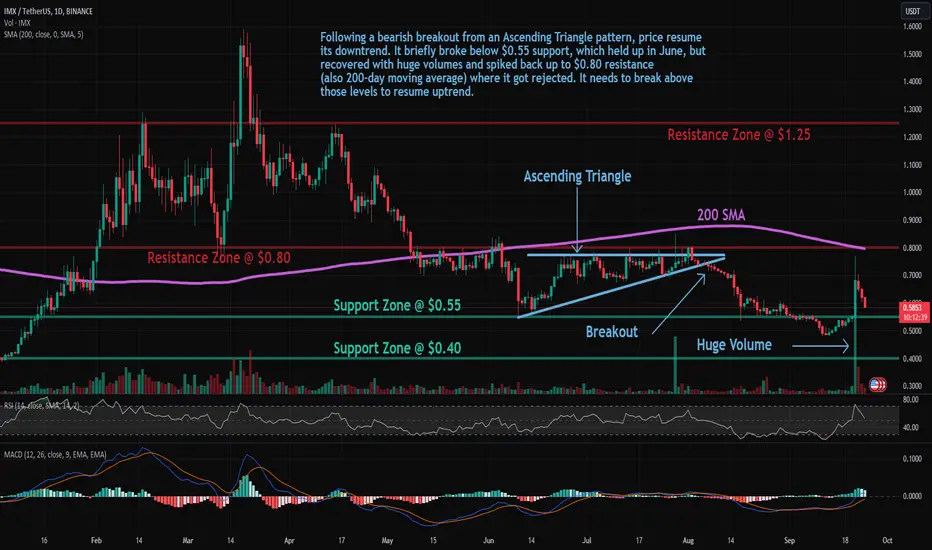
IMX: Approaching SupportTrade setup : Following a bearish breakout from an Ascending Triangle pattern, price resume its downtrend. It briefly broke below $0.55 support, which held up in June, but recovered with huge volumes and spiked back up to $0.80 resistance (also 200-day moving average) where it got rejected. It needs to break above those levels to resume uptrend.
Trend : Uptrend on Short-Term basis and Downtrend on Medium- and Long-Term basis.
Momentum is Mixed as MACD Line is above MACD Signal Line (Bullish) but RSI ~ 50 (Neutral).
Support and Resistance : Nearest Support Zone is $0.55, then $0.40. The nearest Resistance Zone is $0.80, then $1.25.
Wyckoff Accumulation SchematicIdentified this early as it was developing and continued adjusting and watching to see the elements of the schematic get formed. Was able to quickly determine that price would break UP out of this accumulatyion range and able to set purchase orders on the retest of the SOS

$imx potential buy TRADECRYPTOCAP:IMX 🎯 pumped and rejected from daily bearish OB
I will be BUY in green zone ( bullish OB ).


IMX will move 56% after dump on 13% from my POE. RR 1.5 This will happen, because we need to take liqudity
And also, we have this falling wedge
Why my thoughts about we need to fall on 13%

IMXUSDT - A crazy volatile coinWe will seek profit during the bear season to save for the bull. Let's manage capital and leverage wisely
Entry: 0.577-0.585
Tp: x2
Stoploss: 0.529


IMX/USDT Starting Accumulation, Bullish Momentum ??? Hello Paradisers, Token to Keep an Eye On!
💎 IMX has been rejected twice after reaching a strong demand zone. The hourly chart displays a double bottom pattern, signaling a favorable entry point.
💎 IMX is likely to test its supply zone next and will need to break through to sustain an upward trend. The presence of a strong green candle indicating bullish rejection is usually a sign that upward momentum and accumulation are underway.
💎 Should IMX fail to maintain its position in the strong demand zone, it's likely to drop to the Bullish Order Block (OB) area, where we can expect a significant rejection and a gradual break through the supply levels.

IMXUSDTIMXUSDT was trading in descending parallel channel and recently it seems like the sellers are bit exhausted now and bulls took the charge and now has given the breakout from descending channel.
Currently the price is forming a local support around 0.52 region.
Will the bulls take charge again continue for leg higher?
What you guys think of this idea?

IMXUSDT
Not an investment recommendation. This chart was made for personal study and personal use only. If you like the idea, please boost it. If not, write why. In my humble opinion, the price will go down.
IMX 80% move Incoming? Strong Case for Head @ Shoulders setup.Not financial advice and all charts are posted under current market conditions .
Please do your own research.
IMX has a strong setup here that has me to believe a leaning head and shoulders setup is playing out with entry in the range of around .50-.52c.
I believe below this was a bear trap and as long as .50c area holds we can aim for a target of around 1.00-1.11 range upon completion of head and shoulders.
You can even take profits as it moves up.
Again .50c is key to hold overall.
Risk to reward favors Reward by roughly a little over 80% .
Not to shabby.
Also of note we are holding the bottom channel of the Gaussen channel currently with the bottom of that channel spiking up. Also a great sign.
Lots of hype and and good crowd backing behind this project.
Comment like and follow and for more market insights come see us at exmostudy

$IMX$IMX
On Daily timeframe level the price action of $IMX broke down the Horizontal Support leve of its Descending Triangle pattern level where the price action took out all the liquidities at Daily Sell Side level where Market Structure Shift also is marked
If the price action breaks the MSS level and closes below it we further expect to see the downward movements

IMX and maybe a good chance for a short positionAn interesting one!
A good purchase order block
An explosive growth and gradual improvement!
Wait for a good confirmation candle to enter

IMX/USDT is Showing Bullish Momentum | Immutable Analysis💎 IMX/USDT is currently navigating a descending channel, with a potential breakout on the horizon.
💎 If this breakout happens, it's poised to catalyze a projected impulsive surge.
💎 Notably, there's a confirmed order block in the shorter timeframe. Due to existing liquidity, the price is anticipated to gravitate toward these levels.
💎 In a previous phase, demand transitioned to supply, leading to a marked price decline and aiming for the prior OB.
💎 In the ever-fluctuating crypto landscape, being updated and flexible is essential. Keep a lookout for further insights and savor your trading voyage.

IMX ANALYSIS (1D)Hi, dear traders. how are you ? Today we have a viewpoint to BUY/LONG the IMX symbol.
For risk management, please don't forget stop loss and capital management
When we reach the first target, save some profit and then change the stop to entry
Comment if you have any questions
Thank You

IMX Big BullsHello Traders!
Welcome back to another trade with analyst Aadil1000x.
Strong bulls are ready to dive in IMX and these bulls will take IMX to previous High.
IMX Buy Now @ 0.7017
Stoploss 0.6728(-4%)
Target 1, 0.7465(+6.3%)
Final Target 0.7961(+13.59%)
Tolls/Indicators
>Directional
Trendline
>Entry
SMA 6 vs EMA 6 Cross, RSI(11 RSI length above 6 MA)
>Strength
Volume Indicator
>Exit/Target strategy
A1000x TR point Strategy
>Impact
LaRSI
I am using an A1000x Breakout Strategy that relies on trendline Breakouts to determine the trade direction. Additionally, I utilize Indicators to determine whether to enter the trade or abstain from it.
Remember to click on the "like" button and follow to stay connected.

IMXUSD ❕ tests the supportPrice and RSI chart formed a convergence (1H TF)
Trading volumes remain low.
I believe that the asset will return to the range.


$IMX, Testing highs since May$IMX
If it can surpass May's highs, it might be worth following or taking action on.
Interestingly, a UCTS 2D Buy signal emerged on yesterday's close while most of the market was showing bearish signals.

imximx technical analysis basically on elliott waves Principles and RTM priceaction strategy
imx can be make high and higher high in 2.50$ and more
wait and watch.

