IMXUSDT Resistance Zone BreakoutIMXUSDT Technical analysis update
IMX price breaks the resistance zone on the 4H chart after multiple rejections. The 4H candle closed above the resistance zone, and the price is trading above the 100 and 200 EMA. We can expect a strong bullish move from here.
Buy Level: $1.66
Stop Loss: $1.46
Regards
Hexa
IMXUSDT trade ideas

IMXUSDT Tripple Bottom!IMXUSDT technical analysis update
IMX has formed a triple bottom on the 4-hour chart, and the price has broken the triple bottom neckline. We can expect a good bullish move from the current level.
Buy Level: $1.33
Stop Loss: $1.20
Regards
Hexa

Immutable X: Low risk buy signal to rejoin the trendBINANCE:IMXUSDT offers a low risk entry here, which could end up being a long term bottom after a correction in monthly/quarterly scale.
This is a project with interesting developments in the game-fi niche, which is currently one of the most hated narratives alongside NFTs. They have invested over 1 Billion in their game ecosystem, and offer a convenient way to use crypto securely while gaming.
You simply create a passport signing up with Google for instance, and enjoy gasless transactions under the hood, it is easy to use and allows games to reward players and have sustainable in-game economies. Fairly interesting stuff.
Currently you can participate from a campaign to earn gems and future IMX rewards for playing some games as well, check that out here: passport.immutable.com
Create your passport here: passport.immutable.com
(You can also use your existing ETH wallet for this but it's not necessary and more complicated.)
Best of luck!
Cheers,
Ivan Labrie.

Great Buying Opportunity in IMX
IMX fell from 3.77 to 1.2, completing the shoulder-head-shoulder pattern. It found a nice support at 1.2. Buying at this level can provide a nice return in the long run.
Considering its recent developments and new projects such as Passport, IMX offers a good investment opportunity.

Alikze »» IMX | Head and shoulder pattern scenario🔍 Technical analysis: Head and shoulder pattern scenario
- In the weekly frame time, there was a three -wave move that has grown to 1.272 for its previous wave.
- According to the analysis presented before leaving the triangle density in the 4th wave of correction, it succeeded in the supply zone of growth and defeat it.
- After that, it faced a lack of stability at the top of the supply zone.
-This unsuccessful failure area of the supply area is a head and shoulder pattern.
- Currently, there is a currency pattern that can have a growth of a dynamic trigger.
- If the line is broken, the head and shoulder pattern will be approved and can be modified in the first step until the Golden Zone, and then the Priz area will continue and even move to the origin of the movement.
💎 Replacement scenario: If it can be removed from the corner, it can test the supply area, but the head and shoulder pattern will not be valid until the supply zone is broken and will confirm the pattern by defeating the line.
»»»«««»»»«««»»»«««
Please support this idea with a LIKE and COMMENT if you find it useful and Click "Follow" on our profile if you'd like these trade ideas delivered straight to your email in the future.
Thanks for your continued support.
Best Regards,❤️
Alikze.
»»»«««»»»«««»»»«««

IMX ready to buyIn the last analyst, I thought it will reverse around 1.2-1.3.
But it goes further following the H&S pattern 's target - 100% from neck to head.
So the next buy zone should be 0.78-1$
DCA in this area and ready to the moon

IMX in weekly chart Hello
Sometimes you just need to see the chart simply and this chart is a perfect example. In the right shoulder you can count its corrective sub-waves but in weekly timeframe you are watching this beautiful Heard-and-Shoulder making its right shoulder. There is a big mistake for interpreting this pattern and I can see it even in the works of good traders. You MUST analyze this pattern only and only parallel with Volume fluctuations. Whoever claims that it is not necessary, he does not know what happens in the exchange between buyers and sellers that causes this pattern.
Our confirmations:
1- neck line break out
2- pull back to neckline
3- volume rise in right shoulder
if they do not happen, this is not a H-A-S pattern.

IMXUSDT Chart Update in 3-Day Timeframe.Hello everyone, I’m Cryptorphic.
For the past seven years, I’ve been sharing insightful charts and analysis.
Follow me for:
~ Unbiased analyses on trending altcoins.
~ Identifying altcoins with 10x-50x potential.
~ Futures trade setups.
~ Daily updates on Bitcoin and Ethereum.
~ High time frame (HTF) market bottom and top calls.
~ Short-term market movements.
~ Charts supported by critical fundamentals.
Now, let’s dive into this chart analysis:
IMX has been in a downtrend for over three months, with the price dropping almost 63% from $3.76 to $1.38.
Currently, the price is holding support at $1.44, and a rebound will likely push the price toward the $1.8 to $2 resistance (50EMA).
The downtrend in IMX is likely to continue for one specific reason: the upcoming token unlock.
In 10 days, IMX will unlock 32.47 million tokens, which is 1.62% of the maximum supply. There's a high chance that selling pressure will increase once the tokens are unlocked, which will eventually drop the price.
Key Observations:
~ Primary Support: $1.44.
~ Lower Support/Entry: $0.68.
~ Primary Resistance: $1.8 to $2.
~ Higher Resistance/Target: $3.4 to $4.5.
DYOR.
Please hit the like button to support my content and share your thoughts in the comment section. Feel free to request any chart analysis you’d like to see!
Thank you!
#PEACE #Altcoins

Potential move towards higher resistance levelsIMX is currently consolidating within a pattern. We are anticipating a breakout from this formation. Should the price break out upwards, it suggests a potential move towards higher resistance levels.

IMX Analysis: Daily Review and Bitcoin Update🔍Let's dive into today's analysis. Today, we're focusing on the IMX coin, examining it in the daily timeframe. But before we get into that, as usual, let's review the daily Bitcoin analysis and provide an update on yesterday's analysis in the 1-hour timeframe.
👑 Bitcoin Analysis
1-Hour Timeframe
Bitcoin analysis is in the 1-hour timeframe. As mentioned yesterday, the market needs to establish a new structure. Given that today is Saturday and market volume is low, it is advisable not to open any positions today and tomorrow.
📈 After the recent drop, we saw a slight upward movement with very low volume, which appears to be a pullback to 64530, overlapping with the middle line of the descending channel. If selling volume enters the market simultaneously with a rejection from this area, despite it being Saturday, I might open my position with less risk. The target for this position could be the channel's bottom or 63343.
🔑 Breaking 44.53 can be a good confirmation for this risky short position.
⚠️ Currently, I don't have a trigger for a long position and won't open one until buying volume enters the market. If you want to open a long position, breaking 64530 could be suitable, but I don't recommend opening a position with this trigger, and I won't either.
🎮 IMX Analysis
🔫Overview
IMX operates in the field of crypto games, providing infrastructure for other projects. It allows both game creation and gameplay within its ecosystem, making it a comprehensive platform for enthusiasts of crypto games and play-to-earn models.
📅Daily Timeframe
Looking at the chart in the daily timeframe, the first thing that stands out is the head and shoulders pattern, with its trigger already activated. This pattern emerged from the coin's upward movement from 0.4915 to 3.6567, with the trigger appearing at the 0.382 level. Upon breaking this trigger, we can aim for the targets indicated in the chart.
🎯 The first target is the 1 Fibonacci extension point on the downside, overlapping with the 1.2463 support, forming a strong area. The second target is an extremely strong area for several reasons: it is the 1.618 Fibonacci extension point and one of the most important support levels for this coin. Additionally, it is the 0.786 Fibonacci retracement point and the first target of the head and shoulders pattern.
🔻 Currently, the trend for this coin appears bearish. Breaking 23.75 in RSI can introduce more downward momentum into the market. However, for a long or spot purchase, I'll wait until the price moves above the 1.7739 area and RSI breaks 39.60. Only then will I consider a long position.
📝 In summary, while the current market sentiment for both Bitcoin and IMX is bearish, careful observation of key levels and triggers can present potential trading opportunities. For Bitcoin, caution is advised with low market volume over the weekend. For IMX, the head and shoulders pattern indicates possible downward targets, but significant levels must be watched for potential reversal signals. Always wait for volume confirmation to avoid false moves and optimize your trading decisions.

IMX || Ratio 2.12IMX forming good signals upward.
We mentioned all targets for profit and the risky points,
We are pleased to inform you that we passed the final phases to publish our AIO indicator with Smart strategy.

iMx Update: What a good pattern it isWe are seeing a Head and Shoulder bamboo.
Please use it to wash our hair to get fresh.
Don't be scare if price goes down to 1.2-1.4
That is very good chance to buy a ticket on this project.
Ready for web3 gaming?


IMX Head & Shoulders !Is the Active Head and Shoulders Pattern Forming?
An intriguing yet risky topic.
Intriguing because we have formed a head and shoulders pattern in a semi-bullish market. If Bitcoin, with its high dominance, corrects, our head and shoulders pattern could activate, with the first target being the ($1.21 - $1.06) range and then the final target being $0.80. This could be dangerous for those holding this currency.
All of this could happen if we see a daily timeframe candle close below the $1.64 range and wait for a pullback or confirmation candle.
Are we going back to crypto hibernation? What do you think?
This is just an analysis and not financial advice at all.
This may not happen and the complete opposite could take shape. I'm just sharing something intriguing with you.

IMX Targets $1.89IMX has lost support and is now trading below the Value Area Low, signaling a selling imbalance. The next area of support (Demand Zone), sits at $1.89. With a nice reaction from that level, a solid bounce and follow.
Calculate Your Risk/Reward so you don't lose more than 1% of your account per trade.
Every day the charts provide new information. You have to adjust or get REKT.
Love it or hate it, hit that thumbs up and share your thoughts below!
This is not financial advice. This is for educational purposes only.

IMXUSDT Head and shoulders up to 2.6 then down to 1.4-1.6It forms a head and shoulder shape, it will be ready for a dump soon.
Be careful and buy around 1.4-1.6
Then sell 5++
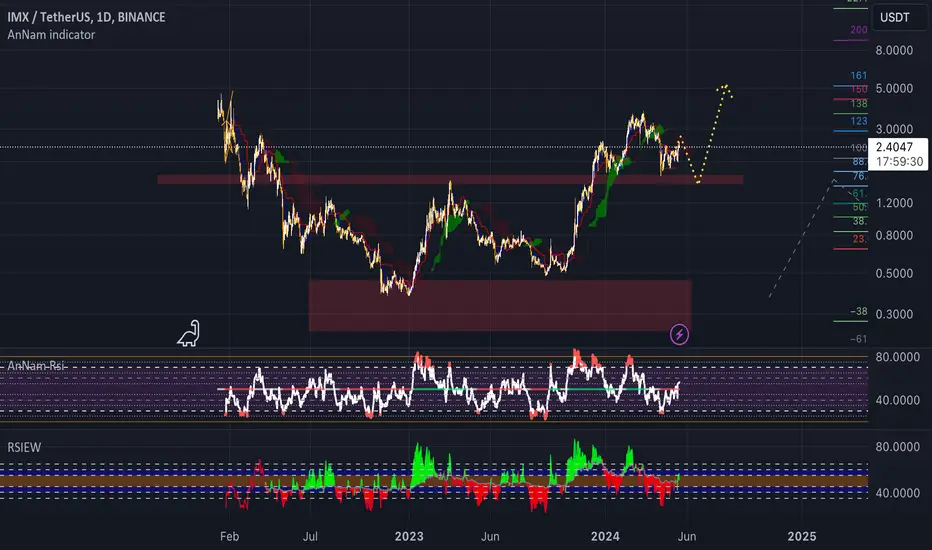
Bullish continuation: final leg upDescription: Short/Mid-term perspective
- long signal MACD(d) zero crossing (from below)
- price above ema 111(d)
- ema contraction, ready for expansion
Price hit required 1.618fib level for a wave 3 (minute). 5th wave in the making. See potential price targets in chart.

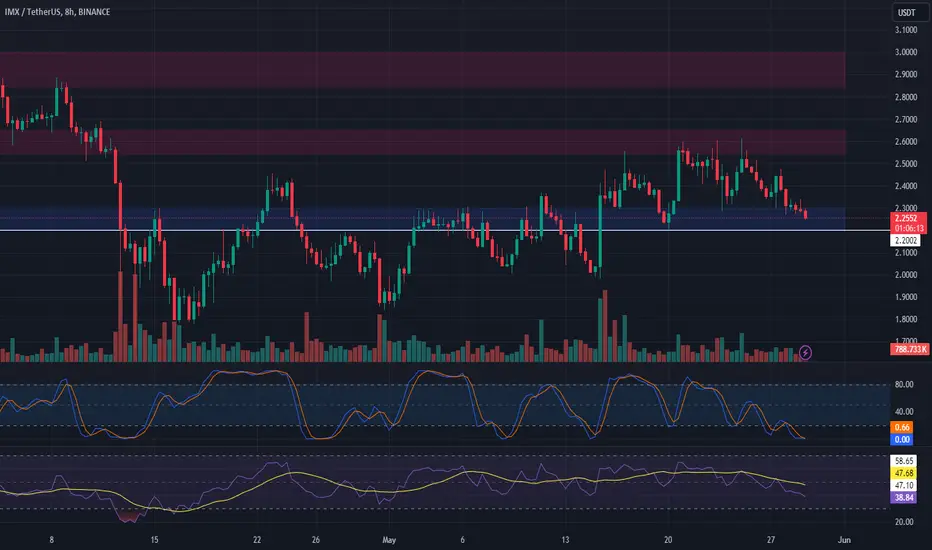
IMX Long Trade SetupCurrent Situation:
IMX has experienced a sell-off this week but might be poised for a reversal. The current ENTRY box offers a favorable setup, incorporating multiple levels of confluence such as trend, 0.786 Fib, horizontal supports, and a reset Stochastic RSI on 12-hour and daily timeframes.
Trade Strategy:
Entry Point: Enter a long position within the $2.15 to $2.10 range.
Take Profit Targets:
First Target: $2.26
Second Target: $2.39
Third Target: $2.53
Stop Loss: Set a stop loss at a candle close under $2.09 to manage risk.
Risk Management:
Watch for weakness into the ENTRY box to reduce stop-loss risk.
Be mindful of leverage, as losses are amplified if the trade goes against you.
Alternative Long Zone:
If the current setup fails and IMX drops further, consider entering a long position in the $2.03 to $1.99 region.
Stay cautious and good luck with your trading! 📊📈
#Crypto #IMX #Trading #LongTrade #EntryPoint #TakeProfit #StopLoss #MarketAnalysis #Cryptocurrency #Blockchain

IMX/USDT Ready for a Bullish Reversal From a Key Support💎Attention Paradisers, There’s a vibrant opportunity for a bullish rally as #IMXUSDT is firmly following on the support of an ascending channel. Currently, it’s maintaining its stance at $2.204. With solid support at this level, #IMX is well-positioned to challenge and potentially break through the bearish order block located just above.
💎However, if #Immutable falters and descends below the $2.204 support, it might signal a weakening bullish force, potentially spiraling into a bearish trend. The next critical support zone lies at $1.98, a region known for its vigorous liquidity and history of sparking substantial upward corrections.
💎If CRYPTOCAP:IMX revisits this demand zone, securing a strong rebound is imperative to sustain bullish intentions. A failure here could amplify bearish pressures, sour the market outlook, and push prices to even lower thresholds.
💎Stay alert and adaptive, Paradisers. Your ParadiseTeam is continuously monitoring the market to ensure you’re well-prepared to navigate the dynamics of the #Immutable market.
MyCryptoParadise
iFeel thesuccess

IMX Long Trade SetupCurrent Situation:
Price Level: IMX is trading at a support level, making it an ideal entry point for a long trade.
Trade Strategy:
Entry Point: Enter a long position between $2.20 and $2.30.
Take Profit Targets:
First Target: $2.55 - $2.65
Second Target: $2.85 - $3.00
Stop Loss: Set just below $2.20 to manage risk.
Summary:
IMX is currently at a strong support level, providing a good opportunity for a long trade. Enter between $2.20 and $2.30, with take profit targets set at $2.55 - $2.65 and $2.85 - $3.00. A stop loss just below $2.20 will help to mitigate potential losses.
IMX PriceThe daily charts of the Immutable (IMX) signifies a rebound, but failed to retain the momentum and faced rejection near the 100 day EMA mark.

Reaching the new price levelsIf IMX manages to break through the key red resistance level and stabilize above it, there is a high probability that it will reach new price levels. This could indicate the beginning of a new upward trend, attracting the attention of many investors and analysts. It is also important to consider trading volume and overall market conditions to ensure the sustainability of this breakout.

IMX/USD Selling Opportunities + the bigger pictureThe IMX/USD pair has formed a Head and Shoulders ( H & S ) pattern, which is a chart formation that predicts a bullish-to-bearish trend reversal and is one of the most reliable trend reversal patterns. Here’s a simple breakdown:
Formation: It appears as a baseline with three peaks; the middle peak (head) is the highest and the two outside peaks (shoulders) are lower.
Entry Signal: A break below the neckline (support level) after the formation of the second shoulder gives the sell signal.
Volume: Typically, volume is highest when the left shoulder is formed, decreases through the head, and is lowest when the right shoulder is formed.
Target Price: After the breakout, the target price can be estimated by measuring the distance from the head to the neckline and extending it downward from the breakout point.
It’s important for traders to wait for the complete formation of the pattern before making any trades based on it. Remember, while patterns can indicate probable market movements, they do not guarantee them. Always use stop-loss orders to manage your risk
