SSE MT (January 31st 2021)SSE Composite Index (January 31st 2021 through June 2022)
Low: 3,174 - 3,460 points
High: 3,922 - 4,385 points
I track this metric as part of a weekly Cindicator forecast, I've come up with these projections solely using what I can so far understand of technical analytic methodology applied to the present data.
My current belief is that the SSE index is in one large triangle that could result in a massive breakout anytime between 2024 up to 2028. The resulting direction is still uncertain to me but I have a suspicion it could result in some very bullish market price action.
I believe the SSE related markets may have a bit of a sell-off this week, could correlate with some of the crowd psychology in American stocks with similar sell-offs in S&P and Dow indices.
If the sell-off continues, it could still be a bullish major trend but retrace as low as 3,283 to 3,405 points for 2 to 6 weeks or so at most.
There's also a chance this move doesn't immediately recover and paints a head and shoulders over the next 2 or 3 months. If this happens, I believe it could test a final support near 3,174 points before making new moves again. But if this scenario happens, price action may just get stuck in the range of the red box on the chart for a couple more months before making new breakouts. However, this doesn't seem too likely to me.
Once price action can pull out of this most recent week's bearish zone, the next bullish target I will be looking for a major sell reaction is around 3,922 points, with a potential quick stop near 3,761 points before completing that move. If that happens as expected, I would expect price action to retrace to as low as 3,460 to 3,637 points before making new bullish moves higher again. My estimated timeframe for this move is within February/March to July/August 2021.
If all is well by this point, the last major price action target sits around 4,385 points before another major sell-off could occur, this overall move could take from late 2021 to early 2022 by my estimates.
After that, most markets could end up very bearish for a couple years, sometime between 2022 to 2025 seems reasonable.
During this time, the SSE could potentially crash low enough to touch the triangle's lower border trend, anywhere from 2,904 to 3,174 points before making a struggle for higher highs, a potential second trend touch and then from there we can consider new variables to attempt to gauge if the expected breakout is bullish or bearish.
Longer term and previous related ideas attached below:
Thanks for tuning in :) Disclaimer, anyone in the trade needs to do their own due diligence and decide what is right for YOU. My charts can be wrong at any time and it's very important that you have your own strategies and plans in place. I run this channel for my own educational purposes of learning to trade, and I will never be 100% right, so please do not let me confirm any bias for you! (Dangerous to do so, stay safe and remember the basics & rules of risk assessment.) Expect the unexpected and happy trading!
000001 trade ideas

SSE Composite has broken the long term down trend line!!SSE:000001
Happy 2021 traders!!
SSE Composite (China A share index) has finally broken up the long term down trend line extended from Dec 2015 and Jan 2018.
Indeed it is a very bullish movement! The major resistances above are at 3587 and 3684.
Stay tune for the update:)


SSE Breakout Pump or H&S? (Jan 1st 2021)SSE Composite Index (January 1st 2021 through July 2021)
Low: 3,210-3,473 points/CNY
High: 3,914-4,002 points/CNY
Very interesting that we have reached the top of this compression channel again, will it fully break out this time? Or maybe its another head and shoulders... Here are 2 different scenarios I can see playing out, both ending in bullish patterns by summer...?
Thanks for tuning in :) Disclaimer, anyone in the trade needs to do their own due diligence and decide what is right for YOU. My charts can be wrong at any time and it's very important that you have your own strategies and plans in place. I run this channel for my own educational purposes of learning to trade, and I will never be 100% right, so please do not let me confirm any bias for you! (Dangerous to do so, stay safe and remember the basics & rules of risk assessment.) Expect the unexpected and happy trading!


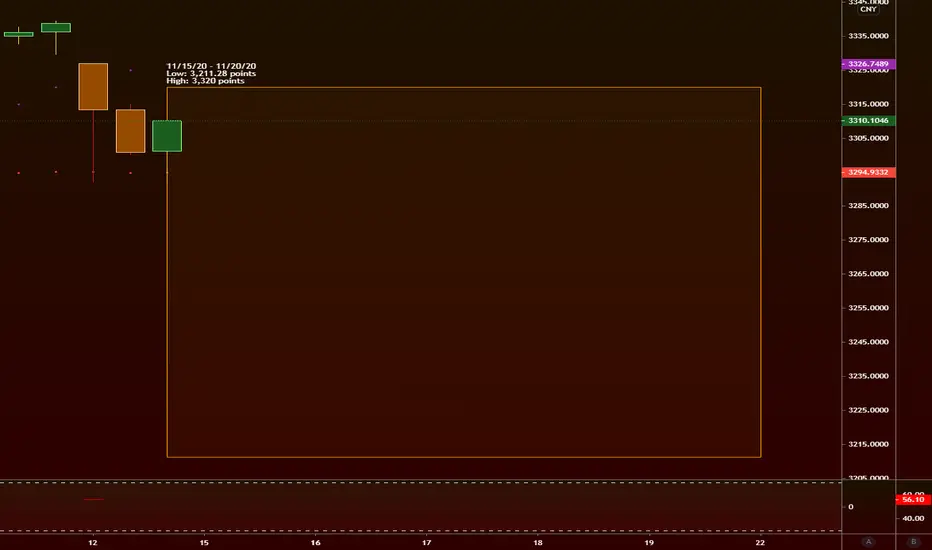
SSE Weekly (Nov 15th - Nov 20th 2020)SSE Composite Index (SSE) (November 15th 2020 through November 20th 2020)
Low: 3,211.28 points
High: 3,320 points
My idea behind what could happen in the SSE this week.
Thanks for tuning in :) Disclaimer, anyone in the trade needs to do their own due diligence and decide what is right for YOU. My charts can be wrong at any time and it's very important that you have your own strategies and plans in place. I run this channel for my own educational purposes of learning to trade, and I will never be 100% right, so please do not let me confirm any bias for you! (Dangerous to do so, stay safe and remember the basics & rules of risk assessment.) Expect the unexpected and happy trading!


Shanghai Stock Index turning downIt looks like testing low of Pitchfork channel. Breaking down will result in serious correction.


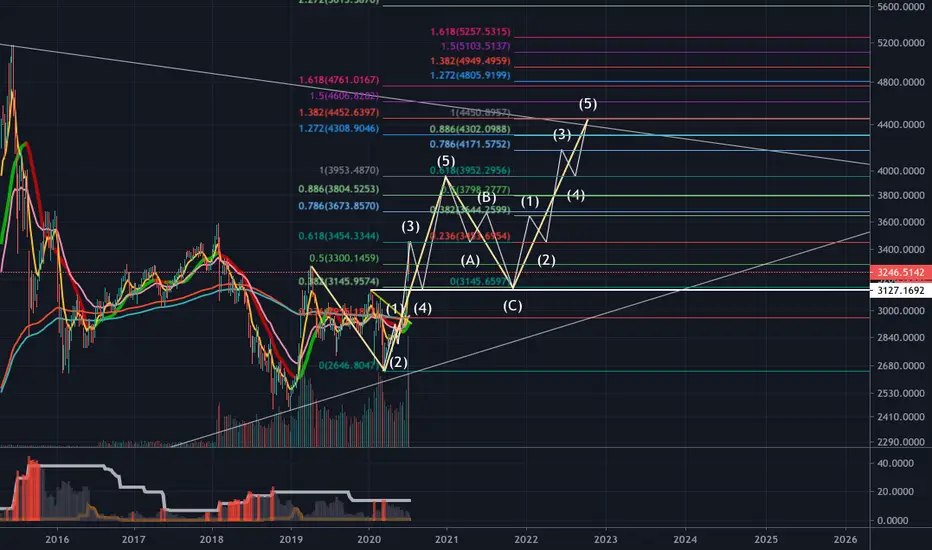
SSE longNow we could see clear ABC pattern with A=2C(red lines), if the Kline up breaks B. We can see a clear bull trend with target:
11000-17000 , even higher

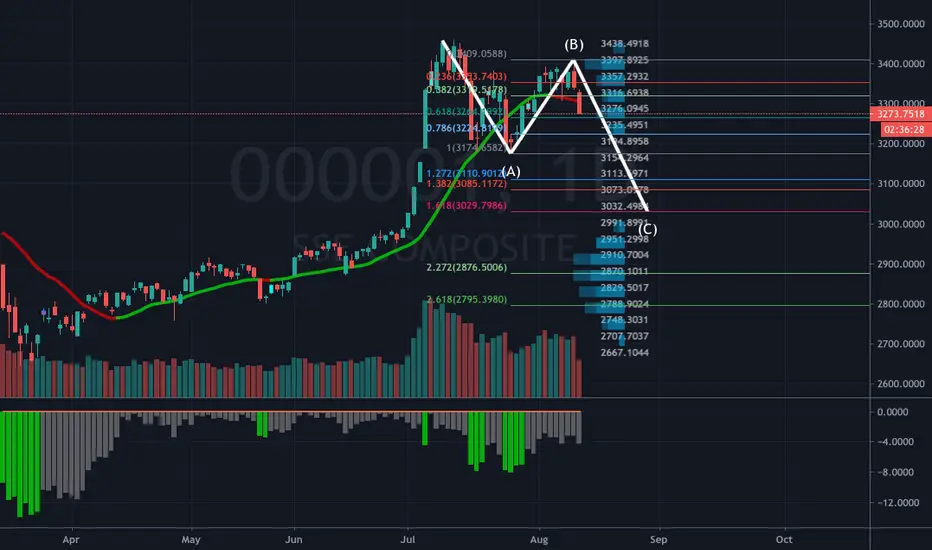
SSE Elliot Wave Prediction3-rd wave now and it will dump to 3127 to be the 4th wave then comes to the 5th wave.

Time for a Breather… A Look at the SSEThe rally of late has driven prices on the Shanghai Composite (SSE) to a 52 week high, smashing through key resistance levels along the way. Much of this sudden interest in Chinese stocks is all thanks to the Chinese Government egging on Chinese Investors to jump on the bandwagon and throw their money at the stock market. Needless to say, this led to a huge spike in volume, and stock prices followed through.
Historically huge volume spikes have led to weak returns for the short and long term, for the medium term stocks returns were above average. Perhaps It’s time for a breather here at (1) as the SSE tests 38.2 fib level along with dual trend line resistance. Immediate daily support is at 3288.91. Above resistance at (1) Investors should look for a re-test of January 2018 highs which came in at 3591.70.


Chinese government can manipulate US elections by manipulating There is a positive correlation between the US and Chinese stock markets, and the Chinese government can manipulate US elections by manipulating the Chinese stock market.
The Chinese government is using its power to raise the Chinese stock index.The Chinese government has boosted the US stock market by pulling up the Chinese stock market.
Through such abductions, it is difficult for Trump to adopt a tough trade policy against China.The probability of Trump's re-election appears to be in the hands of the Chinese government.

Shanghai Composite - BIG Breakout in China Stocks !Shares are breaking out to the topside of a long term triangle pattern
Long term bottom established at 2650 support

000001As the epidemic is brought under control, the economy restarts, and ultra-loose monetary and active fiscal policies have laid the foundation for the stock market.

