USDX-NEURAL SELL strategy 6 hourly chart GANNThe index is under pressure, and it has moved as expectation since I started my travels. However, am cautious selling right now, as there is some room to see minor recovery before lower. Also we are near a previous bottom.
Strategy SELL @ 99.00 - 99.25 and take profit near 96.50 for now.
DXY trade ideas

Let's Connect !Hey Traders!
I’ve been sharing a lot of trade setups recently—and I’m thrilled many of them have been playing out successfully.
Now I want to take things to the next level and connect more with you.
Drop a quick comment below—whether it’s feedback, suggestions, or something you'd like help with. I want to tailor my content to what really matters to you if possible.
If the feedback remains limited, I may explore other ways to engage or shift focus.
Until then, I’ll keep posting and see if it continues to bring value to the community.
If you’ve been finding my ideas helpful, make sure to follow so you don’t miss what's next!
Let’s build something powerful together.

Weekly CLS I Model 2 I Target CLS Highs / OBHey, Market Warriors, here is another outlook on DXY. If you’ve been following me, you already know my setups are based on CLS Footprint, a Key Level, Liquidity and a specific personal execution model.
If you haven't followed me yet, start now.
System is completely mechanical and repeatable— designed to remove emotions, opinions, and impulsive decisions. No messy diagonal lines. No random drawings of multiple patterns Just one setup and market context working on all markets.
🧩 What is CLS?
CLS is real smart money — the combined power of major investment banks and central banks moving over 6.5 trillion dollars a day. Understanding their operations is key to markets.
✅ Understanding the behavior of CLS allows you to position yourself with the giants during the market manipulations — leading to buying lows and selling highs - cleaner entries, clearer exits, and consistent profits.
📍 Model 1
is right after the manipulation of the CLS candle when CIOD occurs, and we are targeting 50% of the CLS range. H4 CLS ranges supported by HTF go straight to the opposing range.
"Adapt what is useful, reject what is useless, and add what is specifically your own."
Please don't gamble on this setup, just because you seen majority of my setups played out. You can never know which trade will work and which not. It's just a probability. Rather take this as opportunity to learn.
David Perk aka Dave FX Hunter ⚔️
👍 Hit like if you find this analysis helpful, and don't hesitate to ask me questions, Im always happy to help others and respectfully discuss other opinions.

check the trendIt is expected that a trend change will form within the current support range and we will witness the beginning of an upward trend. Otherwise, the correction trend will continue until the next support ranges.

Weekly trade ldea on DXYAm still short term bullish on the dollar, this morning trade war is causing the dollar to fall a little bit
We might see a little rise and then a deep fall in the dollar
which will help our decision aking on its pairs
Like follow for more updates
DXY Under Pressure: Breakdown Incoming Below 99.00?After testing the 102 resistance zone in mid-May, the TVC:DXY resumed its downward move, dropping back into the 98.50–99.00 support zone.
The brief spike above the psychological 100 was quickly rejected, and price has since rolled over — currently trading around 99.27 at the time of posting.
🔻 The downside pressure is strong, and a break below support looks imminent.
If that break occurs:
🎯 Short-term target: 98 (approx. 1% drop)
📉 Medium-term potential: A deeper decline toward 95

Could that be it for DXY ?DXY could drop at the best scenario to 98 - 100 or a deeper correction giving the market some oxygen

Weekly FOREX Forecast Jun 2 - 6th: Wait to BUY Majors vs USD!This is the FOREX futures outlook for the week of Jun 2 - 6th.
In this video, we will analyze the following FX markets:
USD Index EUR GBP AUD NZD CAD CHF JPY (CHF and JPY forecast to follow).
It's been a consolidative week, but the USD is still weak. Look for valid breakdowns of consolidations before buying against the USD.
NFP week ahead! Mon-Wed will be the best days to trade.
Enjoy!
May profits be upon you.
Leave any questions or comments in the comment section.
I appreciate any feedback from my viewers!
Like and/or subscribe if you want more accurate analysis.
Thank you so much!
Disclaimer:
I do not provide personal investment advice and I am not a qualified licensed investment advisor.
All information found here, including any ideas, opinions, views, predictions, forecasts, commentaries, suggestions, expressed or implied herein, are for informational, entertainment or educational purposes only and should not be construed as personal investment advice. While the information provided is believed to be accurate, it may include errors or inaccuracies.
I will not and cannot be held liable for any actions you take as a result of anything you read here.
Conduct your own due diligence, or consult a licensed financial advisor or broker before making any and all investment decisions. Any investments, trades, speculations, or decisions made on the basis of any information found on this channel, expressed or implied herein, are committed at your own risk, financial or otherwise.


DXY Analysis today : Possible reversal?With strong liquidity grab at 99.00 DXY, with monthly rejection to the upside, past week we have seen with gap open the market started to drop long term support level 99.000 which smart money zone price has got bounce back to the upside with strong momentum potentially forming a double bottom with series of higher low price may continue to move up to the 100.75 to long term monthly resistance with NFP we may see further rejection down again.
A bullish on support is high probability !

1. "What do you think — is DXY ready to fly or fall?"DXY 4H Analysis – Decision Time for the Dollar?
After completing a falling wedge with a clean 5-wave Elliott structure, the U.S. Dollar Index is approaching a key demand zone.
Will buyers step in to push price toward the bullish target near 106 📈?
Or will we see another rejection from the supply zone and a deeper drop to 94? 📉
Wave A or Wave B?
Market structure shows signs of reversal, but confirmation is still pending a break of resistance or further rejection.
👉 What do you think — bounce or breakdown?
Comment your view below ⬇️
Let’s see who’s riding the next big wave 🌊
#DXY #USD #ElliottWave #SupplyAndDemand #GreenFireForex #ForexAnalysis #WaveTheory

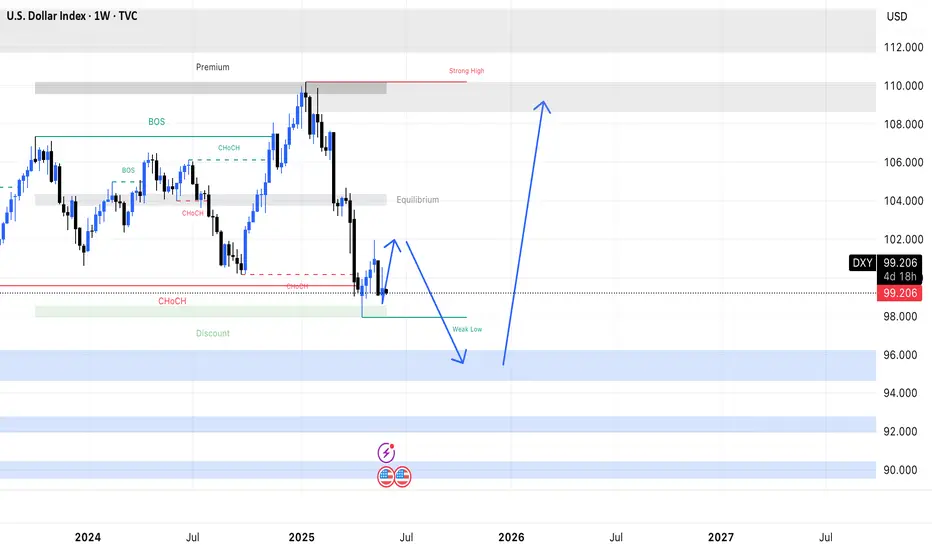
DXY Weekly ForecastDXY Weekly Forecast
- keep looking for down move
- in any case DXY has to come down to 96.000 level
"I Found the Code. I Trust the Algo. Believe Me, That’s It."

DXY 4H Breakout? Bulls Eye Momentum Shift!Hey There;
The U.S. Dollar Index (DXY) appears to have reached a critical turning point from a technical analysis perspective. According to Elliott Wave Theory, following a five-wave downtrend, the AB corrective wave has been completed, and a bullish movement towards the C wave is emerging. This scenario could signal a transition from a bearish market to a bullish one.
Technical Outlook:
- A move towards 104.460 on the DXY may indicate that the market is entering a strong recovery phase.
- The completion of the AB corrective wave suggests that buyers are stepping in, driving upward momentum in price action.
- The C wave typically retraces a portion of the prior decline, creating potential for a higher price level.
Macroeconomic Factors:
- U.S. monetary policy and inflation data remain key determinants of the dollar index’s trajectory.
- Increased global risk appetite may bolster the dollar’s appeal as a safe-haven asset.
- U.S. Treasury yields could provide additional support for DXY’s upward movement.
If DXY successfully reaches 104.460, this could confirm a shift into a bullish trend. However, the strength and sustainability of the C wave will depend on supportive volume and momentum indicators. The interplay between technical and fundamental factors could drive a solid recovery in the dollar index.
Should this scenario unfold, it may mark the beginning of a renewed period of dollar strength against global currencies. However, market dynamics and macroeconomic developments must be monitored closely to validate this outlook.
Guys, every single like from you is my biggest source of motivation when it comes to sharing my analysis.
A huge thank you to everyone who supports me with their likes!

DXY (USDX): Trend in weekly time framehe color levels are very accurate levels of support and resistance in different time frames, and we have to wait for their reaction in these areas.
So, Please pay special attention to the very accurate trend, colored levels, and you must know that SETUP is very sensitive.
BEST,
MT

DXY moving to Sub-Wave 5 of Wave 3Now we see the recent move is toward the completion of Wave 3 with 5 sub-waves. Sub-waves 1,2,3,4 already completed. The final Sub-Wave 5 will move in impulsive waves.
Trump will make it happen soon. haha..
My Thoughts #012The pair is in a bearish trend on the weekly time
In the bearish trend the pair seems to be making a LH
Meaning we are currently moving up and currently on the lower time frame we are in bullish trend.
The pair still has equal highs open on the weekly time frame.
It further sweeped equal lows on the daily time to fuel for the next move up.
The pair broke out, retested and after that it's been trying to gain more momentum for the upside.
Sells could still happen just use proper risk management
let's do the most


The tariff legal zig-zagWith different US courts firing "shots" at each other over the legality of tariffs, the market is taking a bit of a pause from accelerating further. Let's dig in!
DJ:DJI
TVC:SPX
TVC:NDQ
TVC:DXY
Let us know what you think in the comments below.
Thank you.
77.3% of retail investor accounts lose money when trading CFDs with this provider. You should consider whether you understand how CFDs work and whether you can afford to take the high risk of losing your money. Past performance is not necessarily indicative of future results. The value of investments may fall as well as rise and the investor may not get back the amount initially invested. This content is not intended for nor applicable to residents of the UK. Cryptocurrency CFDs and spread bets are restricted in the UK for all retail clients.

Possibility of uptrend The uptrend is expected to continue until the specified resistance level. Then, based on the behavior of the indicator within the resistance level, possible scenarios are identified.

DXY 15-Minute Technical & Fundamental AnalysisDXY 15-Minute Technical & Fundamental Analysis
DXY has reclaimed momentum, trading at 99.300, after strong U.S. economic data and a hawkish tone from Fed officials signaled policy stability — boosting short-term confidence in the U.S. dollar. On the 15-minute chart, we’re seeing a bullish structure reinforced by clean liquidity manipulation and institutional flow.
Price confirmed bullish intent after breaking above minor key resistance at 99.250, triggering a wave of buy-side momentum. A brief liquidity hunt below 99.250 followed — a textbook manipulation phase — before buyers stepped back in.
DXY then formed Higher Highs and Higher Lows, indicating a well-supported uptrend. Price is now sitting inside the liquidity zone, where smart money often positions for the next leg up.
📊 Trade Setup
📍 Area of Interest (AOI): 99.140 (Buy Limit)
🛡 Stop-Loss: 98.990 (Below liquidity grab and minor support)
🎯 Take Profit: 99.610 (Next minor resistance / 1:3 RR)
This setup aligns with institutional behavior, offering a high-probability entry for short-term trend continuation.
📰 Fundamental Outlook
🇺🇸 USD Strength Backed by Short-Term Fundamentals
Resilient U.S. Data: Retail sales and durable goods orders beat forecasts, signaling economic strength and limiting downside for the dollar.
Fed Stays Hawkish: Policymakers have reiterated their "higher for longer" stance, reducing expectations for rate cuts and supporting the dollar.
Safe-Haven Demand: Geopolitical concerns and weak economic data abroad have driven flows back into the USD as investors seek stability.
Yield Support: Elevated U.S. bond yields continue to attract foreign capital, giving additional strength to DXY.
📌 Disclaimer:
This is not financial advice. Always wait for proper confirmation before executing trades. Manage risk wisely and trade what you see—not what you feel.

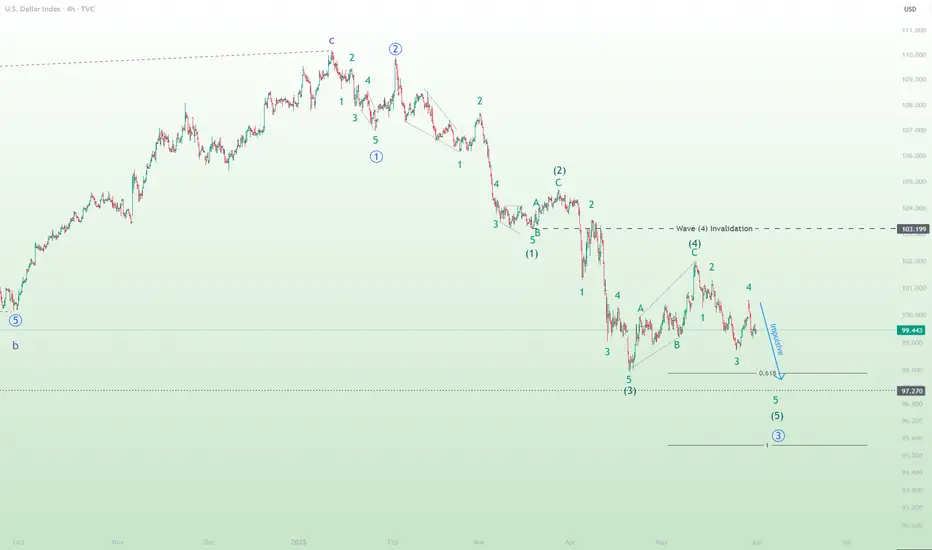
Dollar Index (DXY) Completes Correction, Resumes DowntrendThe short-term Elliott Wave analysis for the Dollar Index (DXY) indicates that the cycle from the January 13, 2025 high is unfolding as an impulse pattern, characterized by a five-wave structure moving in the direction of the larger trend. The decline from the January 13, 2025 high began with wave (1), which concluded at 106.96. This was followed by a corrective rally in wave (2), peaking at 109.88. The Index then resumed its downward trajectory in wave (3), reaching 97.92, before a corrective wave (4) rally ended at 101.99, as illustrated in the 1-hour chart below.
Currently, wave (5) is in progress, unfolding as another impulse in a lesser degree. From the wave (4) high, wave (i) concluded at 100.27, followed by a corrective wave (ii) rally ending at 101.259. The Index continued lower in wave (iii) to 99.33, with a subsequent wave (iv) rally peaking at 100.118. The final leg, wave (v), completed at 98.69, finalizing wave ((i)). The corrective wave ((ii)) unfolded as a double three Elliott Wave structure, with wave (w) reaching 99.87. Index then pullback in wave (x) to 99.48, before concluding wave (y) at 100.54. The Index has now turned lower in wave ((iii)). In the near term, as long as the pivot at 101.99 remains intact, the Dollar Index should extend its decline, potentially reaching new lows as the impulse wave continues.

Falling towards pullback support?US Dollar index (DXY) is falling towards the pivot and could bounce to the 1st resistance.
Pivot: 98.89
1st Support: 97.98
1st Resistance: 100.09
Risk Warning:
Trading Forex and CFDs carries a high level of risk to your capital and you should only trade with money you can afford to lose. Trading Forex and CFDs may not be suitable for all investors, so please ensure that you fully understand the risks involved and seek independent advice if necessary.
Disclaimer:
The above opinions given constitute general market commentary, and do not constitute the opinion or advice of IC Markets or any form of personal or investment advice.
Any opinions, news, research, analyses, prices, other information, or links to third-party sites contained on this website are provided on an "as-is" basis, are intended only to be informative, is not an advice nor a recommendation, nor research, or a record of our trading prices, or an offer of, or solicitation for a transaction in any financial instrument and thus should not be treated as such. The information provided does not involve any specific investment objectives, financial situation and needs of any specific person who may receive it. Please be aware, that past performance is not a reliable indicator of future performance and/or results. Past Performance or Forward-looking scenarios based upon the reasonable beliefs of the third-party provider are not a guarantee of future performance. Actual results may differ materially from those anticipated in forward-looking or past performance statements. IC Markets makes no representation or warranty and assumes no liability as to the accuracy or completeness of the information provided, nor any loss arising from any investment based on a recommendation, forecast or any information supplied by any third-party.
