HK33 remains mixed and volatile.HK33HKD - 24h expiration
Intraday dips continue to attract buyers and there is no clear indication that this sequence for trading is coming to an end.
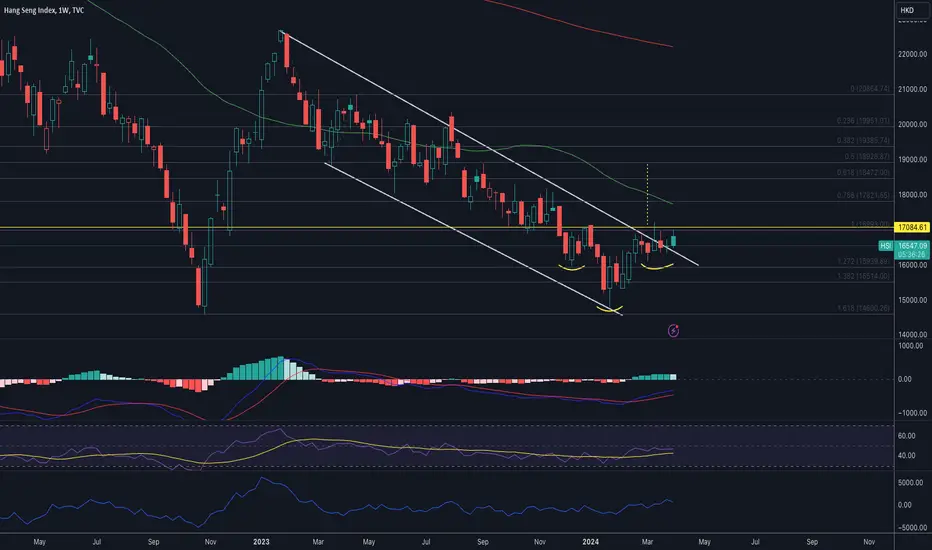
Trend line support is located at 16530.
Preferred trade is to buy on dips.
Trading within a Corrective Channel formation.
Risk/Reward would be poor to call a buy from current levels.
50 4hour EMA is at 16720.
We look to Buy at 16700 (stop at 16540)
Our profit targets will be 17100 and 17180
Resistance: 17000 / 17054 / 17150
Support: 16800 / 16700 / 16600
Risk Disclaimer
The trade ideas beyond this page are for informational purposes only and do not constitute investment advice or a solicitation to trade. This information is provided by Signal Centre, a third-party unaffiliated with OANDA, and is intended for general circulation only. OANDA does not guarantee the accuracy of this information and assumes no responsibilities for the information provided by the third party. The information does not take into account the specific investment objectives, financial situation, or particular needs of any particular person. You should take into account your specific investment objectives, financial situation, and particular needs before making a commitment to trade, including seeking advice from an independent financial adviser regarding the suitability of the investment, under a separate engagement, as you deem fit.
You accept that you assume all risks in independently viewing the contents and selecting a chosen strategy.
Where the research is distributed in Singapore to a person who is not an Accredited Investor, Expert Investor or an Institutional Investor, Oanda Asia Pacific Pte Ltd (“OAP“) accepts legal responsibility for the contents of the report to such persons only to the extent required by law. Singapore customers should contact OAP at 6579 8289 for matters arising from, or in connection with, the information/research distributed.
HSI trade ideas

Weekly Analysis - HK50This week has been a really slow with no clear direction. It closes with a doji candle.
For this week trade idea, It will be roughly the same as last week. Buy above 17101 and sell below 16127. If you want a more aggressive buy, depends how the first 4 hr candle closes, buy above 16906 is also a choice.

Tell your hedge fund to buy HSITell your hedge fund to buy Hang Seng Index and some Chinese stocks. Good returns will be coming in next years.

$HSI - Has been teasing a breakoutTVC:HSI It has been teasing a breakout. The only problem is 17000 resistance.
NYSE:BABA
Weekly Analysis - Hk50March has been a slow and low volume month. Looking for a weekly chart, we are ranging between 16773 and 16334. There is no clear sign of break thru to the upper or lower side.
For this month trade idea, I will set the range between 16127 and 17101. Once the daily start to close firmly above or below these two level, depends on the candle structure, we can then safely go for buy or sell, until then, I will stay out.

Hang Seng's rally seems stable for nowThe Hang Seng is nearly unchanged from where it started the year. Some of the strongest gainers of the index in recent days have been JD and Meituan. However, Tencent Holdings, by far the largest constituent, is down around 20% since January. The latest earnings season in China wasn’t stellar although negativity has arguably been overstated in some media this quarter.
The long-term trend is definitely down, but on this daily chart there are some positive signs. The 20-day SMA golden crossed the 50 from Bands late last month and the 50 also seems to be about to move above the 100. It’s probably going to be very difficult to break through 17,200 because that’s the confluence of the 200 SMA and the latest closing high from 12 March.
In the context of the bounce since 23 January and the slow stochastic close to the zone of selling saturation, the current period’s engulfing candlestick seems cautiously positive. However, it’s normally less risky to wait for such a pattern to complete before acting on it. No significant earnings are coming up next week, so technical action is likely to dominate apart from around Caixin PMI on Monday.
This is my personal opinion which does not represent the opinion of Exness. This is not a recommendation to trade.

HSI Short Update: 28th Mar counts updateI've published the short idea for HSI on 18th Mar and this is how it has gone since. I've updated the counts to what I think are the waves that unfolded since. Simply put, the next move is down.

Bull flag forming in Chinese equity marketBull flag forming in Chinese equity market with pointed target mapped in case we see a breakout

Hang Seng index long term time cycle analysisThis is my time cycle analysis on the Hang Seng index. The index is basically dragging along its 30+ year channel bottom, approaching the trough of the green cycle between June-August of this year. This time region is highly likely to produce a tradable bottom, if not 'the' bottom. Unfortunately cycle trough timing zones only give us entry points for swings, whether it ends up being 'the bottom' is to be determined once we get there along with other charting indications.
Note: ALL charts, SPX/NDX, HSI, and other major indexes have a double trough region in 2028 and 2029. It will be interesting to see what happens there.

RR=4 buy ideatrend strongly bullish + bullish gartley pattern + price at support level + RSI divergence
expecting the price to retest the 17000 level
PS never risk more than 2% of your capital per trade

Weekly Analysis - HK50Last week, HK50 close back into the range as bearish. This week, pay attention to the two crucial level, 16369 and 16127. Overall structure from weekly is still bullish as long as it doesn't break the two level I mentioned.
For sell, the safest sell will be if 1 hour and 4 hour starts to close below 16127. There is plenty of room to go back down to 15450.
For buy, since we are now in the range between 16805 and 16369, it will be best to consider buy once the candle close above 16805. The overall TP can be 17614.

HANGSANG INDEX, Kindly do your own studyHangsang Index has made major breakdown of 2008 trendline. But at the same time its not made a new low. If price goes above broken trendline and sustain, there might be a reversal sign. There may be great opportunity to invest in it, if there is a reversal.

HK50 / HongKong50 Bullish plan to RobberyOla Chicos,
This is our master plan to Rob HK50 in Bullish side am currently Looting some profits in Hongkong50. Guys U can enter at any time any point before the high voltage electric trap area, Our target is Trap area. We can escape before the area its very safe.

Bullish position trade on HSIShorter term EMA20 crossing over longer term MA50.
Steady recovery for awhile, suggesting that the trans continues until at least the MA200 mark.

Hk50 Ranging againYesterday market is pretty slow with no clear direction. One thing to note, 16805 now become another strong resistance level as it's been rejected multiple times from a higher time frame. Thus, it will take a pretty strong volume push before we can start seeing the bullish trend again.
As for sell, since we are still in the middle of a range between 16805 and 16369, it will be tough for sell. My sell idea remains below 16369.

HKIND Frenzy Will the Hang Seng rise from the ashes?The impact of several Chinese economic indicators has pushed the Hang Seng index higher, albeit with mixed results: while retail sales, industrial production and foreign investment data beat expectations causing the index to correct higher, the unemployment rate showed a slight increase of 0.1% from the previous one. The anticipation of this week's meetings of the US Federal Reserve and the Bank of Japan are crucial to define the trend in China and the region as a whole. However, corporate conflicts such as those related to TikTok and Fisker's bankruptcy on the NYSE have weighed down the index, leading it to a significant drop losing 3.84% from its price of 17194.50 to 16534.06 points. Despite this, the electric vehicles and batteries sector which weights very heavily on the Hong Kong index has shown some resilience, contributing to a slight rebound of the index by 0.4% in the current session.
In terms of technical analysis, the chart reveals a bearish construction trend since last year due to multiple economic scandals in China, highlighting the real estate and banking scandals. However, since January, the price has shown signs of recovery recovering quotes from December 2023. This could mark an index that is more undervalued than it really should be and a perceived depreciation in excess of the real value of the companies that make up the index. The RSI currently stands at 49.38%, indicating a possible reversal to the upside. The price bell signals a checkpoint at 19437.89 points, suggesting a possible return to that zone in the long term. A Chinese economy that has shown 5% growth versus the US economy that only grew by 2.4% in an environment of slowing consumption, for a country heavily dependent on exports, is growing at these rates due to its high domestic demand.
If we stick to the short term analysis, a wedge analysis suggests a top at 17187.53 points, with a short term target that could take the index to the price zone of the previous range around 18393.53 points. However, if this pattern is not confirmed and the index continues its downtrend after reaching 17187 points, the support level would be looking for its support zone at 14693 points.
Ion Jauregui - AT Analyst
**********************************************************************************************************
The information provided does not constitute investment research. The material has not been prepared in accordance with the legal requirements designed to promote the independence of investment research and such should be considered a marketing communication.
All information has been prepared by ActivTrades ("AT"). The information does not contain a record of AT's prices, or an offer of or solicitation for a transaction in any financial instrument. No representation or warranty is given as to the accuracy or completeness of this information.
Any material provided does not have regard to the specific investment objective and financial situation of any person who may receive it. Past performance is not reliable indicator of future performance. AT provides an execution-only service. Consequently, any person acing on the information provided does so at their own risk.

HSI Short: Alternate Bearish CountMy last analysis for HSI was a bullish call. Since then, the move for Hang Seng up move hasn't been that clean and I thought that it is time for me to publish the bearish alternate count.
As should be clear, I have termed the up move as a triangle, and thus expecting a move down at least to the low made on 22nd Jan.
Note: I have linked my bullish breakout analysis here.

Weekly Analysis - HK 50Last week, HK50 finally tapped 17100 level but it retracts back to 16700 level to close the week. This week, based on the 1 hour and 4 hour time frame structure, it looks like we are starting to form a bearish structure with a lower high and lower low. I will need more confirmation that we are heading back down, thus my sell level remains at 16369. Once that level breaks, we will go straight to 15900 level.
For buy, it might be tough to enter buy as there is no sight of higher high and higher low just yet. I will wait for the 1 hour candle to start closing above 16880 level before considering a buy position

Buy or Sell - HK50As discussed yesterday, the previous daily close right at resistance level of 17101, after a top wick, it ended up close back into the range below 16800. For today analysis, I am skeptical about the continuation of bearish candle. The reason being is because, if looking back at the last time, January 2, when it closed at 17101 and rip back down, the previous couple days leading up to it were not as bullish compare to this bull run. Second of all, although the daily did close below 16800 level, it was not as strong bearish candle closure compare to Jan 2 this year.
Thus, I will only consider a sell at 16369 which is also the weekly candle flip. As for buy, once it the 1 hour candle close back above 16972, I will consider entering a buy, eyeing TP of at least 17101.

HK50 - Trade with cautious Yesterday, Unfortunately, it did not drive up as much as I expected to be. The daily actually close right at resistance level of 17106. Overall, I am still bullish for the week, eyeing at least 17400 level.
Trade idea for today, the reason I mentioned to trade with cautious is because it closes right at resistance level. There is a possibility of a gap open to the down side before it drives back up. Thus, I will wait for at least the first hour candle to close above that level before entering the buy

Hang Seng Index: About to bottom; large up move coming in wave 3Hang Seng Index has been in a downtrend for last 4-5 years. The index bottomed in Oct 2022 when China uplifted the COVID restrictions. It has been correcting the first swing since last one year. The index is approaching a critical Fibonacci level where the wave 2 should end. The level has high correlation with the multi-year trendline as well.

Make or break day - HK50For those that watched my analysis the past couple days, Congratulation! It was a pretty easy set up for a buy once the candle close above 16843. For today, we are finally back to the initial level I mentioned awhile ago.
Whether if HK50 can break and hold above 17100? If it does, then we can sort of say we have now break the bearish trend and can look for more bullish sign toward 18000 level.
Today trade idea: 2 ways to look for buy. If the first 15 mins candle first open with a gap to the downside then flip bullish, we can look for buy until 17430. If it opens right away with a bullish candle, I will wait for the first hour candle to close first, once it forms a bottom wick, I will enter a buy when it breaks the previous 1 hour high.
For sell, it might be little bit tough at the moment, as the candle can easily reject at any moment. Thus, I will be cautious for the sell until I can see confirmation of closing below resistance level

A significant bottom has formedAn inverse head and shoulder has formed and a break above the previous pivot will be the first confirmation that the Hong kong index has bottomed
