HK 50 Buy Trade SetupStrategy: Power move to the Support Area - Potential bounce back
Risk/Reward: 1:1
HSI trade ideas


HK50 high probability Short Term SetupINSIGHT:
--------------------------
- Retest the TC red line
- Vwap resistance zone
- 10Y yield back to pre U.S. CPI
(not good for indeces)
- Still the same slowing down data for China, including the CPI

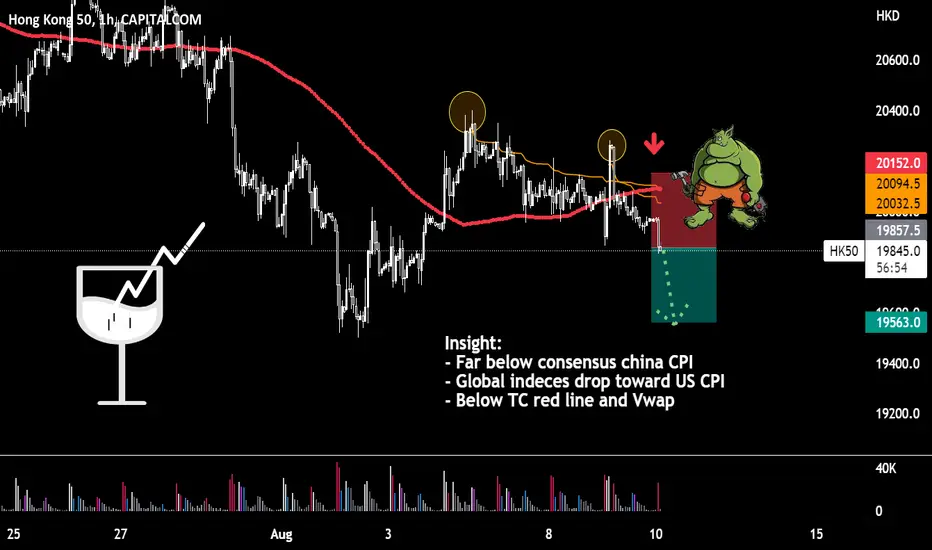
HK50 Short Term 1:1 setupInsight:
- Far below consensus china CPI
- Global indeces drop toward US CPI
- Below TC red line and Vwap
There's something about ChinaC H I N A - There's something about China.
They like number go up. So do we.
Case closed.

1995 -- 1996 Third Taiwan Strait Crisis and HSI PerformanceHSI Performance during the 1995 -- 1996 Third Taiwan Strait Crisis

1995 Third Taiwan Strait Crisis and HSI PerformanceHSI Performance during the 1995 Taiwan Strait Crisis, from July 1995 to November 1995

Hong Kong Stock Index (The mass gets tricked)Sell on Rumors.
Buy on News.
The market turns green when Nancy finally touch down Taiwan.
Hahaha.
This is the market for you.

HSI or HK50 targets to 19000/17500/14200?Three possible outcomes and worth to check it out one by one.
Short term parallel channel (black) 19,000
Big triangle breakthrough from 20,500 to 17,500
Long term parallel channel (grey) 14,200-14,500

Long-term Technical Analysis Using Elliott Wave TheoryCaution Elliot wave theory involves the subjectivity of the analyst, so the prediction and analysis may differ from the truth.
Ending diagnostics, starting with Impulse Wave 4, typically return prices to extreme levels
Also, at the same time as the two long-term log trend lines were broken, the Fibonacci 0.382 level was also broken
If the breakthrough is successful, the macroeconomic perspective also indicates that there could be a war that has a huge impact on the economy
Thank you for reading it. Have a great day!

Asia market not looking hot, could see the biggest bear marketMonthly chart all pointing lower.... China is def in a recession, bear paradise for the long term


HSI should prepare for a drop.be careful trade in HSI with long position. from the chart pattern and analysis possibility high in short side.

Long on HK50?This is a trade i'm currently in.
I dont really trade this market but im going to give it a go.

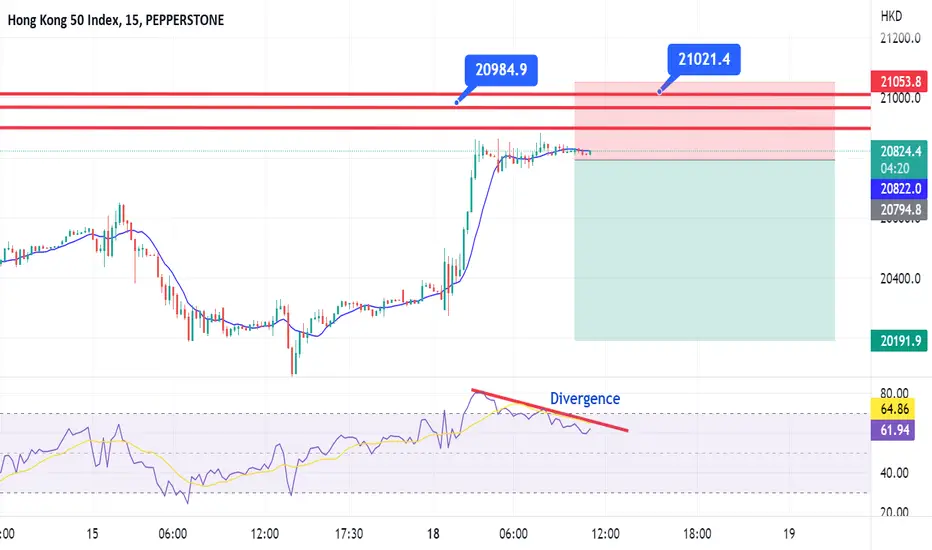
HK50 Selling opportunity right nowThe H4 and D1 trend is a clear down.
The price is inside the H4 moving average.
M15, M30, H1 is all overbought
M15 divergence present
Stop-loss above 21150
If you understand this chart, you are not bullish for markets.If you understand this chart, you are not bullish for the U.S. / World Markets - (Opinion)
So I watch a lot of indexes for research purposes and fun honestly. Seeing how different sectors of finance move when fundamental, sentiment and technical news influences them has always been interesting to me. Recently while researching I came across a chart that made my heart sink. I never really experienced this in my life, as I've been studying monetary policy and trading for years at this point. This is the Hang Sang Index put up in contrast with the DOW Jones Industrial Average. Before you read this article do you know why I'm mirroring these two indexes? What assumptions can you take from these charts? Can you predict any high probability assumptions from your conclusions?
Let me break this down from a first principles perspective, which is the way I love teaching the most.
When looking at markets, the price action is moved through supply and demand. Especially when looking at indexes of these sorts, as they are largely referenced from the GDP (Gross Domestic Product) of a country, along with many other factors, of course.
When we look at these two indexes we notice that the HSI is slightly trailing the DOW over most of the time period. Why is this? It's because China is the worlds largest, supplier and conversely, the U.S. is the worlds largest demander. An assumption we can make here is that in more cases than not their markets move first due to this factor. This makes sense though, the west cannot generate a profit unless it has the materials for the goods and resources it wishes to produce and we need to pay before we receive those resources, in most cases.
So what can we extrapolate from all of this information? Well, HSI could in some cases be a leading indicator for the DOW and how the American markets will move and this can be confirmed on a macro level in this chart. Most of the major market crashes over the last 2 years can be viewed on this chart and if I had more data (Trading View) only had D going back to 2019) I'm sure I could show you much more correlation to these charts.
What's most concerning is where our markets and also geopolitical landscapes our markets are currently involved in. With supply chains breaking down around the world on continental size scales the availability and in some cases the sanctions being implemented around the world has thrown into effect one of the largest global financial crises I think we've seen in well over 250 years. Now this is why I wrote opinion on the top, because going back in the American Markets, the closest thing in the last 100 years I could put this into perspective to is of course, the Great Depression. Not to be confused with the Great Recession of 2008. I am saying I believe this is WORSE than what we've seen in over 100 years.
The U.S., EU, China and Russia's economies are making it increasingly difficult for free and fair trade around the world and we can see this in the large economic collapse we've seen since the end of 2019. The World Reserve Currency is now being attacked by several continents and it is safe to say the currency wars how now started between nations. You can see this in what many world economies have done to destabilize the U.S. Dollar. Things like the first time Russia defaulted on their debt in over 100 years. Chinas entire financial system in one of the worst shapes it has been in, ever. They are also "not able" to pay back a large amount of their debt to us in a U.S. Dollar amount. Tables are turning and this is why in America, they are seeing supply chains of their own breaking down. Prices of all of their commodities, goods & services skyrocketing. Cost of living in general becoming so expensive that repo and default rates are at decades long highs.
The decentralization of American goods & services was one of its best and worst ideas ever. It was amazing because it was able to outsource the materials and people it needed to create one of the largest market systems the world has ever known, but it's key to working is in the fair trade, positive affiliate and respect between the buyer & seller that makes that possible. When in a war-time economy as I believe we can safely say we are in, all chips are off the table.
I hope you understand what I'm trying to say here. Just a thought that's been on my mind the last couple months. I wish everyone peace love and prosperity <3 - Watson

HK50 is need of direction - levels to watchChina has been performing well of late as capital flows towards the geography with the most accommodative central bank and increased liquidity. After a solid rally from the mid-May lows were seeing the HK50 print a series of lower lows and highs, although the wicks are getting longer suggesting there is still solid buying pressure into weakness. We see the price now curbed at the 20-day MA, ahead of the rising TL support.
Our analysts see the TL holding for now, with a renewed push into 22,310 offering increased confidence of a push higher and the potential for trending conditions. An upside break of 22,100 would give this call increased confidence. If the TL gives way, we see double top neckline support at 20595, where a break here targets the May lows and even 18,850.
Levels to guide on the daily timeframe

China is not a safe haven from SPXYeah no. Long term TL is being challenged and price is at important reisstance on the RSI, MACD and price support turned to resistance. Confirmation should come soon for the next leg down.

JICPT| HSI Bullish pullback setup on the dailyHello everyone. It's been days to revisit of Hang Seng index.
On the daily chart, we can clearly see that downtrend has been terminated with serious of higher highs and higher lows. As HSI has been down for almost 3 year, it is probably the worst performing stock index in the market. An economic recovery of mainland, as well as inspection completion of the tech giants may attract buyers come in. The valuation looks really attractive. In addition, mean reversion is another reason that I'm bullion on the index.
Technically, index may revisit the uptrend line which is coincided with a nice demand zone.
What do you think? Give me a like if you're with me.

Rise of the Chinese EmpireHello friends. Ray Dalio does a great job of explaining why the USA is going to be crushed by China over the following decades in his video "Principles for Dealing with the Changing World Order" www.youtube.com
If the Chinese bubble plays out in a similar way to the USA bubble, it could look like this. The time measurements and price increase percentages are both taken from the SPX.
Thanks for playing.

Will HSI finish strong for Q2?2 weeks ago we discussed why the HSI:HSI rebound rally would be slowed by profit takers (). The choppiness in the index we saw for the past 2 weeks was also due to the discrepancy between the China and US equity market. While the SSE Composite SSE:000001 still held above 3300 level, the US equity indexes all broke through the 2022-May low due to the increasing worries of inflation and recession risk. Hong Kong as a market sitting in between the east and the west taking different messages from each side, fluctuation is inevitable in such a situation.
Strong rebound in the US equity market last Friday
In the recent Friday session (Jun-24), the US equity markets showed a strong rebound and paired back most of the losses from the past 2 weeks and stood above the May-2022 low again. That means the breakout to the downside we saw last week is likely to be a false breakout. While the main direction of the US equity market is still downward, it could take a break at this price level (to accumulate more energy before diving further). This break also means alignment between the US and China markets, which create the necessary condition for Hong Kong HSI to continue the rally to the upside.
Xi Jinping is joining the HKSAR 25th anniversary event
Next Friday, July-1 is the 25th Anniversary of the establishment of the HKSAR (also known as reunification with China). Last week Xi Jinping has confirmed that he will physically attend the anniversary event , which marks the first time for Xi to step out of mainland China since Covid outbreak in 2020. This gesture re-emphasizes the importance of Hong Kong to China.
Reopen to revive Hong Kong Economy
Back in early June the Liaison Office of Central People’s Government (LOCPG, Beijing’s main body overseeing Hong Kong) had hosted a meeting with foreign business chambers to collect “suggestion” and “advice” on how to revive the Hong Kong business environment. All chambers had expressed that the existing quarantine measure is the biggest roadblock for local business. With the new chief executive of Hong Kong, John Lee coming onboard next month, all eyes will be on him to iron out the reopening details of Hong Kong with mainland China and the rest of the world. Personally I am optimistic about the relaxation of quarantine measures as soon as the coming Q3. Reopening of Hong Kong is actually a one-stone-two-birds move for China. First, it can serve as a welcoming gift for John Lee from China, to help him rebuild trust between the government and the people in the city. Second, reviving Hong Kong economy, especially its financial market, is one of the crucial steps for China to save its downturning economy. I believe the announcement of the reopening would be one of the major events in Q3 that send the Hong Kong HSI Index to the upside.
Technical Discussion
HSI index retested the 20 days and 50 days moving average without going through, reconfirming the support at these levels. The strength also pulled the 20 days moving average above the 50 days creating a bullish technical signal. If we follow the upside rally narrative, below are the levels the index must break through to confirm the sustainability of the trend:
22142: 09-Jun, choppy zone peak
22523: 04-Apr, rebound peak from market plummet in Mar-2022
However, one needs to be extra cautious if the index drops below the low of the choppy zone at 20697 again , as this would mean the rally narrative discussed above is still premature. Long positions in the index as well as other Hong Kong listed stocks should be trimmed partially for risk management.


1:21pm HSI WEEKLY CHART TIMING PREDICTION HSI WEEKLY chart, shown a Bullish TR weekly with 5 pivots/
time prediction rise till first week of august
