HSI trade ideas

The Ending of an Era - HSIOriginal Chart This is Based Off
2018 update
Original Trade Strategy Around This Chart
Everything should be self explanatory in the chart. Of course - this will work until it doesn't, but since the 1990, the HSI index hitting its upper resistance line has nailed every major global market top within a very short timeframe. You can see how perfect this has timed markets with the correlation to the SPX index in the lower chart. Hypothetically speaking, when you would hit the upper resistance line, you would short emerging markets to hedge against whatever is about to happen. Then when this hits the lower resistance line, you would go long major market indexes until you arrive back at the upper resistance line (SPX, etc).
2022 - End of an Era?
As most can see, this chart is a very very long narrowing wedge / channel. The volatility between drawdowns and rises was far greater the further back you go, and the drawdowns have all been proportionally smaller as we narrow within the channel bouncing off top and bottom resistance (and sometimes in between). With that said, narrowing channels like this indicate increasing fragility of the trend, and potentially suppressed volatility. Eventually, something has to give, and this will break the long term pattern.
I believe we're close to that point, and that's not a good sign for asian markets. I don't know exactly what would happen if this breaks to the downside, but I don't think it would be pretty. Stable systems such as this have a way of becoming extremely chaotic when the stability breaks. Chaotic markets = drawdowns / crashes, and given the current state of Chinese markets and politics, this shouldn't be too surprising that it could be possible. The ongoing Chinese real estate crisis is just getting going, and the party has so far remained committed towards deflating their real estate bubble. Fundamentally, Hong Kong is just as bad if not worse than China from a real estate speculation / valuation perspective, yet there are additional problems in HK with people fleeing the territory due to the Chinese takeover following the 2018 protests. Demographics are strongly against this market, valuations are strongly against this market, and the current economics of this look rather dire without any major positive windows into future development / growth.
From a technical perspective, this is also far weaker than every other time it's hit the bottom resistance line. Note that every other instance we hit the lower resistance line, we also were hitting the lower monthly bollinger band at the same time. Not included within the chart, but momentum indicators also are showing a lot of negative divergences. You can see this from simply looking at the chart and noting the covid recovery bounce has been far weaker than every other post-lower boundary recovery bounce. We didn't even make it up to the middle resistance line before retesting.
My guess and view is that this won't break easily, but it will break dramatically. I think there is a good chance we see another rally here back towards one of the resistance lines, but after that, momentum will have really worn off. I also think we could chop around the lower resistance for a while, but ultimately, we are likely going to break down here on a secular basis. Maybe Kyle Bass will actually be validated after being wrong for 10+ years (except he's probably already been stopped out of all his poorly timed trades)?

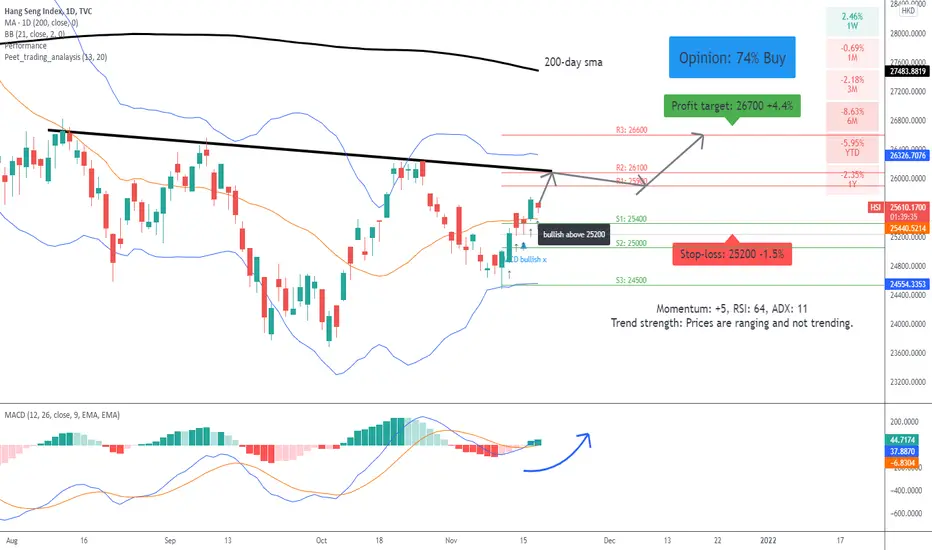
Hang Seng index: upward potential?A price action above 25200 supports a bullish trend direction.
Upside price momentum supports the bullish trend.
RSI leaves enough room for further upside price potential.
MACD bullish crossover also remains applicable.
HANG SENG one of very rare indexes which is not a bubble. Hong Kong - Hang Seng is in a falling trend since long ago. This shows that investors over time have sold at lower prices to get out of the index, and indicates negative development for the market. An inverse head and shoulders formation is under development. A decisive break of the resistance at 26051, ideally with an increase in volume, signals a further rise. The index longterm bullish forecast for the next one year is 33500 . The index is overall assessed as technically oversold. ideally expect medium long term growth. on the other hand if things went sought for China expect this to hit 20,000 before any reversal.
Important note: these are my personal thoughts and they can be wrong. I'm not a financial advisor. but if you are willing to buy this, expect 50% growth on ur investment for the next 12 months from now.
let me know about ur thoughts will it go back up ?

Hang Seng.....First legs of an impulse?Hello Traders,
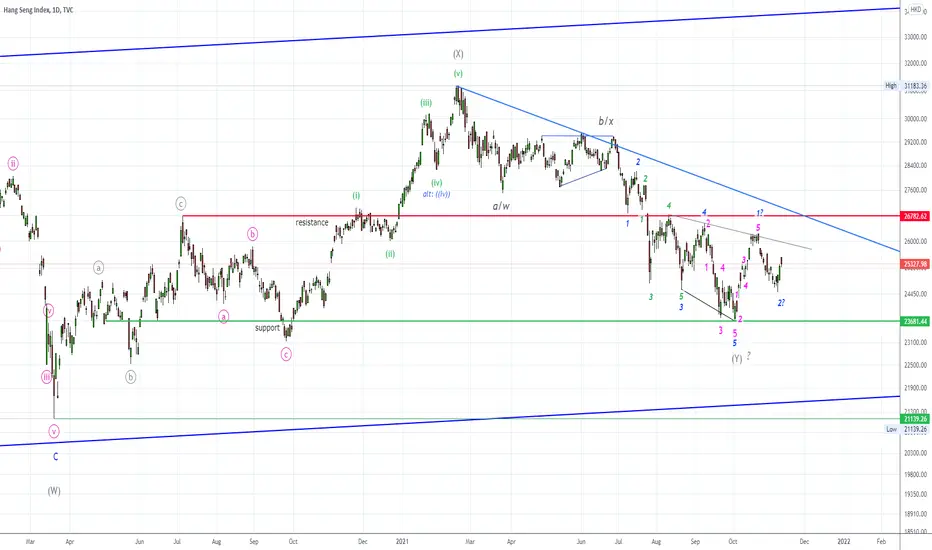
HS made a low on October 5,at 23681.44 and start a 5-up to 26234. This could be a wave 1 and the following correction a wave 2 or a part of wave 2!
So, from this view, the „Mob“-level is at the low 23681. A break of this low will open the door to 211xx area!
But if HS is able to rise, in an impulsive move, above 26234 it has the chance to extend to 28892 at minimum. At this level, it could touch the range of the wave b/x high at 29394!
A decline below 24259-24206 on a daily close will eliminate this count!
After a two-years lasting bear market, HS has a long way to go, to return into a bull market. Right now, the odds are not given. So any counter trend move to the upside is one in a bear market! Watch this!
Have a great week....
Ruebennase
Feel free to ask or comment!
Trading this analysis is at your own risk!
HSI in a long term bullishtest1..........................................................................................................................................................................

HANG SENG - Long Term viewHang Seng topped in 2007, retested the high in 2018, and is now headed for the retest of previous lows. Two lost decades?

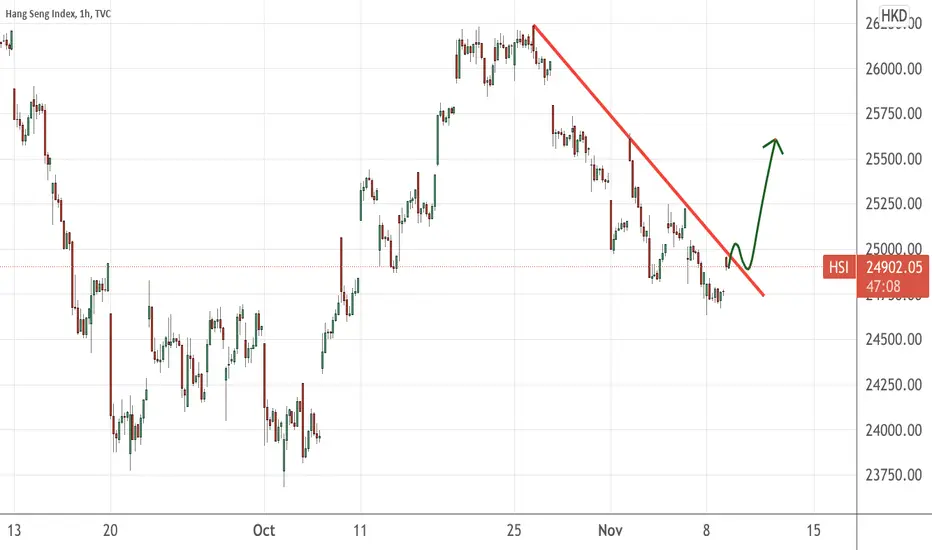
Awaiting for HSI breakout - bullish patternwatch the 1H chart pattern
Year end boost - 11/11/21 Singles day, Christmas, etc
Hang Seng.....Wasted time!Hello Traders,
Hang Seng hasn't made any net progress since September 2020! It is bouncing around, up and down, and it is continuous his bear market, that have started in 2018.
Since the ATH @ 33484 HS has shown a nearly 0.786 Fibo correction to even the zone of 20806! The final low in this move down was at 21139.26!
Since, HS was not able to create a new impulse again, and so, the facts are becoming increasingly clear that the move up from this low is a countertrend in a bear-market!
If you are watching the „inner“ trend line (blue) that is connecting several lower highs (watch the red arrows), this line has become more and more important, `cause HS was not able to put this resistance out of the market! As long as HS is trading below this line, the trend is focused down.
So; a break of the possible of the wave x of ((c)) low, will open the door to the wave ((b)), (grey), low @ 22519! Breaking this, will set the stage for a test of the 21139 level! More bearish potential exist in this case!!
On the other hand! A break of the lower red trend line should open the door to the blue one. Above that level the door should be open to close the open gap from trading on the week of July 19-26, 2021!
One more note!
Watch the behaviour of price after HS has touch the red trend line (higher level)! Price declined to fresh new lows after. This could happen once more right now!
Have a great week.....
Ruebennase
Fell free to ask or comment!
Trading this analysis is at your own risk!

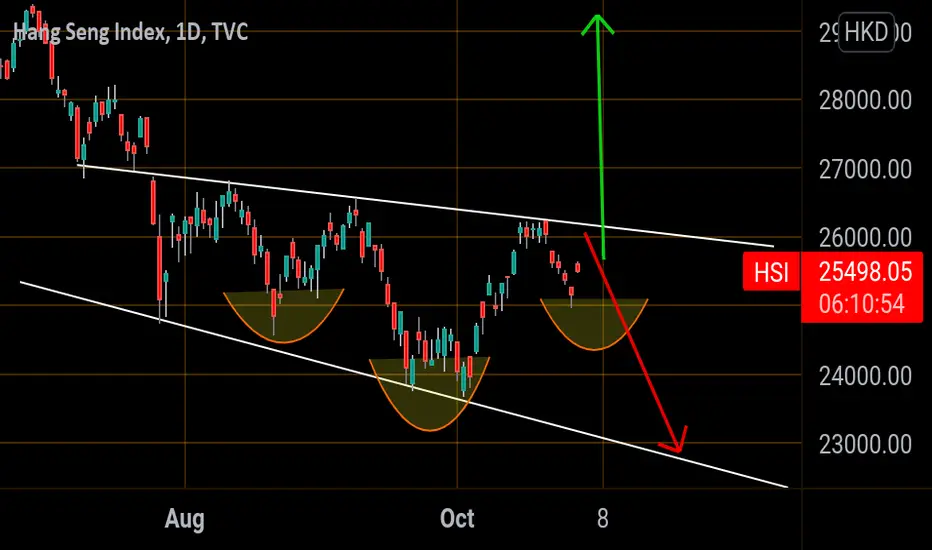
Inverse head & shoulder, price pull back to Fib 0.618 level, BuyInverse head & Shoulder and price also pull back to Fib 0.618, looking for reversal signal at smaller time frame and buy. Aim 27000

Hang Seng Index This is a chart of the Hang seng Index (HSI). It looks like the might be forming a Inverted H&S similar to what our spy did last month.
As you know
BABA
JD
PDD
NTES
stand to benefit from this bullish move if it plans out
HK50 THE CHINESE NEW YEAR BULL IS ROARINGAlot of patience is based in this setup
The major indicies sp500, us100, DOW, FTSE etc. has made serious gains the last 18 months
Even though the evergrande crisis became publicly know whe hk50 was at it bottom it did held op and made massive support at the area.
Today we saw our first higher time frame trend reversal - it could offer a bank stuffing trade because it has more than 20 pct to last top.
I like what i see and is willing to take the risk - are you?


HSI potentially is up or down? HSI now is potentially can up to 26800 and from there can will got chance to rest and down....
be patient for it to have a short rest before it really going up more

HK 50 I don't mean a thing if it ain't got that swingMarket phases - Price Action
The market can only go in three directions:
1. up,
2.down,
3. sideways.
With high / low defined, we can use several charts to identify these market phases and start a simple search for our Swing Highs and Swing
Lows.
In short:
• the market rises when price makes higher highs and higher lows.
• the market goes down when the price makes lower highs and lower lows,
• The market goes sideways when price does not make higher highs and higher lows or lower highs and lower lows.
It may sound childishly simple, almost like stating something obvious, but
you will be amazed how often people forget these simple facts. One
the most important question is: "Where is the market going?"
sequence:
The change of direction is confirmed when
the price is rising above recent highs
(as seen in the chart above).
In other words, it is a reversal
1-2-3 - you go long (buy, eat) after
correction above pillar level

HSI: Prepare to shortAs shown in the chart, while there MAY be some upward leg still left in the "Pearl of East", the current setup favors shorting.

Hang Seng..... Test of resistance zone next?Hello Traders,
Hang Seng is trading below the two important zones which ranges from ~23700 (support) to ~26800 (resistance)! A break of both levels should have tremendous impact on the long-term chart picture!
Short term, I favour, that HS will run to the upper line of resistance at ~26800 area to re-test the level!
A break above that zone, should open the door to 27200 range, where an open gap has left by trading on July 23-26-2021! If this area should be taken off the market, the next challenge would be a break of the declining trend line (blue) that crosses 27200 zones on a weekly basis!
On the other hand! A close of the open gap at 25808 would open the door to 24800 range with more bearish potential if it should „fall“!
In this case, a test of the support range (green trend line) is next!
Have a great Sunday.....
Ruebennase
Feel free to ask or comment!
Trading this analysis is at your own risk!

What's up , China ?If we look closely at what the Chinese government have been doing of late, I would say they are indeed doing a great job for the people of China. From clamping down on the 996 working culture , stopping the fan culture online and drastically reducing the amount of tuition for kids........
Living in Singapore, we are not too much different. Parents with kids are also sent to a frenzy when weekends come. They act as chauffeur for their kids, sending them from one enrichment program to another islandwide, hoping to give them a better edge in life.
This article here prompted this Taiwanese entrepreneur to take things in his stride and created an eco-farm where his kids and the public can now enjoy and spend more time with nature rather than the mobile phone or laptop.
The big picture is to ensure the Generation Z and younger would have a life outside of their virtual world, parents who are slogging hard to make money would not feel so stressful each day worrying about their kids' academic results or extra curricular activities. And of course, down the road, I expect more benefits like maternity , paternity leave , cash grants , etc to be dish out to incentivise more couples to have more children.
The notion of "getting older before getting rich" is a concern for the Chinese government and they have to do whatever it takes to turn the situation around. Retirement villages , eldercare services are relatively a new concept in China unlike the US and Europe and it will take some times before we see a change.
And because of the "elitism" mentality, many parents are buying properties near the schools they want to enrol their kids. Government has also move in to rein the red hot booming property market and those properties around the school areas have witnessed a drop in pricing after the clampdown on the private education sector. Read article here
When reading the news daily ,it may appear that there is a BIG CLEAN UP by the government. Many industries have not been spared and I think more sectors will not be spared in the coming months.......


Chikou Span Breakout: Long HK33HKD (M30)Daily Chart: Price closed above Kijun.
Within the next few days, a bullish bias is expected.
M30: Long re-entry opportunity.
Buy conditions:
1) Chikou > price
2) All Ichimoku signs are bullish
3) Tenkan + Kijun + SSA + SSB + 200 EMA are all pointing upwards
4) Price > 200 EMA

Hang Seng..... Counter trend underway!
Hello Traders,
by Monday`s opening HS gaped to the upside and keep rising for the rest reminder of the week!
On a daily basis it look like a (not text book like) „morning star“.
If the high at 25437 will be taken out of chart, the door is open to 26560. As I wrote before, „step-by-step“!
A break of the possible „morning star“ pattern low at 24865 would release more bearish potential. May be to 24636-24543! Note the open gap that ranges from 242399-23966 (hourly chart)!
On the broader picture, you will observe the bear market, where HS is trading at. So, any pull back of the lows, could be „counter trend“ in this market.
Note!
A drop below the support zone @ 23697 could have tremendous impact on the midterm chart picture.
Have a great Sunday.....
Ruebennase
Feel free to ask or comment!
Trading this analysis is at your own risk!

Hang Seng..... Counter trend underway!Hello Traders,
NIFTY50 is on track to my price target @ 18453.
More bullish potential exist.
Any pull back that ends above or at 17436-17211 range is a corrective setback on lower degree.
A break of this level should open the door to 10756 and below to 16700 area!
While N50 is rising since the level of 17300 range without any stronger correction, the air becomes „thinner“ as long as the bull-run is underway.
So be prepared for a possible hard and quick setback!
I will update the count if my midterm price target got hit!
Have a great Sunday.....
Ruebennase
Feel free to ask or comment!
Trading this analysis is at your own risk!

Stocks - HSI Leads DownIdea for Indices:
- HSI is in something like an island top reversal. Was expecting a bounce to 20 DMA, but only seems to be getting 9 DMA and looking on the verge of collapse.
- This "bull flag" that it was in previously resolving in this way is a huge clue... as this pattern exists right now in so many important markets globally.
- China has already popped their bubble and will lead down, liquidity flows will be HSI > NKY > DAX > NDX > SPX. The deflationary wave is coming IMO.
Next leg down for HSI likely 19 or 21k. This may not translate fully to US markets, but at least should see the bottom of the risk range, so NDX 14k for this initial move. 7-15% correction from the top on US markets.
GLHF
- DPT
