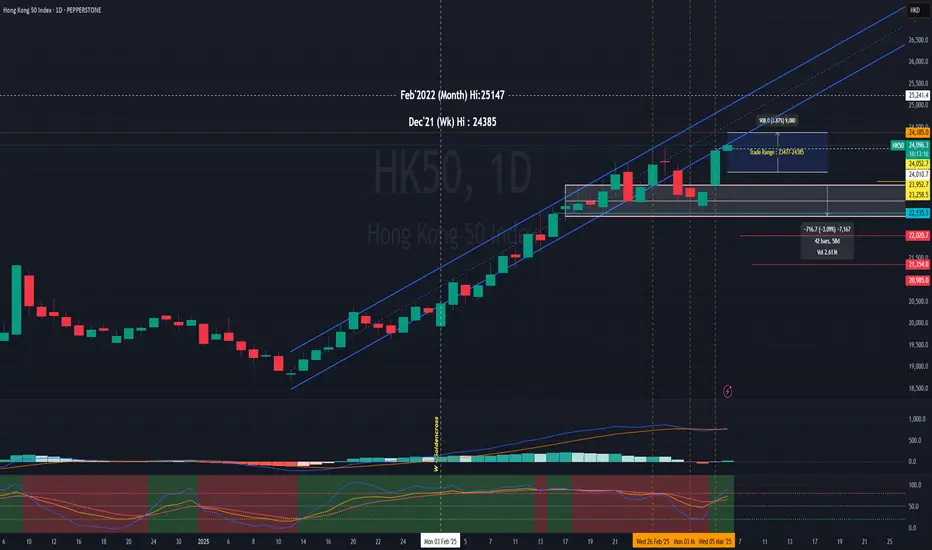
The Index seems hits the ceiling ;trade cautiously!Hello everyone, is Friday! Last trading of the week! This week has been a challenging one.
Hope everyone stick to the trading plan.
Trade plan is the same, buy into support and sell at resistance based on your trade tf.
4H Chart PEPPERSTONE:HK50
This morning the MACD seems has reversal sign although the GoldenCross form below zero line ,at least showing the end of the bear, monitor to confirm it's not a fake reversal. 🚨
As the D chart showed the Index still out of uptrend channel again as mentioned from previous post, as long as the Index out of the upper trend channel then the pullback is inevitable for the next wave.
However longer tf, it's still bullish which created higher high for thr W Chart. HSI:HSI
it would be great if this week could close 24669(last week Hi). But unlikely, what do you think?
Happy trading everyone.
** Please Boost 🚀/LIKE 👍,FOLLOW 🔔 SHARE 🔁 and COMMENT ✍️ if you enjoy this idea! Share your trading journey toencourage the trading buddies.
HSI trade ideas

HK50; Heikin Ashi Trade IdeaPEPPERSTONE:HK50
In this video, I’ll be sharing my analysis of HK50, using my unique Heikin Ashi strategy. I’ll walk you through the reasoning behind my trade setup and highlight key areas where I’m anticipating potential opportunities.
I’m always happy to receive any feedback.
Like, share and comment! ❤️
Thank you for watching my videos! 🙏

What's next for HSI? Hello everyone, how was the Monday strong pullback?
my short break did not stop the participation of the index slope down ski 😂 😂 😂
Hope everyone stick to the trading plan.
Trade plan is the same, buy into suppysel at resistance based on your trade tf.
4H Chart
Today probably a reversal happens but it could still in retracement mode., trade cautiously.🚨
As the D chart showed after the Monday 477pts plunged pushed the Index out of uptrend channel again as mentioned from previous post, as long as the Index out of the upper trend channel then the pullback is inevitable for the next wave.
However longer tf, it's still bullish which created higher high for thr W Chart.
it would be great if this week could close 24669(last week Hi)
Happy trading everyone and zen with 📚 and 🍵 once your SL/TP set.
** Please Boost 🚀/LIKE 👍,FOLLOW 🔔 SHARE 🔁 and COMMENT ✍️ if you enjoy this idea! Share your trading journey toencourage the trading buddies.

Hang Seng Index Short: Potential ReversalIf you have seen my previous posts on Hang Seng or the China/HK market, you will know that I am a long-term bull and sometimes short-term bear on the Chinese markets.
So, this post is really against my personal bias that the China/HK markets are long-term bull because if the wave counts are correct, the recent move up are but triple combinations corrective up moves.
Here, I present a short-term target for short with stop-loss above the recent high.
Good luck!

Hang Seng Index Reaches Three-Year HighHang Seng Index Reaches Three-Year High
A month ago, while analysing the uptrend in the Hang Seng index (Hong Kong 50 on FXOpen), we noted that:
→ Positive sentiment was driven by the success of the DeepSeek startup, boosting Chinese tech stocks and mobile operators.
→ Price movements formed a bullish structure based on Fibonacci proportions.
→ Analysts predicted the uptrend could persist until the second half of March.
Today, the Hang Seng index (Hong Kong 50 on FXOpen) surged above the 24,500 level for the first time since February 2022. According to Reuters, investor enthusiasm for artificial intelligence continues to fuel the rally.
Technical Analysis of the Hang Seng Chart
New price data support the construction of a large-scale upward channel (marked in blue).
From a bullish perspective:
→ The median line of the blue channel has shifted from resistance to support (as indicated by arrows).
→ The price remains within the intermediate purple ascending channel.
From a bearish perspective:
→ The last two candlesticks show long upper wicks—an indication that sellers are active, possibly locking in profits.
→ The RSI indicator is forming a bearish divergence.
Given these factors, the price appears vulnerable to a pullback. However, the future trajectory will largely depend on fundamental factors, particularly the ongoing tariff tensions between China and the United States.
Trade on TradingView with FXOpen. Consider opening an account and access over 700 markets with tight spreads from 0.0 pips and low commissions from $1.50 per lot.
This article represents the opinion of the Companies operating under the FXOpen brand only. It is not to be construed as an offer, solicitation, or recommendation with respect to products and services provided by the Companies operating under the FXOpen brand, nor is it to be considered financial advice.

oh wow, seems the Index has the wheel to run!Hello everyone! Happy Friday!
News📰 : anticipate more positive news to come (of course mixed with some -ve for retracement) 🔮
Look at the HSI D Chart
- posted 28Feb2025
- posted 3Mar2025
- 7March2025 at point of writing; the index trading above the support level of 23500 (the 28Feb2025 Hi); it tried to go back to uptrend channel and staying above! (broke on 28Feb2025).
Monitor the Trading volume: finance.yahoo.com
Avg past 3 months : 77.909Bn (+19.18% for the past avg vol); this imply the fund flow is abundance, hopefully this continues! Although the vol is slightly less than the last Oct 2024.
Look at the 4H chart
PEPPERSTONE:HK50
The HSI last Dec 2021 Hi @ 24385 is being tested again today!
Now, what's next? 25147, btw now and then Next level that we are looking at to break (oh wow! we need to add in past Higher Hi):
22840-22900
23241-23275-23314- 23471 (need to break above this level to change back to uptrend movement, else probably is gonna be sideways, continue to monitor and confirm)
23952-24101
24385
24586
24747
24800
25147
🚨 as of ✍️ :
Resistance : 24385 - 24586 - 24800. Let's monitor; this level is now being tested and see if breaks and staying above.
🗝️ support level
22750 -23535 (this level being tested few times; it's now became strong support level). Don't think this can easily broke down.
MACD - Goldencross was marked in Green (5Mar25)
KDJ - Remained at Bullish green zone since 4Mar25, the CFD is now in a short bullrun cycle.
BB - Still within lower BB channel and gap up trading at upper BB channel/
the Mid-line 4H chart at 22960-975 was corrected from 23320.
Trade Plan : 23477-24385 - 24751
Buy into support & Sell at resistance
the 1H showing it's now bullrun on the 2nd half of today. Ride on the waves and locked in your profits.
🚨🚨🚨 Locked your profits and watch out for reversal for retracement!
Monitor the 1H,4H movement with confirmation using MACD & KDJ indicator.
Set your tf, have your entry and exit plan!
Pay attention to the Goldencross/DeadCross; practice makes perfect.
Let's follow our own strategy and zen with 📙 and 🍵 for profits.
Happy Trading everyone!
🎯 Start to accumulate China & HKG for the potential upside for the year! All retracement is a good entry point.
🔎 DYODD and don't listen to anyone. Invest in yourself, do some study and learn along the way while you trying to verify or finding the answer if to start invest in CHN/HKG markets.
HKEX:2800 - 22.90-22.82 if it happens to retrace back to this level, otherwise anytime NOW is entry point! It's confirmed by the 200MA (above in W chart) ; also the W chart MACD GoldenCross. Cross-check it; if need helps let us know.
HKEX:2823 - 13.17-14.75 can start to open position and start accumulate, is allowed to wait for confirmation once it breaks 14.75 level. But you will be getting at higher cost...
HKEX:2801 - open position at price : 23.73-23.80 or anytime NOW! if ever retraced back to 23.36-23.66 accumulate more.
HKEX:3067 - open position now, add position when it retraced to 11.63,,11.33 or below. If you have missed, you may tk position still good to start at 11.85,11.99,12.15
** Please Boost 🚀/LIKE 👍, FOLLOW ✅, SHARE 🙌 and COMMENT ✍ if you enjoy this idea! Share your trading journey to encourage the trading buddies

GPS recalculating, HSI is finding its way back to the bull routePEPPERSTONE:HK50
D chart : it tries to returning into uptrend channel.
HSI:HSI
D Chart
We look forward to see it at 24192, 24385! Let's continue to monitor.
W Chart PEPPERSTONE:HK50
in 1H 4H chart mentioned the Index is intact and in the Bullish runway!
Look at longer term and trade zen-ly!
Cultivating and nurturing your trading mindset:
Pay attention to your trading strategy becoming a great trader but not profits from one trade.
Happy Trading Everyone.
** Please Boost 🚀/LIKE 👍, FOLLOW ✅, SHARE 🙌 and COMMENT ✍ if you enjoy this idea! Share your trading journey to encourage the trading buddies *
National People's Congress: Boosting China's EconomyThe National People's Congress opens this week as one of the most eagerly awaited events, with the market on tenterhooks over the possibility of stimulus measures to boost economic recovery. During this meeting, Chinese leaders will discuss measures aimed at strengthening growth, controlling deflation and providing crucial support to the real estate sector. As part of these deliberations, a potential increase in public spending is on the horizon, an action that could boost various productive sectors and generate a positive ripple effect throughout the economy. In addition, boosting innovation, particularly in the field of artificial intelligence, is emerging as a key strategy. Renowned technology companies, such as Hua Hong Semiconductor and Tencent Holdings, have made remarkable progress, but the challenge is to maintain this pace in an environment of increasingly fierce global competition. Boosting domestic consumption is also a priority. The authorities seek to implement policies that not only stimulate demand, but also strengthen strategic sectors, such as the automotive and household appliances sectors. Well-known manufacturers, such as BYD, Geely and Haier, could benefit from these measures, which would translate into a virtuous circle that favors the stability and growth of the domestic market. On the other hand, the real estate sector remains one of the big question marks. There is speculation about the possible issuance of approximately 800 billion yuan in local bonds to support developers. This initiative, if it materializes, could provide needed relief to companies in the sector such as China Vanke and China Resources Land, helping to counter the uncertainty that has characterized the market in recent times.
Technical Analysis Hankg Seng (Ticker AT: HKInd)
Last Friday the index closed trading at new highs, partially correcting in what looks like a bullish bounce. Today's Asian session seems to have confirmed it with a bullish engulfing. The checkpoint zone (POC) is located at 17,696 points well below the area of the last impulse and support point which is located around 19,437 points. RSI at the session highs was at 81.52% and currently this overbought level has moderated to 68.22% but this does not mean that the trend has stopped but that it is looking for new highs. The next milestone to expect will be generated if the index pierces the highs of 24,071 towards 25,000 points.
All in all, the National People's Congress is shaping up to be a strategic platform that could redefine China's economic course. With a focus on stimulating investment, boosting innovation and strengthening consumption, the meeting promises to lay the foundations for a new stage of growth in the Chinese economy, generating optimistic expectations both domestically and internationally.
*******************************************************************************************
The information provided does not constitute investment research. The material has not been prepared in accordance with the legal requirements designed to promote the independence of investment research and such should be considered a marketing communication.
All information has been prepared by ActivTrades ("AT"). The information does not contain a record of AT's prices, or an offer of or solicitation for a transaction in any financial instrument. No representation or warranty is given as to the accuracy or completeness of this information.
Any material provided does not have regard to the specific investment objective and financial situation of any person who may receive it. Past performance is not reliable indicator of future performance. AT provides an execution-only service. Consequently, any person acing on the information provided does so at their own risk.

is the Trumph speech boost the Index? n is Wednesday the humpdayHello everyone! How was yesterday trade? Hope everyone stick to the strategy set the SL/TP for your day trade.
News📰 : as expected and anticipate more positive news this week 🔮
www.tradingview.com
**China shares waver, HK bounces as Beijing vows more support for consumption, AI**
HSI +1.30% at this news published.😂
Look at the HSI D Chart
- posted 28Feb2025
at point of writing; the index closed below key support level of 22900-23000 (the strong level of 23000 which is the 10MA level, the uptrend is broken 28Feb25); as mentioned this level has been retest 3 times, let's continue to monitor.
However, today the Index open Hi. So trade ⚠ cautiously. Don't chase Hi.
Trading volume: finance.yahoo.com
Date Volume
Mar 3,2025 4,338,200,000
Feb 28, 2025 6,578,300,000
Feb 27, 2025 6,257,000,000
Feb 26, 2025 5,138,100,000
Feb 25, 2025 4,449,800,000
Monthly
Mar 1 2025 - 4,338,200,000 (as of todate)
Feb 1 2025 - 93,960,700,000 (+7.53% from prev month)_correction
Jan 1 2025 - 52,385,800,000
Dec 1 2024 - 56,349,200,000
Avg past 3 months : 77.909Bn (+19.18% for the past avg vol); this imply the fund flow is abundance, hopefully this continues! Although the vol is slightly less than the last Oct 2024.
Look at the 4H chart
PEPPERSTONE:HK50
The HSI last Oct Hi @ 23241 has been broken, this level could be the resistance level for the Index to break the next level Hi. The HK50 last Oct Hi @ 23258.
Now, what's next?
As updated:-
Next level that we are looking at to break:
20985
21336-21350
22020-22535, 22840-22900
23241-23275-23314- 23471 (need to break above this level to change back to uptrend movement, else probably is gonna be sideways)
23952-24101
24385
🚨 as of ✍️ :
it stays above 22535(retest 3 times and this might formed very strong support level).
🗝️ support level :
22990 broken :22340-22750 (this level being tested 3 times 17,20Feb & 4Mar; last tested at 22535.3)
MACD - Deadcross was marked in Green, continue to curving down (4h Chart)
KDJ - Reverse to Bullish green zone on 4Mar25; the CFD continue to trading the upwards trend till now.
BB - Still within lower BB channel and gap up trading at upper BB channel/
the Mid-line 4H chart at 22960-975 was corrected from 23320.
Trade Plan: might pullback to 23020 to fill the gap. Range : 23025-23258
Buy into support : 22880-22960(confirm with indicators)
Sell at resistance : 23150, 23190, 23372/400, 23454,23512(it soared to hit ,this morning)
Monitor the 1H,4H movement with confirmation using MACD & KDJ indicator.
Set your tf, have your entry and exit plan!
Pay attention to the Goldencross/DeadCross; practice makes perfect.
Let's follow our own strategy and zen with 📙 and 🍵 for profits.
Happy Trading everyone!
🎯 Start to accumulate China & HKG for the potential upside for the year! All retracement is a good entry point.
🔎 DYODD and don't listen to anyone. Invest in yourself, do some study and learn along the way while you trying to verify or finding the answer if to start invest in CHN/HKG markets.
HKEX:2800 - 22.90-22.82 if it happens to retrace back to this level, otherwise anytime NOW is entry point! It's confirmed by the 200MA (above in W chart) ; also the W chart MACD GoldenCross. Cross-check it; if need helps let us know.
HKEX:2823 - 13.17-14.75 can start to open position and start accumulate, is allowed to wait for confirmation once it breaks 14.75 level. But you will be getting at higher cost...
HKEX:2801 - open position at price : 23.73-23.80 or anytime NOW! if ever retraced back to 23.36-23.66 accumulate more.
HKEX:3067 - open position now, add position when it retraced to 11.63,,11.33 or below. If you have missed, you may tk position still good to start at 11.85,11.99,12.15
** Please Boost 🚀/LIKE 👍, FOLLOW ✅, SHARE 🙌 and COMMENT ✍ if you enjoy this idea or need help! *

Analysis on Hang Seng: 22700 is significant levelDear All
if 22700 is broken, better TP some or exit.
however, overall, it is still strong uptrend.
if you got the low cost, tp 20% is nice chocie
Best of luck
TraderPP

Tariff Carnival with the U.S.: Chinese ReactionIon Jauregui - ActivTrades Analyst
The recent decision by the United States to increase tariffs on Chinese products has reignited tensions in the trade relationship between the two powers. With Washington's intention to raise additional tariffs on products from China by up to 20%, Beijing is considering levies on agricultural and food exports from the United States. If unilateral measures persist, a firm and forceful response from Asia is likely to be triggered. Possible countermeasures include both the imposition of new tariffs and the implementation of non-tariff barriers, focusing on strategic sectors for the U.S. economy, such as agriculture and food. The Chinese Ministry of Commerce had already expressed its opposition to Washington's plans, arguing that these tariffs violate the rules established by the World Trade Organization (WTO) and jeopardize the multilateral trading system. The escalation follows a series of previous measures, in which the US government had announced an additional 10% surcharge on Chinese products, on top of a previously established 10%, in response to criticism of China's insufficient action to combat the entry of fentanyl into the United States. Previously, Beijing had responded to criticism that China had not taken sufficient action to combat the entry of fentanyl into the United States. Previously, Beijing responded to the first tariff measures applied by the US administration with tariffs ranging from 10% to 15% on certain products, along with new controls on exports of strategic minerals and an investigation against the technology giant Google (NASDAQ: GOOGL). The current scenario, can be defined as a “Tariff Carnival” , as it is only worth highlighting the volatility and risk involved in this trade dispute initiated by Trump with all the countries with which it maintains trade relations, whose effects could extend beyond the borders of the two largest economies in the world.
Hang Seng Analysis
In today's trading day, the retracement was not long in coming, closing the week with a bearish session, and continuing today's Asian trading day with a bearish closing. Although the trend is clearly bullish on a daily time frame, it can be seen that there has been a new bounce off the highs. In other words, after breaking new highs at 24,071.50 points the stock has corrected to an area just below the previous highs, in the body area. If the price action loses strength it could generate a bearish crossover that corrects the price in the direction of the previous price support zone at 19573 points. If the stock continues to beat the market strongly we will see a new attempt to pierce the highs. It should be noted that the RSI has marked excessive overbought at the time of the correction at 81.79% and the POC is located in the area of the previous impulse of 17,200 points. Therefore, a small price correction is quite foreseeable if these tariffs have a sufficient impact on the index's corporate results.
In conclusion, the scenario is shaping up as a “Tariff Carnival” , where the escalation of protectionist measures and chain reactions could extend their effects beyond the two largest economies in the world, significantly impacting international trade and the stability of financial markets.
*******************************************************************************************
The information provided does not constitute investment research. The material has not been prepared in accordance with the legal requirements designed to promote the independence of investment research and such should be considered a marketing communication.
All information has been prepared by ActivTrades ("AT"). The information does not contain a record of AT's prices, or an offer of or solicitation for a transaction in any financial instrument. No representation or warranty is given as to the accuracy or completeness of this information.
Any material provided does not have regard to the specific investment objective and financial situation of any person who may receive it. Past performance is not reliable indicator of future performance. AT provides an execution-only service. Consequently, any person acing on the information provided does so at their own risk.

Looks like HSI got a morning energy boost is not a Weakday!3/3/2025
Hello everyone! Happy Monday today is not a Weakday but a wonderful weekday start of the week 🫰 🫶
News📰 : this was from 28Feb2025
www.tradingview.com
N this is this morning 3Mar2025 - what do you think? I suspect more good news will come this week. 🔎🔮
www.tradingview.com
Look at the HSI D Chart
- posted 25Feb2025
- posted 26Feb2025
- posted 27Feb2025
- posted 28Feb2025
at point of ✍️; the index closed near the key support level of 22900-23000 (the strong level of 23000 which is the 10MA level); as mentioned this level has been retest 3 times, let's continue to monitor.
Trading volume: finance.yahoo.com
Date Volume
Feb 28, 2025 6,578,300,000
Feb 27, 2025 6,257,000,000
Feb 26, 2025 5,138,100,000
Feb 25, 2025 4,449,800,000
Feb 24, 2025 5,264,600,000
Monthly
Mar 1 2025 - 93,960,700,000 (+7.53% from prev month)
Feb 1 2025 - 87,382,400,000
Jan 1 2025 - 52,385,800,000
Dec 1 2024 - 56,349,200,000
Avg past 3 months : 77.909Bn (+19.18% for the past avg vol); this imply the fund flow is abundance, hopefully this continues! Although the vol is slightl less than the last Oct 2024.
Look at the 4H chart
PEPPERSTONE:HK50
The last Oct Hi @ 23241 has been broken, this level could be the resistance level for the Index to stay above for the next level.
Now, what's next?
As updated:-
Next level that we are looking at to break:23330, 23525, 23990, 24101, 24385.
🚨 as of ✍️ :it seems it stay above the key support level of 22990.
🗝️ support level : 23500 (broken) , 23175 (broken), 22990 (testing), 22741
MACD - last marked WAS deadcross and curving down as marked in YELLOW. After 8 bars-it reversed as marked in GREEN. and NOW it formed Deadcross again (as marked in YELLOW)
KDJ - Remained in bearish red zone with chance that it could reverse upwards.
BB - Still within lower BB channel and testing to break the BB mid-line for 4H chart at 23330.
Today Trade Plan: 22785-23504
Buy into support : 22900 ,23,005, 23169,23283 (confirm with the indicator if it's on the bullish zone)
Sell at resistance : 23400, 23353, 23335 (short/TP with shorter timeframe bearish zone, cross-check and wait for confirmation.)
Monitor the 1H,4H movement with confirmation using MACD & KDJ indicator.
Set your tf, have your entry and exit plan!
Pay attention to the Goldencross/DeadCross; practice makes perfect.
Let's follow our own strategy and zen with 📙 and 🍵.
Happy Trading everyone!
🎯 Start to accumulate China & HKG for the potential upside for the year! All retracement is a good entry point.
🔎 DYODD and don't listen to anyone. Invest in yourself, do some study and learn along the way while you trying to verify or finding the answer if to start invest in CHN/HKG markets.
HKEX:2800 - 22.90-22.82 if it happens to retrace back to this level, otherwise anytime NOW is entry point! It's confirmed by the 200MA (above in W chart) ; also the W chart MACD GoldenCross. Cross-check it; if need helps let us know.
HKEX:2823 - 13.17-14.75 can start to open position and start accumulate, is allowed to wait for confirmation once it breaks 14.75 level. But you will be getting at higher cost...
HKEX:2801 - open position at price : 23.73-23.80 or anytime NOW! if ever retraced back to 23.36-23.66 accumulate more.
HKEX:3067 - open position now, add position when it retraced to 11.63,,11.33 or below. If you have missed, you may tk position still good to start at 11.85,11.99,12.15
** Please Boost 🚀/LIKE 👍, FOLLOW ✅, SHARE 🙌 and COMMENT ✍ if you enjoy this idea or need help! *

HSI clocked out early, TP sit back and relax wait for next move!
Hello everyone! Today one of the web hot topic - all the 7 stars align and there must be something happen!
What do you think?
"Bulls took profits, bears took chances—HSI took a nap before the next round!" 😴📈📉
Here you go...now come with this news 📰
www.tradingview.com
**Shares in Hong Kong plunged 309 points or 1.3% to 23,415 on the last trading day of February, marking a second session of losses.
The Hang Seng fell further from its highest in over three years, set earlier in the week, and was on track for its first weekly drop in seven weeks, with all sectors posting sharp losses.
Still, markets were on course for solid monthly gains, up around 15% so far, marking a third month of rises as hopes mounted that China’s 2025 Two Sessions meeting next week will outline key policy priorities, including potential support measures for the economy.**
Look at the HSI D Chart
- posted 25Feb2025
- posted 26Feb2025
- posted 27Feb2025
- posted 28Feb2025 at point of writing; the index broke the key support level of 22900-23000 (the strong level of 23000 which is the 10MA level; let's monitor closely next week the new start for the month and see this level can be maintained. (this level has been retest 3 times)
Trading volume: finance.yahoo.com
Date Volume
Feb 27, 2025 6,257,000,000
Feb 26, 2025 5,138,100,000
Feb 25, 2025 4,449,800,000
Feb 24, 2025 5,264,600,000
Monthly
Feb 1 2025 - 87,382,400,000
Jan 1 2025 - 52,385,800,000
Dec 1 2024 - 56,349,200,000
Avg past 3 months : 65.3Bn ; current as of todate / month volume > past 3 mnths avg (i.e 57.98bn)
Look at the 4H chart (main chart)
PEPPERSTONE:HK50
The last Oct Hi @ 23241 has been broken hence retracement is not a surprised!
With the month closing today, the strong pullback is inevitable for institute and whale to take profit.
Please trade cautiously today! 🚨 🚨 🚨
Now, what's next?
As updated:-
Next level that we are looking at to break and steadily staying above this level - 23525, 23990, 24101, 24385
🚨 as of ✍️ it seems break the first support level this morning- and let's see if it could rebound today else it will go down ⬇ 👇 to 23175-22990 level, then 22741.
🗝️ support level : 23500 (broken) , 23175 (broken), 22990 (testing), 22741
MACD - last marked WAS deadcross and curving down as marked in YELLOW. After 8 bars-it reversed as marked in GREEN. and NOW it formed Deadcross again (as marked in YELLOW)
KDJ - Now reversed turned into bearish red zone. It remained in bearish zone.
BB - It is now entered lower BB channel and testing to break the lower BB and create new Lo.
Today Trade Plan: 23000-23504
Buy into support : 22795- 22900 (confirm with the indicator if its on reversal mode otherwise stayaway)
Sell at resistance : 24040,23454,23250 (short and TP within shorter timeframe, cross-check and wait for confirmation)
Monitor the 1H,4H movement with confirmation using MACD & KDJ indicator.
Set your tf, have your entry and exit plan!
Pay attention to the Goldencross/DeadCross; practice makes perfect.
Let's follow our own strategy and zen with 📙 and 🍵.
Happy Trading everyone!
🎯 Start to accumulate China & HKG for the potential upside for the year! All retracement is a good entry point.
🔎 DYODD and don't listen to anyone. Invest in yourself, do some study and learn along the way while you trying to verify or finding the answer if to start invest in CHN/HKG markets.
HKEX:2800 - 22.90-22.82 if it happens to retrace back to this level, otherwise anytime NOW is entry point! It's confirmed by the 200MA (above in W chart) ; also the W chart MACD GoldenCross. Cross-check it; if need helps let us know.
HKEX:2823 - 13.17-14.75 can start to open position and start accumulate, is allowed to wait for confirmation once it breaks 14.75 level. But you will be getting at higher cost...
HKEX:2801 - open position at price : 23.73-23.80 or anytime NOW! if ever retraced back to 23.36-23.66 accumulate more.
HKEX:3067
** Please Boost 🚀/LIKE 👍, FOLLOW ✅, SHARE 🙌 and COMMENT ✍ if you enjoy this idea or need help! *

#039 Trust The Process 1206SGT 28022025Buying HK33HKD.
Price on the higher time frame is on a strong uptrend, and I am buying at the support level of support on the 3 minutes time frame.
This setup is spotted on the 3 MInutes Time Frame but tradingview require 15 Minutes Time Frame minimum to post ideas, so I zoomed out.
1208SGT 28022025
Add : Unable to do opposite is true on Oanda MT4 account. I think the leverage of 20:1 max is too small, the margin available doesn't allow the position to be opened.
Too bad.
1216SGT 28022025

Not every run is a marathon— it needs pit stop! Hello everyone!
Here you go...now come with this news 📰
Market Chatter: China Plans 400-Billion-Yuan Capital Injection for Banks -- 💰💰💰?
www.tradingview.com
Look at the HSI D Chart
- posted 25Feb2025
- posted 26Feb2025
- posted 27Feb2025 at point of writing; the index seems doing quite well since open this morning,
trying to stay above the support level 💣💣💣23500 (and strong level of 23000 which is the 10MA level, if break below this level the Index bullrun end, but it's unlikely as it has been retest 3 times)
Trading volume: finance.yahoo.com
Date Volume
Feb 27, 2025
Feb 26, 2025 5,138,100,000
Feb 25, 2025 4,449,800,000
Feb 24, 2025 5,264,600,000
Monthly
Feb 1 2025 - 81,125,400,000
Jan 1 2025 - 52,385,800,000
Dec 1 2024 - 56,349,200,000
Avg past 3 months : 63.28Bn ; current month Feb volume > 3 mnths avg
Look at the 4H chart
PEPPERSTONE:HK50
The last Oct Hi @ 23241 has been broken hence retracement is not a surprised!
Now, what's next? This is tough question 🙋 - Next level that we are looking at to break and steadily staying above this level - 23525, 23990, 24101, 24385
🚨if it breaks below 23454-23500 (& not rebound) it could go down ⬇ 👇 to 23250-23175
🗝️ support level : 23500, 23175, 22741 t
MACD - last marked WAS deadcross and curving down as marked in YELLOW. After 8 bars-it reversed as marked in GREEN.
KDJ - Now reversed turned into bearish red zone.
BB - continue moving above the mid line of BB, this morning touches the mid-line; so be cautious 🚨🚨🚨
Today Trade Plan: 23454-24050
Buy into support : 23454 -23550 (TP :23600-23775)
Sell at resistance : 23800-24050 (TP : 23525-23454)
Monitor the 1H,4H movement with confirmation using MACD & KDJ indicator.
Set your tf, have your entry and exit plan!
Pay attention to the Goldencross/DeadCross; practice makes perfect.
Let's follow our own strategy and zen with 📙 and 🍵.
Happy Trading everyone!
🎯: start to accumulate China & HKG for the potential upside for the year! All retracement is a good entry point.
🔎 DYODD and don't listen to anyone. Invest in yourself, do some study and learn along the way while you trying to verify or finding the answer if to start invest in CHN/HKG markets.
HKEX:2800 - 22.90-22.82 if it happens to retrace back to this level, otherwise anytime NOW is entry point! It's confirmed by the 200MA (above in W chart) ; also the W chart MACD GoldenCross. Cross-check it; if need helps let us know.
HKEX:2823 - 13.17-14.75 can start to open position and start accumulate, is allowed to wait for confirmation once it breaks 14.75 level. But you will be getting at higher cost...
HKEX:2801 - open position at price : 23.73-23.80 or anytime NOW! if ever retraced back to 23.36-23.66 accumulate more.
HKEX:3067
** Please Boost 🚀/LIKE 👍, FOLLOW ✅, SHARE 🙌 and COMMENT ✍ if you enjoy this idea or need help! *

A massive drop on HK50 coming upThere is a huge pattern on the Daily Chart to sell the HK50 index pointing to a 2000 pip drop. However we are going to take the smaller pattern on this as shown below.
1) We are approaching the strong resistance zone of 23,650
2) There is a bat pattern
3) This is counter trend, so we will wait for 2-3 hours to take this trade
Will update when we take the trade.

Another perspective from previous post, 25k targetPlease see my previous post explanation my thoughts, this is a wider perspective. Didn’t like the image it showed on my first post.

25000 Target, Currently Long Chinese StocksI’ve been trading this market for a while and associated Chinese stocks, looking for 25000 to close Chinese long positions. Still could be bullish over long term, just thinking short term there could be a pullback after hitting 25000. Always tempting to hold longer but trying to manage risk and book profits as some point. MACD and RSI on weekly reaching overbought and I will try to wait for them to return to oversold conditions before reentering after target.

Rebound lik a champ, monitor the vol c if the guests left early?Hello everyone! How was your zentradingstrategy? Hope everyone embrace with the retracement.
Sell on news? or Buy the dip?
What did we noticed on yesterday news? pfft..Distraction, distraction...
but here you go for today 😂😂😂: www.tradingview.com
**Shares in Hong Kong surged 520 points or 2.3% to 23,555 on Wednesday, shifting from a weak session the day before amid robust gains across all sectors.**
Look at the HSI D Chart
- posted 25Feb2025
- 26Feb2025 at point of writing; the index seems doing quite well since open this morning, trying to stay above the support level 22990.
Yesterday trading volume: finance.yahoo.com
Date Volume
Feb 26, 2025
Feb 25, 2025 4,449,800,000
Feb 24, 2025 5,264,600,000
Look at the 4H chart
PEPPERSTONE:HK50
The last Oct Hi @ 23241 has been broken hence retracement is not a surprised!
MACD - last marked WAS deadcross and curving down as marked in YELLOW. After 8 bars-it reversed as marked in GREEN.
KDJ - WAS at bearish zone curving down; and now reversed and turned bullish in green zone.
BB - now moving above the mid line of BB from yesterday ranging within the mid-line.
22990 resistance level now reversed as SUPPORT level. Hopefully the retracement is completed. Let's monitor especially the volume see if this is just a rehearsal.
Today Trade Plan: 23150-23670 (ahemmm...trust you can do the math 😂)
Buy into support : 23150 -23175 (TP :23600-23630)
Sell at resistance : 23465-23670 (TP : 23450-23500)
Monitor the 1H,4H movement with confirmation using MACD & KDJ indicator.
Set your tf, have your entry and exit plan!
Pay attention to the Goldencross/DeadCross; practice makes perfect.
Let's follow our own strategy and zen with 📙 and 🍵.
Happy Trading everyone!
Reminder : start to accumulate China & HKG for the potential upside for the year! All retracement is a good entry point.
HKEX:2800 - 22.90-22.82 if it happens to retrace back to this level, otherwise anytime NOW is entry point! It's confirmed by the 200MA (above in W chart) ; also the W chart MACD GoldenCross. Cross-check it; if need helps let us know.
HKEX:2823 - 13.17-14.75 can start to open position and start accumulate, is allowed to wait for confirmation once it breaks 14.75 level. But you will be getting at higher cost...
HKEX:2801 HKEX:3067
** Please Boost 🚀/LIKE 👍, FOLLOW ✅, SHARE 🙌 and COMMENT ✍ if you enjoy this idea or need help! 😍 **

Going long on HK50We are taking this position now because at 22760 because
1) H4 and D1 is uptrend
2) There is a M15 pattern
3) At strong support
4) M15 divergence
5) Previous day low
Target is the top 23500 which is about 700 pips away.

#023 Trust The Process HK33HKD 1328SGT 25022025HK33HKD in a obvious up trend, so, I buy.
Standard procedures which I and most traders past, present and future will be doing.
1325SGT 25022025

A little dip? Just the market testing if the game still on!Hello everyone!
Sell on news?
www.tradingview.com
**Hong Kong stocks fell 315 points or 1.4% to 23,030 in Tuesday morning trade, marking the second session of sharp losses amid broad sector falls, notably consumers and tech.Traders retreated from riskier assets after the US intensified curbs on Chinese investments and proceeded with tariffs on Canada and Mexico.**
Is this piece of sh *** news helps in trading? 🤐 🤐 🤐
#sticktoyourplan
#trustwhatyoutrust
#followyourowntradingplan
Build your own #zentradingstrategy news can be distraction to your judgements!
Look at the HSI D Chart
Look at the 4H chart
PEPPERSTONE:HK50
The last Oct Hi @ 23241 has been broken hence retracement is not a surprised!
MACD - formed deadcross and curving down as marked in yellow circle.
KDJ - at bearish zone curving down.
BB - it broke down uptrende channel trading in lower BB channel
22990 support level turned resistance level now. If it able to break and stay above this level this week then this is a healthy pull back. Let's monitor.
Today Trade Plan: 22500-23250 (~830pts)
Buy into support : 22600 -22900 (TP :22950-23130)
Sell at resistance : 23000-23100 (TP: 22900-22930)
PEPPERSTONE:HK50
1h Chart
Check MACD & KDJ - wait for the reversal confirmation before taking your swing long position.
Monitor the 1H,4H movement with confirmation using MACD & KDJ indicator.
Set your tf, have your entry and exit plan!
Pay attention to the Goldencross/DeadCross; practice makes perfect.
Let's follow our own strategy and zen with 📙 and 🍵.
Happy Trading everyone!
Reminder : start to accumulate China & HKG for the potential upside for the year! All retracement is a good entry point.
HKEX:2800 - 22.90-22.82 add position
HKEX:2823 HKEX:2801 HKEX:3067
** Please Boost 🚀/LIKE 👍, FOLLOW ✅, SHARE 🙌 and COMMENT ✍ if you enjoy this idea!**

HSI took off like a rocket...confirmed bullish24/02/2025
HSI took off like a rocket… then remembered it forgot its wallet and came back for a quick retrace!" 🚀📉
Next target : 24385
HSI 1W Chart
Look at that! ignore the news, the movement and volume
finance.yahoo.com
Goldencross for the week of 3Feb2025 - with trading volume jumped from 3.69bn to 15.12bn.
And the subsequent week volume keeping at >20bn level (for the week of 10Feb & 17Feb)
Let's monitor if this week keeping the same level of volume for the 3rd week.
finance.yahoo.com
we noticed the trading volume increased from 4.42Bn to 6.1673bn last Friday 21Feb25
www.tradingview.com
** The Hang Seng Composite Index on information technology firms and the Hang Seng Tech Index slip 0.5% and 0.1% respectively, while Hang Seng Index adds 0.4%
** Stock up 76.9% YTD
HSI:HSI
The last Oct Hi @ 23241 has been broken today!
MACD, KDJ and BB remained at bullish zone.
Key support level: 22990,22668,22446
Key resistance level : 23675,24167,24385
Look at the 1h chart - posted
PEPPERSTONE:HK50
Today Trade Plan:
Buy into support : 23300-23500
Sell at resistance : 23650-23700 (TP:23630)
Monitor the 1H,4H movement with confirmation using MACD & KDJ indicator.
Set your tf, have your entry and exit plan!
Pay attention to the Goldencross/DeadCross; practice makes perfect.
Let's follow our own strategy and zen with 📙 and 🍵.
Happy Trading everyone!
Reminder : start to accumulate China & HKG for the potential upside for the year! Today retracement is a good entry point.
HKEX:2800 HKEX:2823 HKEX:2801 HKEX:3067
** Please Boost 🚀/LIKE 👍, FOLLOW ✅, SHARE 🙌 and COMMENT ✍ if you enjoy this idea!**
