Almost there! Breaking through for BullPEPPERSTONE:HK50
HSI:HSI
Look at the 4H chart.
MACD - Golden Cross arching up this morning.
KDJ - Bullish zone but overbought zone.
BB - Ranging at upper BB channel and continue to arching up.
Cross-checked with broader tf chart - D chart.
KDJ is now at bullish zone but overbought.
MACD are still below zero level but seems arching and inching to break zero level to give confirmation of bullish.
Continue to monitor to wait for MACD Signal cross above zero line confirming BULLISH.
Can accumulate and swing trade for 4 wks-6 wks.
Look at the 1H chart.
MACD has confirmed its bullish.
KDJ has been moving through the bullish and bearish cycle.
Range Upper BB : 20120 - 20300
Lower BB : 19985 (support level) - 20119.
For day trade: Same strategy, sell at resistance; buy/TP at support.
Monitor the 1H,4H movement with confirmation using MACD & KDJ indicator.
Set your tf, have your entry and exit plan!
Support : 19980 ( next support level 19930)
Resistance : 20330 (if breaks then 20450)
Trading to make pocket money isn't that challenging and it can be boring and you can make it fun and zen with it.
Let's follow our own strategy and zen with 📙 and 🍵.
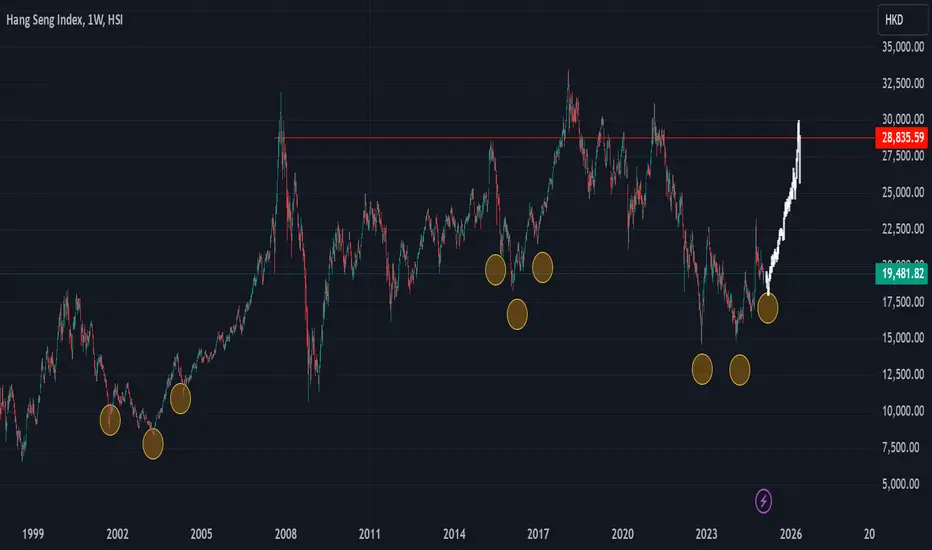
Reminder : to slowly To take action to accumulate Hong Kong and China stock/ETF/Index and wait for 12-24months or more to have an exponential capital gain. Check the Month Chart you will notice, is almost there already....
HKEX:2800 - create position at around 20.50 and add position if pullback to 19.30 (Both Fibo level)
HKEX:2823 HKEX:2801
February news is around the corner from local authority. Let's see if that's the case.
One of the positive news:-
www.scmp.com
Again, news are distraction. 😂
Please DYODD and take action to diversify your investment portfolio with China & HKG exposure.
Happy CNY everyone and happy trading!
HSI trade ideas

Analysis on Hong Kong Stock Index: good time to longHi traders and investors,
Fundamentally, the tension from Trump has been alleviated, though temporarily.
Technically, it is time to long, really rare opportunity to come
Best Regards,

Chinese Stocks Decline Amid Tariff ThreatsChinese Stocks Decline Amid Tariff Threats
According to Bloomberg, President Donald Trump raised the possibility of imposing tariffs on China during his second day in office.
“We’re considering a 10% tariff on China,” Trump announced during a White House event on Tuesday, indicating February 1 as a potential start date.
During his election campaign, Trump had mentioned tariffs as high as 60%, and the prospect of transitioning from campaign rhetoric to real action is driving bearish sentiment.
According to the technical analysis of the Hang Seng Index (Hong Kong 50 on FXOpen), price fluctuations have been forming a downward trend since October. The formation of the 2025 peak (indicated with an arrow) signals bearish tendencies, as the price failed to hold above:
→ The previous high from December, near 20,210, indicating a false breakout.
→ The psychological level of 20,000.
If Trump follows through on his promises, it is reasonable to anticipate that bears may take control of lower levels in the coming sessions.
Trade on TradingView with FXOpen. Consider opening an account and access over 700 markets with tight spreads from 0.0 pips and low commissions from $1.50 per lot.
This article represents the opinion of the Companies operating under the FXOpen brand only. It is not to be construed as an offer, solicitation, or recommendation with respect to products and services provided by the Companies operating under the FXOpen brand, nor is it to be considered financial advice.

retreat frm ytd 'short bullrun'; look at key support levelPEPPERSTONE:HK50
HSI:HSI
Look at the 4H chart.
MACD - Deadcross curving down
KDJ - Bearish zone.
BB - entering lower band.
Cross-checked with broader tf chart - D chart.
MA20 :19632
MA52 :19738 (MA52>MA20)
KDJ is now at bullish zone; overbought.
Both KDJ and MACD are still below zero. MACD seems to be forming a curve; it may go down if there is no strength to break above the zero line and turn bullish.
We can probably see a sideways movement until the distraction—news announced in February.
Continue to monitor to wait for MACD Signal cross above zero line confirming BULLISH.
Can accumulate and swing trade for 4 wks-6 wks.
Look at the 1H chart.
The pullback is delayed but inevitable.
At point of observed KDJ it's in red bearish zone.
MACD is at bullish area fast line is touching signal line forming a dead cross within Bullish zone.
For day trade: Same strategy, sell at resistance; buy/TP at support.
Monitor the 1H,4H movement with confirmation using MACD & KDJ indicator.
Set your tf, have your entry and exit plan!
Support : 19782 (next 19742, 19300 ; key support level 19545)
Resistance : 19900 (if breaks then 20030)
Sticktoyourplan follow your trading strategy.
Trading to make pocket money isn't that challenging. Although it can be boring, you can make it fun and zen with it.
Let's follow our own strategy and zen with 📙 and 🍵 to let the results realized.
Reminder : to slowly accumulate Hong Kong and China stock/ETF/Index and wait for 12-24months or more to have an exponential capital gain. Check the Month Chart you will notice, is almost there already....
HKEX:2800 HKEX:2823 HKEX:2801
Time frame is important! Prepared for the rollercoaster short-term rider for these two markets.
Time is our friend!
Trend is our friend too, do not go against it.
Happy Trading Everyone! ☺

Hang Seng H4 | Potential bearish breakoutHang Seng (HKG33) is falling towards a potential breakout level and could fall lower from here.
Sell entry is at 19,923.62 which is a potential breakout level.
Stop loss is at 20,420.00 which is a level that sits above a swing-high resistance.
Take profit is at 19,304.87 which is an overlap support that aligns with the 61.8% Fibonacci retracement level.
High Risk Investment Warning
Trading Forex/CFDs on margin carries a high level of risk and may not be suitable for all investors. Leverage can work against you.
Stratos Markets Limited (www.fxcm.com):
CFDs are complex instruments and come with a high risk of losing money rapidly due to leverage. 64% of retail investor accounts lose money when trading CFDs with this provider. You should consider whether you understand how CFDs work and whether you can afford to take the high risk of losing your money.
Stratos Europe Ltd (www.fxcm.com):
CFDs are complex instruments and come with a high risk of losing money rapidly due to leverage. 66% of retail investor accounts lose money when trading CFDs with this provider. You should consider whether you understand how CFDs work and whether you can afford to take the high risk of losing your money.
Stratos Trading Pty. Limited (www.fxcm.com):
Trading FX/CFDs carries significant risks. FXCM AU (AFSL 309763), please read the Financial Services Guide, Product Disclosure Statement, Target Market Determination and Terms of Business at www.fxcm.com
Stratos Global LLC (www.fxcm.com):
Losses can exceed deposits.
Please be advised that the information presented on TradingView is provided to FXCM (‘Company’, ‘we’) by a third-party provider (‘TFA Global Pte Ltd’). Please be reminded that you are solely responsible for the trading decisions on your account. There is a very high degree of risk involved in trading. Any information and/or content is intended entirely for research, educational and informational purposes only and does not constitute investment or consultation advice or investment strategy. The information is not tailored to the investment needs of any specific person and therefore does not involve a consideration of any of the investment objectives, financial situation or needs of any viewer that may receive it. Kindly also note that past performance is not a reliable indicator of future results. Actual results may differ materially from those anticipated in forward-looking or past performance statements. We assume no liability as to the accuracy or completeness of any of the information and/or content provided herein and the Company cannot be held responsible for any omission, mistake nor for any loss or damage including without limitation to any loss of profit which may arise from reliance on any information supplied by TFA Global Pte Ltd.
The speaker(s) is neither an employee, agent nor representative of FXCM and is therefore acting independently. The opinions given are their own, constitute general market commentary, and do not constitute the opinion or advice of FXCM or any form of personal or investment advice. FXCM neither endorses nor guarantees offerings of third-party speakers, nor is FXCM responsible for the content, veracity or opinions of third-party speakers, presenters or participants.

HSI performance with the 47th president inaguration PEPPERSTONE:HK50
HSI:HSI
Hello everyone! CNY is around the corner, am about to off for celebration.
Hope who celebrate CNY enjoy and welcoming the new wood snake 🐍 coming.
Is gonna to be a challenging and fascinating year to both West and East.
The trade plan.
Look at the 4H chart.
Both MACD & KDJ are arcing again (MACD still within the bearish zone, below zero level)
MACD is at bullish zone but fast line curving down.
KDJ at overbought zone and curving down and turned into red zone indicate Bearish.
Cross-checked with broader tf chart - D chart.
KDJ is now at bullish zone but overbought.
Both KDJ and MACD are still below zero level. Bearish, monitor to wait for MACD Signal cross above zero line confirming BULLISH.
1H chart the Index had soared 440++pts; +2.27% for HK50 yesterday.
Pullback is inevitable today.
At point of observed KDJ it's in red bearish zone.
MACD is at bullish area fast line is touching signal line forming a dead cross within Bullish zone.
For day trade: Same strategy, sell at resistance; buy/TP at support.
Monitor the 1H,4H movement with confirmation using MACD & KDJ indicator.
Set your tf, have your entry and exit plan!
Support : 19895 (next 19778; key support level 19545)
Resistance : 20300 (if breaks then 20350)
Sticktoyourplan follow your trading strategy.
Trading to make pocket money isn't that challenging and it can be boring and you can make it fun and zen with it.
Let's follow our own strategy and zen with 📙 and 🍵 to let the results be realized.
It can be a winning trade or losing trade, it doesn't matter. We are aiming for long horizon; as we are not gambling or speculating.
The markets is always gonna be there.
Reminder
For the East : to slowly accumulate Hong Kong and China stock/ETF/Index (undervaluation) and wait for 12-24months or more to have an exponential capital gain. Check the Month Chart you will notice, is almost there already....
For the West : AI applications, Digital assets for sure but not all in one basket. Diversified.
Time frame is important! Prepared for the rollercoaster short-term rider for these two markets.
Time is our friend!
Happy Trading Everyone! ☺

HK50 short-term buy ideaSetup 2 was achieved from my previous post. Now I am expecting a short term bull run to bull run to 20K at least.
Previous post:

China is the new world power.China is the new world power. Watch out for the chips.
If things go my way, I'll try to pyramid as much as I can along the way but keep the same risk. Which is a little higher than the standard one

HSI Long Term Perspective, Can the Cycle Repeat?HSI like building HL for wave 4 elltiot wave
So maybe in 2025 we will see last wave aka wave 5 and i think it can be longest wave so we can reach main resist 2020, 2018, 2015, and 2007
HK50 Long Idea - Weekly - DailyHK50 is getting close to weekly POI.
We can see a bullish ChoCh from Jan 23 ?!
Then bullish reaction from ? Jan 24 ?!
Is Strong up trend coming in Jan 25?
Will Trump25 help HK50?
Something stress free, like 200$ on 1:30 could give 500$ in couple of months.

Hang Seng Index at 0.618 Fib: Bullish SetupThe Hang Seng Index has demonstrated strong bullish momentum, adhering closely to its trendline throughout its rally. Following this upward trajectory, the price has undergone a significant retracement, finding support near the critical 0.618 Fibonacci level—a key zone for potential reversals in technical analysis. This pullback has established a higher low at 19,332, indicating sustained bullish pressure and reinforcing the current uptrend. This confluence of the Fibonacci level, trendline support, and higher-low formation presents a compelling buying opportunity, with the potential for continued upside as the bullish structure remains intact.

is the index in booze again and in breakdance mode? PEPPERSTONE:HK50
HSI:HSI
Hello bello...everyone, may all your trade closed in profit!
As mentioned in yesterday post, the Index was in a bearish mode but be cautious.
Look at the 4H chart, do you see?
Both MACD & KDJ are arcing again (MACD still within the bearish zone, below zero level)
4H chart - Bearish (bullish reversal within bearish zone, temporary -this can be fake rebound 😂)
Cross-checked with broader tf chart - D chart.
KDJ is now at oversold area 20.
Both KDJ and MACD below zero level. Bearish.
1H chart
the Index seems has no mood and strength to move and need quite a long rest...
Mood change overnight, re-adjust and in the action.
MACD - reversal for bullish generating green histogram; although the signal within bearish zone. Hence, for day trade is bullish for the week it could be pullback.
KDJ completed the bearish mode and turned bullish; at the point of observation, it was overbought at KDJ ~75.
MACD arcing up Bullish, KDJ overbought zone - this signal divergence; so cautious of the potential correction. It's likely to pullback. Hence, trade cautiously.
For day trade: Same strategy, sell at resistance; buy/TP at support.
Monitor the 1H,4H movement with confirmation using MACD & KDJ indicator.
Set your tf, have your entry and exit plan!
Support : 18300; today broke the support level hopefully it stays above 19070 level. (if breaks then next 19300)
Resistance :19200-19300 (if breaks then 19450, then 19650)
Sticktoyourplan follow your trading strategy.
Trading to make pocket money isn't that challenging and it can be boring and you can make it fun and zen with it.
Let's follow our own strategy and zen with 📙 and 🍵 to let the results realized. It can be a winning trade or losing trade, it doesn't matter. We are aiming for long horizon; as we are not gambling or speculating.
Rememeber to allocate some of your gained pocket money for long term asset investment.
We should take contrarian strategy. Accumulate Hong Kong and China stock and wait for 12-24months or more to have an exponential capital gain.
Check the Month Chart you will notice, is almost there already....
PEPPERSTONE:HK50 HKEX:2800
Time frame is important! Prepared for the rollercoaster short-term rider for these two markets.
Got your trade plan ready for 2025, or are you still figuring out your moves?
Share your view OR hit the 🚀 , signal that you keen to explore.
Happy Trading Everyone! ☺

this week clearly more bearish than bullish but again cautious!PEPPERSTONE:HK50
HSI:HSI
Hello bello.....May everyone trade in the state of peaceful and calming mind.
Hong Kong Stocks Post Five-Day Rout
Hong Kong stocks ended lower on last Friday, extending the losing streak to a fifth session, as sentiment remained downbeat due to concerns over US-Sino trade tensions.
The Hang Seng Index retreated 0.92%, or 176.60 points, to end the week at 19,064.29.
Is the news helping? News is distraction. 😂
What's the magic numbers to look at for HSI for the near short-long term?
Well, we are now in the pullback correction area, worth to notice and recall that in fact in 2024 the index has actually bringing the full-year with almost 18% (17.67%) gain; closed at 20059.
Support: 18569, 18215 (from W Chart you can see this is the support level from May,Sept 2024). If this breakthrough then we will see the index at 17570 level.
Resistance: 18,930, 19,700 (well there are analyst forecasting that HSI has an upside of 15% targeting to 20,3000 by end of 2025)
b]4H chart - Bearish
Both MACD & KDJ are indicating Bearish mode.
MACD - remained at bearish zone, line still arcing. [ s]But crossing up. Good sign.
KDJ - remained in bullish green zone, indicating uptrend signal. Turned bearish.
Cross-checked with broader tf chart - D chart.
Bearish - at Oversold zone,below 80
Both KDJ and MACD below zero level. Bearish.
1H chart the Index seems has no mood and strength to move and need quite a long rest...
For day trade: Same strategy, sell at resistance; buy/TP at support.
Monitor the 1H,4H movement with confirmation using MACD & KDJ indicator.
Set your tf, have your entry and exit plan!
Support : 18215 (if breaks then next 19070)
Resistance :18650 (if breaks then 19450, then 19650)
MACD - closing to touch zero line trying to breakthrough but with the red histogram it looks likely dipping down.
KDJ - in bearish zone. It may be divergence signal that on the oversold area and could see a rebound.
Sticktoyourplan follow your trading strategy.
Trading to make pocket money isn't that challenging and it can be boring and you can make it fun and zen with it.
Let's follow our own strategy and zen with 📙 and 🍵 to let the results realized. It can be a winning trade or losing trade, it doesn't matter. We are aiming for long horizon; as we are not gambling or speculating.
Rememeber to allocate some of your gained pocket money for long term asset investment.
We should take contrarian strategy. Accumulate Hong Kong and China stock and wait for 12-24months or more to have an exponential capital gain.
Time frame is important! Prepared for the rollercoaster short-term rider for these two markets.
Got your trade plan ready for 2025, or are you still figuring out your moves?
Think of it like prepping for a wild night out—plan your entry, know your exits, and avoid getting caught in the wrong crowd (aka bad trades).
Happy Trading Everyone!

still figuring out the moves? PEPPERSTONE:HK50
HSI:HSI
Happy Friday everyone!
www.tradingview.com
The Hang Seng fell 39 points or 0.2% to end at 19,241 on Thursday after trading modestly higher in the morning, with eventual losses in financials and property.
Is the news helping? News is distraction. 😂
4H chart
Both MACD & KDJ are on the divergence.
MACD - remained at bearish zone, line still arcing. But crossing up. Good sign.
KDJ - remained in bullish green zone, indicating uptrend signal.
Cross-checked with broader tf chart - D chart. It's still at oversold zone ,below 80 for KDJ and MACD below zero level.
1H chart the Index is dancing within very narrow range for today.
Support : 19130 (if breaks then next 19070)
Resistance :19375 (if breaks then 19450, then 19650)
MACD - closing to touch zero line trying to breakthrough but with the red histogram it looks likely dipping down.
KDJ - in bearish zone. It may be divergence signal that on the oversold area and could see a rebound.
For day trade: Same strategy, sell at resistance (19371); buy/TP at support (19070 strong support level; then 18910). Monitor the 1H,4H movement with confirmation using MACD & KDJ indicator.
Set your tf, have your entry and exit plan!
Sticktoyourplan follow your trading strategy.
Trading to make pocket money isn't that challenging and it can be boring but you can make it fun and zen with it.
Let's follow our own strategy and zen with 📙 and 🍵 to let the results realized. It can be a winning trade or losing trade, it doesn't matter. We are aiming for long horizon; as we are not gambling or speculating.
Rememeber to allocate some of your gained pocket money for long term assets investment.
Is end of the full trading week for 2025.
Got your trade plan ready for 2025, or are you still figuring out your moves?
Think of it like prepping for a wild night out—plan your entry, know your exits, and avoid getting caught in the wrong crowd (aka bad trades).
Share your ideas and goals with fellow market party animals, hype each other up, and sharpen your skills with regular practice. Let’s make this trading year a VIP experience!
Happy Trading Everyone!

waltzing within the boxPEPPERSTONE:HK50
timing markets is virtually impossible
we don't have crystal ball🔮 and hence we don't predict or speculate.
let's dance with the index
From yesterday post, from the indicators we keep an eye to monitor as it may rebound...
so is this the rebound ?(yes maybe short-term).
A full reversal? again, we don't know! But, don't think so, always cross-check with broader tf - D Chart. It's still at bearish zone; oversold zone (continue to monitor....)
From the 4H chart
Both MACD & KDJ turned around giving reversal signs.
MACD - although still below zero level but we can see the lines are curving up.
KDJ - turned into bullish green zone, indicating uptrend signal.
The 1H chart - the Index moving within the box. You may use BB indicator to get the range too.The previous range red box 19000 - 19200.
Support : 19200 if breaks then next 18960)
Resistance :19440 (if breaks then 19647, then 19945).
For day trade: Same strategy, sell at resistance; buy/TP into support.
Monitor the 1H,4H movement with confirmation using MACD & KDJ indicator.
For swing trade : Set your tf, entry and exit plan.
For slightly mid-long term trade (more than 9months - 36months++) : You may plan and DCA the Index. You may take a long position on HSI Tracker Fund 2800. HKEX:2800
The index is currently in a discount zone, check the historical price; there are ample of room to reach its ATH @33500. The law of attraction; we know that whatever bottom eventually rebound, it's the matter of time.
DYODD. Plan your trade, do not listen to anyone including this post!
Profitable traders/investors take contrarian moves. It's challenging but worth spending some time to think:- Ultimately what we want to achieve from our action/trading...
Sticktoyourplan follow your trading strategy. Set your SL/TP.
Once set, you may zen with 📙 and 🍵 wait for the results.
Happy Trading Everyone!
dancing cha-cha within the range ; be cautiousPEPPERSTONE:HK50
HSI:HSI
Helloy bello everyone!
Seems like the party ain't ending soon, is dancing cha-cha for the past few 1H candles
From the 4H, it seems inching down.
as the MACD & KDJ both indicating bearish mode.
Cross-checked with broader tf chart - D chart. And it's at oversold zone; keep an eye as it may rebound.
The 1H chart - the Index grasping at the level between 19200-19500
Support : 19200 (yesterday texted 19224; if breaks then next 18960)
Resistance :19500 (if breaks then 19650).
For day trade: same strategy, sell at resistance (19370-19400); buy/TP at support (19250-19270).
Monitor the 1H,4H movement with confirmation using MACD & KDJ indicator.
For swing trade : Set your tf, have your entry and exit plan.
For slightly mid-long term trade (more than 9months - 36months++) : You may plan and DCA the Index. You may take a long position on HSI Tracker Fund 2800 HKEX:2800
The Index is currently in a discount zone as it's traded 30% above its historical all-time-lo (ATL);
Ignore the news and plan for your long term capital gain game plan, be patience and zen.
The law of attraction; we know that whatever bottom eventually rebounds, it's a matter of time.
DYODD. Plan your trade, do not listen to anyone. You can't make the money beyond your realm of capabilities.
Sticktoyourplan follow your trading strategy. Set your SL/TP.
Once all is set, let's zen with 📙 and 🍵 wait for the results.
Happy Trading Everyone!

Do you see it as a opportunity to scoop the dip?
PEPPERSTONE:HK50
Hello everyone, good day!
PEPPERSTONE:HK50 HKEX:2800
The 1H chart - the index had lost its strength and has plunged ~300pts from its morning open @19587.
Hi : 19868 (higher than 19876 @20250105 1H Hi)
Support : 19300 ( ati point of writing broke the level; next 19130, 18965) .
Monitor if is able to stay at this level.
Resistance :19600 (if breaks then 19700). Unlikely.
www.scmp.com
Do you see it as a opportunity?
For day trade: Same strategy, sell at resistance (19353); buy/TP into support. Monitor the 1H,4H movement with confirmation using MACD & KDJ indicator. Here taking Bearish position.
For swing trade : Set your tf, entry and exit plan.
For slightly mid-long term trade (more than 9months - 36months++) : you may plan and DCA the Index. You may take a long position on HSI Tracker Fund 2800. HKEX:2800
The HSI is currently in a discount zone as it's traded 30% above its historical all-time-lo (ATL); there is ample of room to reach its ATH @33500. The law of attraction; we know that whatever bottom eventually rebounds, it's a matter of time. DYODD. Plan your trade, do not listen to anyone including this post!
Sticktoyourplan follow your trading strategy. Set your SL/TP.
Once all is set, let's zen with 📙 and 🍵 wait for the results.
Happy Trading Everyone!

Still in the awkward zone...PEPPERSTONE:HK50
Hello everyone! May everyone have a great week ahead, the weekend had past regardless you had a good one or challenging one, that had passed!
We live in now and then.
Let's see how the index doing this morning for the new start of the week and so we can plan and take action accordingly.
Are they waiting for the 2025-2026 budget speech in Feb; after CNY?
News are distraction. If you are using chart pattern, technical analysis to forecast the price movement; stick to it! Although sometimes news can be catalyst to price movement, as long we stick to our plan and continue to practice and adhere to our own SOP, our trades will not go too far off.
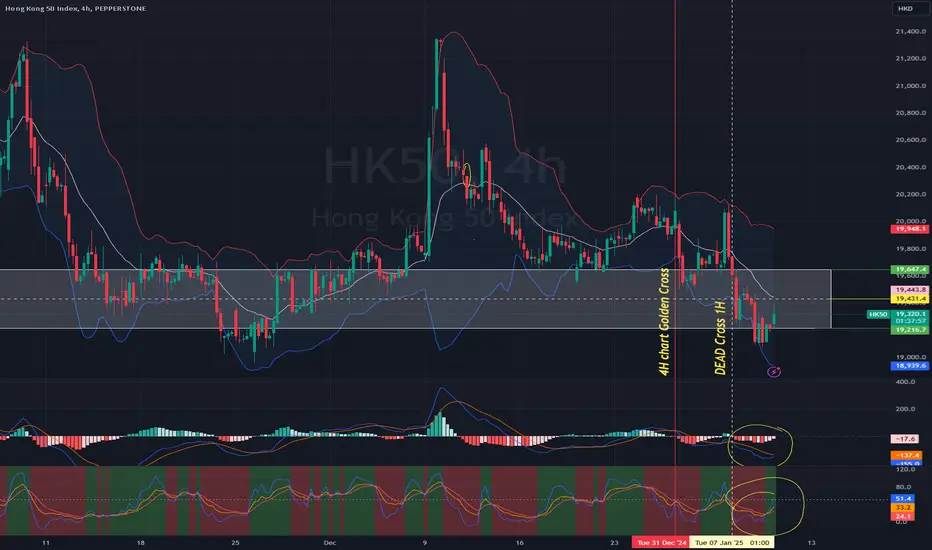
From D chart
What we can see is the MACD,Signal is getting weak , histogram is weak the signal line is breakthrough the zero line. We should monitor close by end of today if it crosses down the zero line.
Let's not go against the trend, trend is always our friend! ☺ However, for the index it seems currently is no trend...awkward. haha
The 4h Chart - the pricing had turned bearish since 31/12/24 as marked (Dead Cross).
Support : 19311
Resistance :20220
The 1H chart - the index dancing within the range bound as we noticed from chart.
Hi : 19868 (higher than 19876 @20250105 1H Hi)
Support : 19630 (if breaks then next 19311)
Resistance :19850 (if breaks then 19980 ;52EMA)
For day trade: Same strategy, buy into support, sell at resistance and monitor.
For swing trade : depends your time frame (tf); once the 1h hour chart MACD indicator crossing up the zero line and the KDJ turned green. May take bullish position.
Sticktoyourplan follow your trading strategy. Set your SL/TP.
Once all is set, let's zen with 📙 and 🍵 wait for the results.
Happy Trading Everyone!

2025 NewYear Party with severe Hangover again!PEPPERSTONE:HK50
Happy New Year everyone!
1h Chart
From the chart we can see the 1h MACD forming Golden Cross on last 31/12/2024 0900; it was pumped to have a nice closure for 2024 and went for a heavy party.
This morning, as we can see the hangover hits quite severely! The index plunged more than 500bps this morning.
The MACD indicator now is forming Deadcross and in its bearish mode. The KDJ is also in its bearish zone.
Today the index could find support at 19453 and resistance at 19753.
D Chart
Well, we wish we had a crystal ball.
From the D chart, the MACD line crosses the Signal line forming a Deadcross. However, the Signal line is yet to cross below zero although the KDJ is already in its bearish zone.
Do not be swayed by the news, stick to your plan and set your TP/SL.
Do not anticipate and speculate how the markets move, we can only react with Buy,Hold or Sell.
Let's monitor the movement and practice your zentrading strategy.
Happy trading everyone!
Wishing you the best coming to you this 2025!
Let's continue 🧘♂️ Zen-ing with 📙 and 🍵.

Hang Seng Index H1 | Falling to overlap supportThe Hang Seng Index (HKG33) is falling towards an overlap support and could potentially bounce off this level to climb higher.
Buy entry is at 19,905.23 which is an overlap support that aligns with the 50.0% Fibonacci retracement.
Stop loss is at 19,540.00 which is a level that sits under a multi-swing-low support.
Take profit is at 20,522.59 which is a multi-swing-high resistance that aligns close to the 50.0% Fibonacci retracement.
High Risk Investment Warning
Trading Forex/CFDs on margin carries a high level of risk and may not be suitable for all investors. Leverage can work against you.
Stratos Markets Limited (www.fxcm.com):
CFDs are complex instruments and come with a high risk of losing money rapidly due to leverage. 64% of retail investor accounts lose money when trading CFDs with this provider. You should consider whether you understand how CFDs work and whether you can afford to take the high risk of losing your money.
Stratos Europe Ltd (www.fxcm.com):
CFDs are complex instruments and come with a high risk of losing money rapidly due to leverage. 66% of retail investor accounts lose money when trading CFDs with this provider. You should consider whether you understand how CFDs work and whether you can afford to take the high risk of losing your money.
Stratos Trading Pty. Limited (www.fxcm.com):
Trading FX/CFDs carries significant risks. FXCM AU (AFSL 309763), please read the Financial Services Guide, Product Disclosure Statement, Target Market Determination and Terms of Business at www.fxcm.com
Stratos Global LLC (www.fxcm.com):
Losses can exceed deposits.
Please be advised that the information presented on TradingView is provided to FXCM (‘Company’, ‘we’) by a third-party provider (‘TFA Global Pte Ltd’). Please be reminded that you are solely responsible for the trading decisions on your account. There is a very high degree of risk involved in trading. Any information and/or content is intended entirely for research, educational and informational purposes only and does not constitute investment or consultation advice or investment strategy. The information is not tailored to the investment needs of any specific person and therefore does not involve a consideration of any of the investment objectives, financial situation or needs of any viewer that may receive it. Kindly also note that past performance is not a reliable indicator of future results. Actual results may differ materially from those anticipated in forward-looking or past performance statements. We assume no liability as to the accuracy or completeness of any of the information and/or content provided herein and the Company cannot be held responsible for any omission, mistake nor for any loss or damage including without limitation to any loss of profit which may arise from reliance on any information supplied by TFA Global Pte Ltd.
The speaker(s) is neither an employee, agent nor representative of FXCM and is therefore acting independently. The opinions given are their own, constitute general market commentary, and do not constitute the opinion or advice of FXCM or any form of personal or investment advice. FXCM neither endorses nor guarantees offerings of third party speakers, nor is FXCM responsible for the content, veracity or opinions of third-party speakers, presenters or participants.

HK50 Long1)Trend defined. Weekly- Daily Uptrend.
2)Contradictory entry. At the lower extreme of an 1h consolidation area that is a 4h-1d key level as well.
3)Default loss. A bit lower that the swing low.
4)Default target levels. 1.72, 2.95, 4.86.
5)Risk <= 3%
6)Singular trade.
7)Trades placed today <= 5.

"HK50 / Hong Kong 50" Index Market Bullish Heist Plan🌟Hi! Hola! Ola! Bonjour! Hallo!🌟
Dear Money Makers & Robbers, 🤑 💰
Based on 🔥Thief Trading style technical analysis🔥, here is our master plan to heist the "HK50 / Hong Kong 50" Index market. Please adhere to the strategy I've outlined in the chart, which emphasizes long entry. Our aim is the high-risk Red Zone. Risky level, overbought market, consolidation, trend reversal, trap at the level where traders and bearish robbers are stronger. 👀 So Be Careful, wealthy and safe trade.💪🏆🎉
Entry 📈 : You can enter a Bull trade at any point,
however I advise placing Buy limit orders within a 15 or 30 minute timeframe. Entry from the most recent or closest low or high level should be in retest.
Stop Loss 🛑: Using the 4H period, the recent / nearest low or high level.
Goal 🎯: 21,600
Scalpers, take note : only scalp on the Short side. If you have a lot of money, you can go straight away; if not, you can join swing traders and carry out the robbery plan. Use trailing SL to safeguard your money 💰.
Warning⚠️ : Our heist strategy is incompatible with Fundamental Analysis news 📰 🗞️. We'll wreck our plan by smashing the Stop Loss 🚫🚏. Avoid entering the market right after the news release.
Take advantage of the target and get away 🎯 Swing Traders Please reserve the half amount of money and watch for the next dynamic level or order block breakout. Once it is resolved, we can go on to the next new target in our heist plan.
💖Supporting our robbery plan will enable us to effortlessly make and steal money 💰💵 Tell your friends, Colleagues and family to follow, like, and share. Boost the strength of our robbery team. Every day in this market make money with ease by using the Thief Trading Style.🏆💪🤝❤️🎉🚀
I'll see you soon with another heist plan, so stay tuned 🫂

at least a meal treat for the weekend!FX:HKG33
Hello everyone, from the D chart, the index seems dancing within the dancefloor.
From 1h chart
today trade plan : same old same old strategy sell into resistance and buy at support.
From the shorter tf we can notice probably end of the week and index seems giving meal treat.
🥩 🦃.
For the first hours from the MACD signal and KDJ it seems bullish.
Long for the first half; continue to monitor see if it breakthrough 19975/20000.
Happy trading everyone!
Stick to your plan, set your SL/TP. Let's zen with 📙 and 🍵 while waiting for the meal treat and show your gratitude and love the Index although sometimes it doesnt go according to our plan. 🥂
