Elliott Wave Count for Brazil's IBOVO IBOV parece estar no final de uma onda C Menor, dentro de uma (4) Intermediária, que faz parte de uma onda (I) Primária.
O início da onda (5) está iminente e deve levar o IBOV até 55K. A partir dalí, devemos ficar atentos ao final da onda (5) e (I).
Essa contagem leva em consideração o humor social bastante negativo que dominou a percepção de investidores e não-investidores sobre o Brasil, especialmente no segundo semestre de 2015.
O Fundo de Janeiro de 2016 seria então o final de uma correção(baixista) de uma onda de grau Cíclico(altista). Esta correção teve seu início em Abril/2008!
--------------------------------------------------------------------------
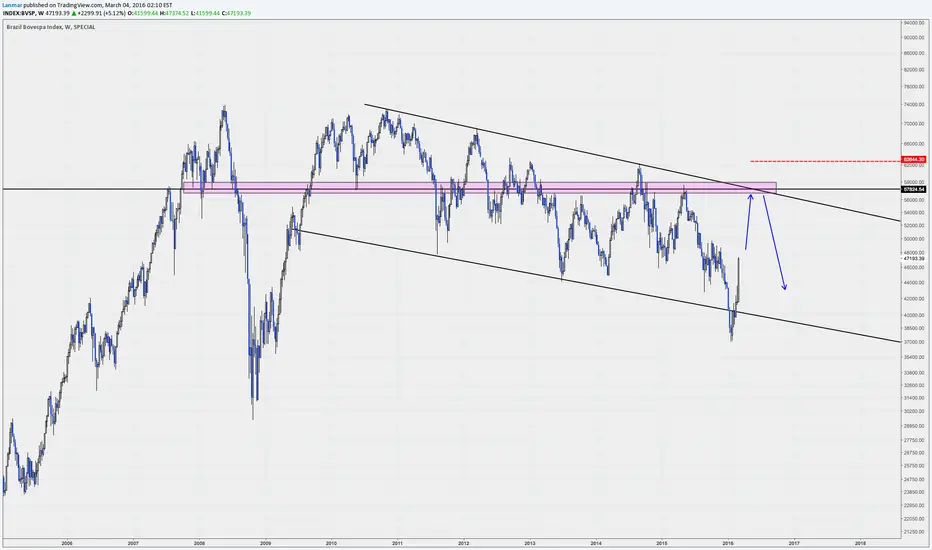
Brazilian Stock Index IBOV looks as though it is at the end of a Minor C Wave, which is part of an Intermediary (4)th wave inside a Primary Wave (I).
The start of Wave (5) is imminent and should carry the IBOV back to 55k. From then, we should look out for the completion of Waves (5) and (I).
This count takes into account the negative mood that took over investors and non-investors perception on Brazil alike, specially in the last semester of 2015.
The January 2016 Bottom would then be the end of a (bearish)correction of a long (bullish)Cyclic degree wave. This correction started back in April 2008!
IBOV trade ideas

The index bovespa near of a line of trend down.The index is near a line of trend down in 56000 points, where the market can presenting strong resistance for the continuation of high trend. If waiting for the next days a correction, because the index did a long leg of de high with several days of high.
The my expectative for the moment is a correction for the nivel of 53000 points for the continuation the trend high.


strong correction aheadCorrection at IBOV, with a estimated fall of 4.7% approximately giving a 50% retrace of previous rally.


BOVESPA BREAKING MONTLY CORRECTION?Bovespa has completed a complex 5 wave structure to the downside and seems ready to break the montly correction. I'm expecting the completion of an ABC pattern to the upside to break the last trendline of that stucture. Bullish divergence on weekly. Look at the comment to see a snapshot for the monthly general structure.

Brazilian Bovespa Index: Long Term Fairly high probability we see the Bovespa index trade to the downside. This is a great trade because it presents us with multiple opportunities if the stop gets triggered (with a close on the weekly time frame).
Pay Attention to the correlation between USDBRL and Bovespa Index - extremely important as Brazil´s equity market has proven to be extremely sensitive to its currency (for now). Notice Brazil trades lower when BRL weakens ' quite the opposite with other markets, such as the Nikkei and the Yen.
If we see the 3.20´s get hit while the reaching resistance in the Bovespa it should indicate a great entry. (Though this is usually unlikely to occur at the same time.)

????I am sure that there are big opportunities here, but how to interpret? It looks like a downtrend, and it is testing the support...

IBOV decision triangleI see a decision region for the IBOV for the short term (less than a month). The breakout of this triangle shaped figure will determine the direction the index will take for longer terms.

My long term take on the IBOVNeutral as it gets.
Bearish if the flag that is happening right now breaks - until a reverse pattern appears.
Bullish if the flag fails.


Bovespa Symmetrical Downtrend Moves Back to a 1.618 Extension.The Bovespa has been forming a symmetrical downward trend followed by a 1.618 extension of the longer bull trend. You can see this in the chart by the first light blue fib retracement, and then I used a green arrow to indicate where the second retracement line is compared to the green 1.618 retracement line. The second to last move down is a bit tricky as it extended further than the previous downward moves (indicated by the dashed blue trend lines) and did not fully retrace back to its 1.618 extension of the larger trend. Instead it only retraced back to the .786 fib line and again made a downward move extremely similar to past downward moves (again indicated by the dashed blue lines.) It may be forming a double bottom, especially if it finishes out its symmetrical downward trend line, which is about where it’s at. If this is the case, expect a move again back to its 1.618 retracement. This mark is also important as it overlaps the much larger downward trend that started back in November of 2015. These retracement lines overlap almost perfectly and is indicates strong resistance.
Target Price: is 55975-56007 by early to mid-June. I would actually rate this quite conservative as the upward extensions seem to happen in a 5-ish day time cycle sometimes followed by a week of slowly moving bullish trends indicating indecision.
Make sure to give it time to play out its double bottom which Should be slightly higher than its first bottom of 49907.77 and be sure to use a smaller time frame chart for your entry. To play this index I may use a leveraged ETF like BRZU.
Please Like and share and follow for future symmetrical and perhaps non symmetrical analysis.
Thanks!

IbovespaTrend changing? Look for 48K, then for 47K supports. Brazil´s fundamentals are critic just now. Major firms are overpriced. There are some of them that are cheap, but it is a hard mining job. Technical surprises loom over their heads. Volatility is very high.


Bovespa Index The weakening of the Real will likely bring further losses in this index. A strengthening of the Real will continue to bring gains in the Bovespa index.
See correlation in chart below. It's been statistically significant for 16 years, and is ongoing.

long for 2016 on BVSP (Bovespa)Well, a lot of stuff is going on here on Brazil, Political uncertainty and Economics fundamentals are terrible. The government, for sure, is being a problem more than a solution. But despite that i still believe in a good 2016 from here, based on this analysis and other analysis of major stocks that compose the index.

IBOVResistence at 49,175; support at 43,845. Look for politic affairs. Once the impasse is broken the market will trend up. Wait for 3 months and monitor the IBOVESPA trend.


Gartley into cypher on IbovespaGartley (blue triangles) has completed with profit targets as indicated by the green lines.
This could potentially run into a completion of a cypher pattern .
Sell the Ibovespa now, and if it reaches there, buy at 40,000.

BVSP BRAZIL MADE IN JANUARY 2016The Brazilian economy Bad in the world news bad for investors , at the moment so just wait a bit till around the end of 2016 - 17 when they hungered out .

